| Param | Original file | Final file |
|---|---|---|
| Filename | modeM0/AS1G05_240T01_9000000536_04183cztM0_level2.evt | modeM0/AS1G05_240T01_9000000536_04183cztM0_level2_quad_clean.evt |
| Size (bytes) | 506,116,800 | 55,797,120 |
| Size | 482.7 MB | 53.2 MB |
| Events in quadrant A | 3,936,438 | 318,205 |
| Events in quadrant B | 3,418,781 | 325,402 |
| Events in quadrant C | 3,029,137 | 312,632 |
| Events in quadrant D | 4,521,837 | 298,822 |
| Mode SS | |||
|---|---|---|---|
| Quadrant | BADHDUFLAG | Total packets | Discarded packets |
| A | 0 | 126 | 0 |
| B | 0 | 126 | 0 |
| C | 0 | 126 | 0 |
| D | 0 | 126 | 0 |
| Mode M9 | |||
|---|---|---|---|
| Quadrant | BADHDUFLAG | Total packets | Discarded packets |
| A | 0 | 13 | 0 |
| B | 0 | 13 | 0 |
| C | 0 | 13 | 0 |
| D | 0 | 13 | 0 |
| Mode M0 | |||
|---|---|---|---|
| Quadrant | BADHDUFLAG | Total packets | Discarded packets |
| A | 0 | 15868 | 3 |
| B | 0 | 13892 | 2 |
| C | 0 | 12900 | 2 |
| D | 0 | 17632 | 2 |
| Quadrant | Total seconds | Saturated seconds | Saturation percentage |
|---|---|---|---|
| A | 6218 | 276 | 4.438726% |
| B | 6218 | 152 | 2.444516% |
| C | 6218 | 69 | 1.109682% |
| D | 6219 | 201 | 3.232031% |
Noise dominated data is calculated using 1-second bins in cleaned event files. If a bin has >2000 counts, and if more than 50% of those come from <1% of pixels, then it is considered to be noise-dominated and hence unusable.
| Quadrant | # 1 sec bins | Bins with >0 counts | Bins with >2000 counts | High rate bins dominated by noise | Noise dominated (total time) | Noise dominated (detector-on time) | Marked lightcurve |
|---|---|---|---|---|---|---|---|
| A | 7518 | 6219 | 100 | 100 | 1.33% | 1.61% | 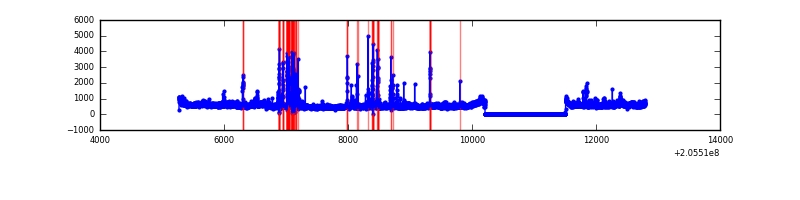 |
| B | 7518 | 6219 | 48 | 48 | 0.64% | 0.77% | 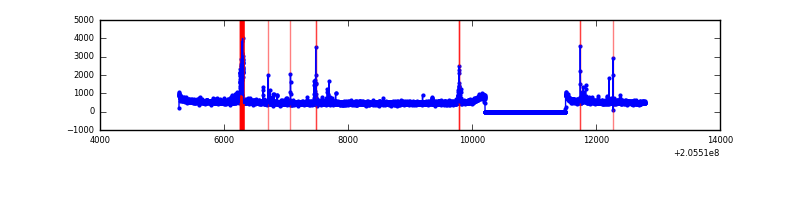 |
| C | 7518 | 6219 | 0 | 0 | 0.00% | 0.00% | 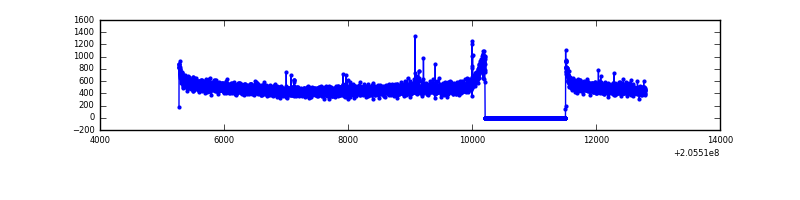 |
| D | 7519 | 6220 | 107 | 107 | 1.42% | 1.72% | 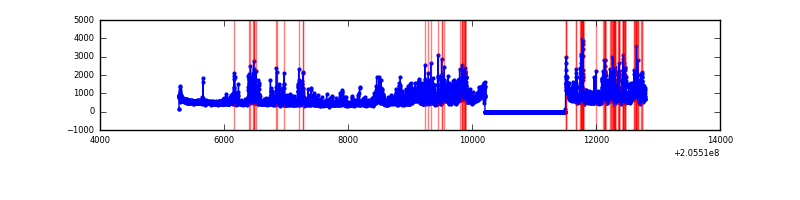 |
Top three noisy pixels from each quadrant. If the there are fewer than three noisy pixels in the level2.evt file, extra rows are filled as -1
| Pixel properties | Quadrant properties | ||||||
|---|---|---|---|---|---|---|---|
| Quadrant | DetID | PixID | Counts | Sigma | Mean | Median | Sigma |
| A | 0 | 118 | 420055 | 2636.34 | 793 | 779 | 159.0 |
| A | 3 | 1 | 350147 | 2196.77 | 793 | 779 | 159.0 |
| A | 0 | 226 | 46845 | 289.66 | 793 | 779 | 159.0 |
| B | 10 | 16 | 170799 | 1096.77 | 810 | 793 | 155.0 |
| B | 4 | 48 | 35019 | 220.8 | 810 | 793 | 155.0 |
| B | 7 | 252 | 25194 | 157.42 | 810 | 793 | 155.0 |
| C | 10 | 65 | 16219 | 86.39 | 769 | 773 | 178.8 |
| C | 13 | 61 | 6505 | 32.06 | 769 | 773 | 178.8 |
| C | 9 | 144 | 4560 | 21.18 | 769 | 773 | 178.8 |
| D | 12 | 233 | 992619 | 5399.77 | 763 | 743 | 183.7 |
| D | 13 | 46 | 437024 | 2375.11 | 763 | 743 | 183.7 |
| D | 13 | 239 | 81148 | 437.72 | 763 | 743 | 183.7 |
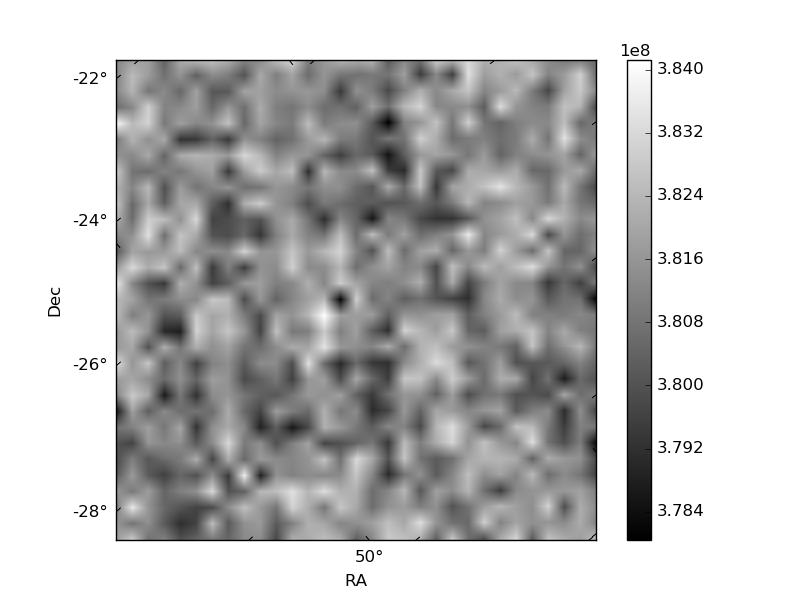
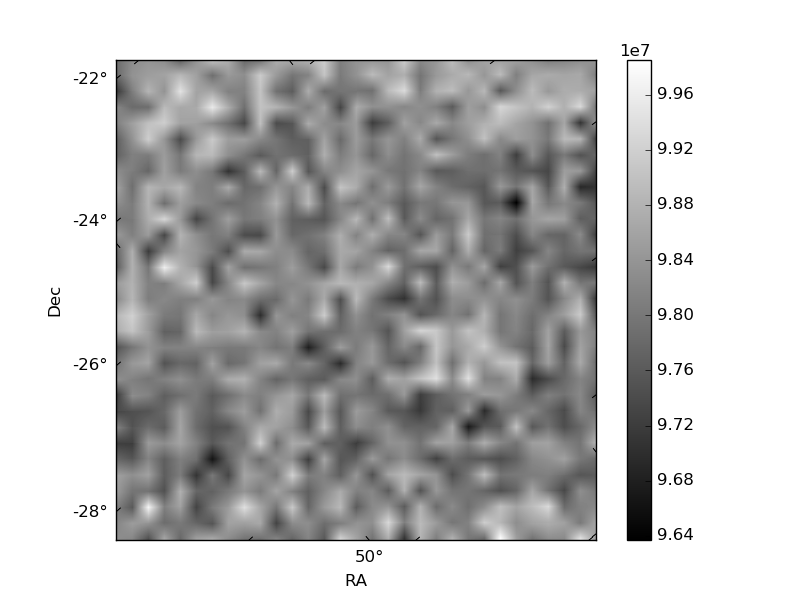
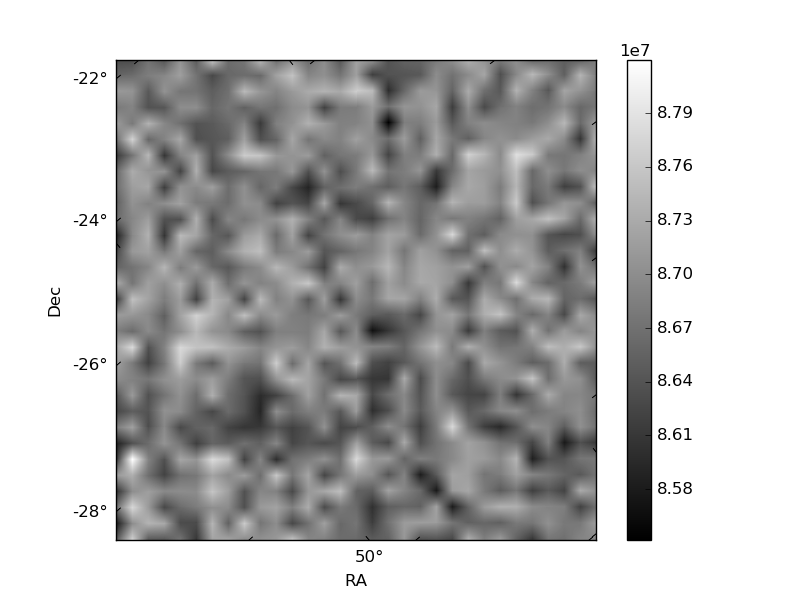
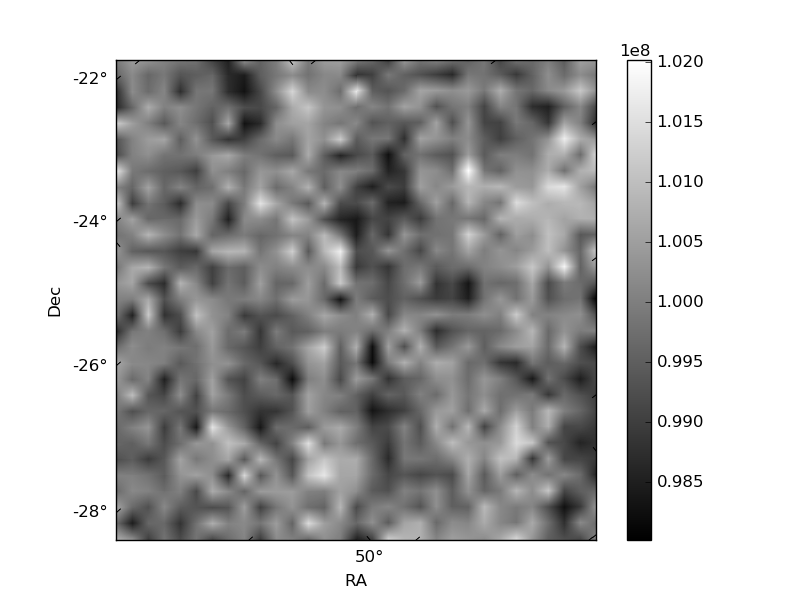
Histogram calculated using DETX and DETY for each event in the final _common_clean file
| Quadrant A | 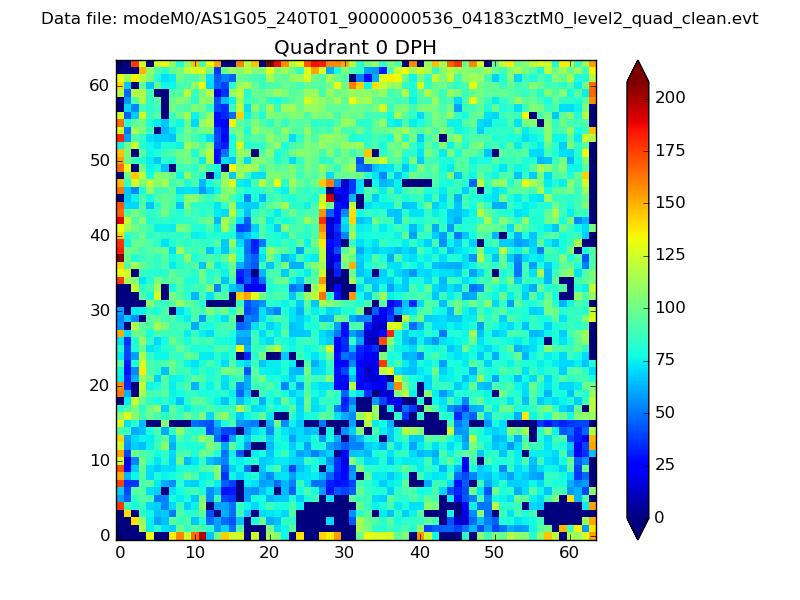 |
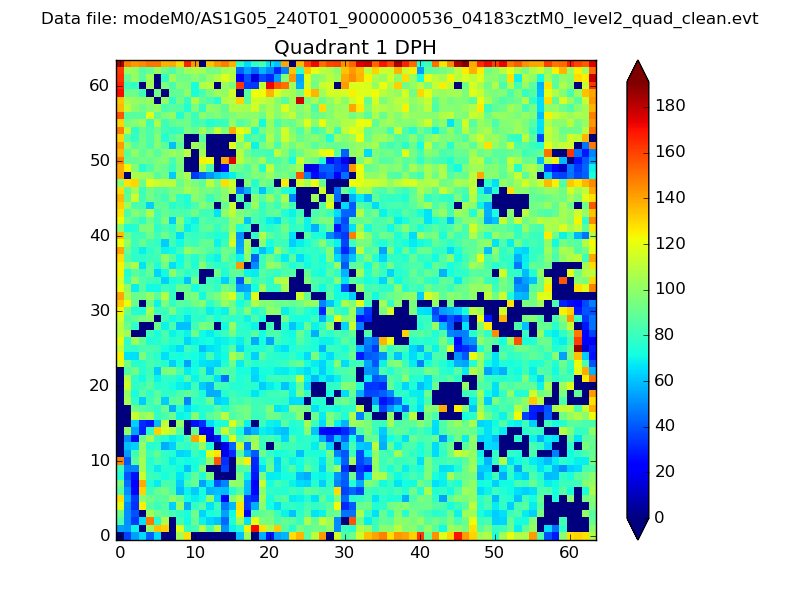 |
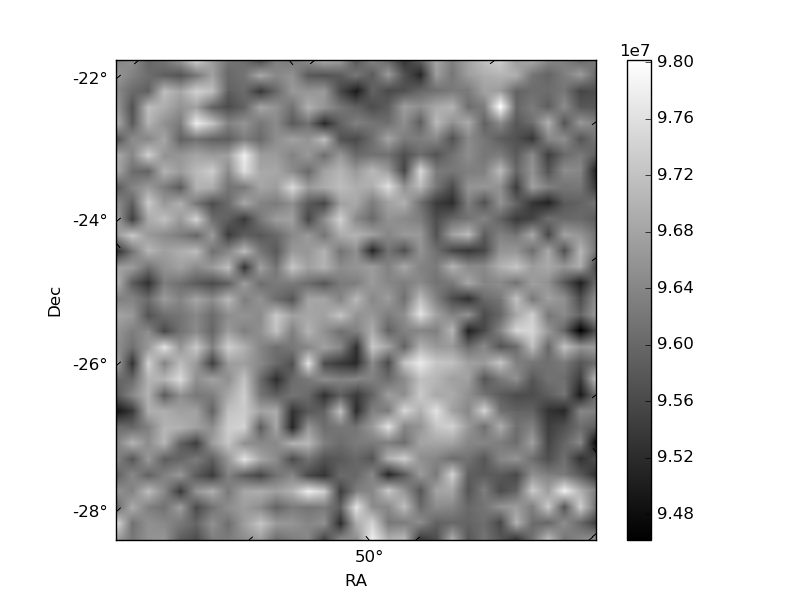
Quadrant B |
|---|---|---|---|
| Quadrant D | 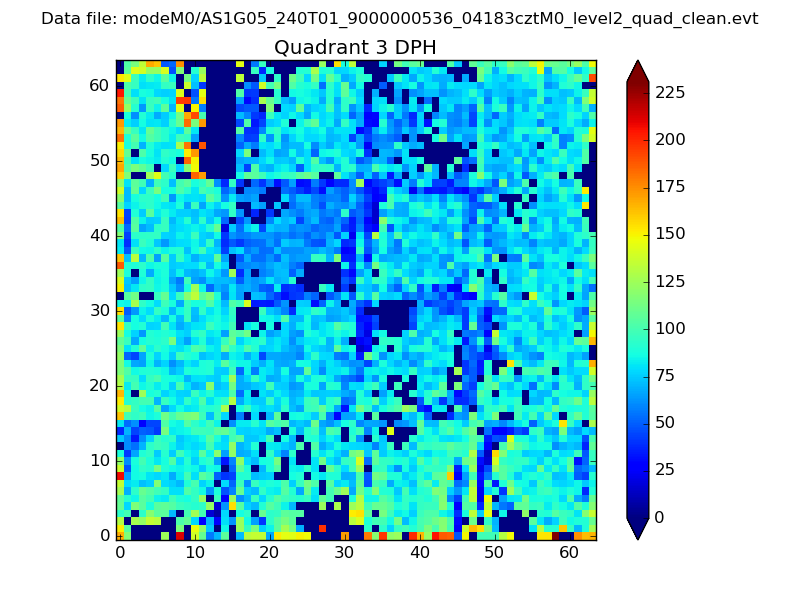 |
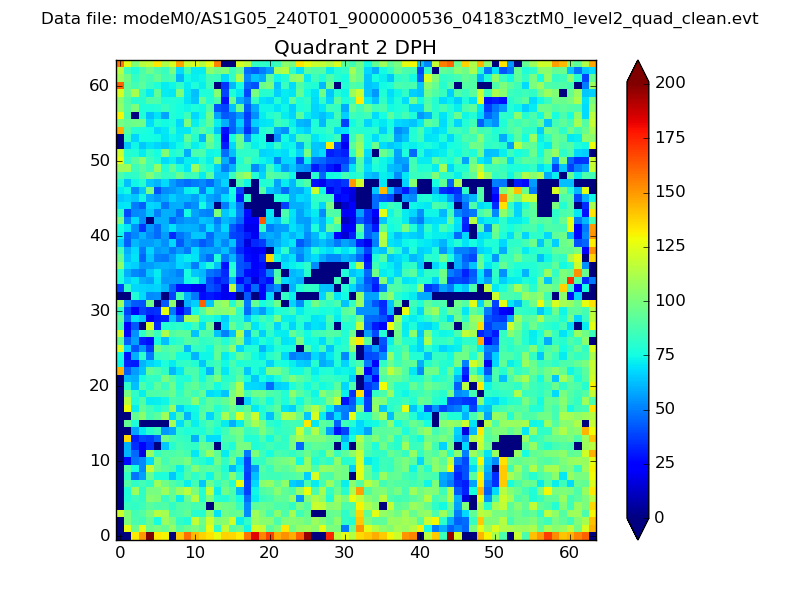 |
Quadrant C |
| Plot type | Count rate plots | Images |
|---|---|---|
| Comparison with Poisson distribution Blue bars denote a histogram of data divided into 1 sec bins. Red curve is a Poisson curve with rate = median count rate of data. |
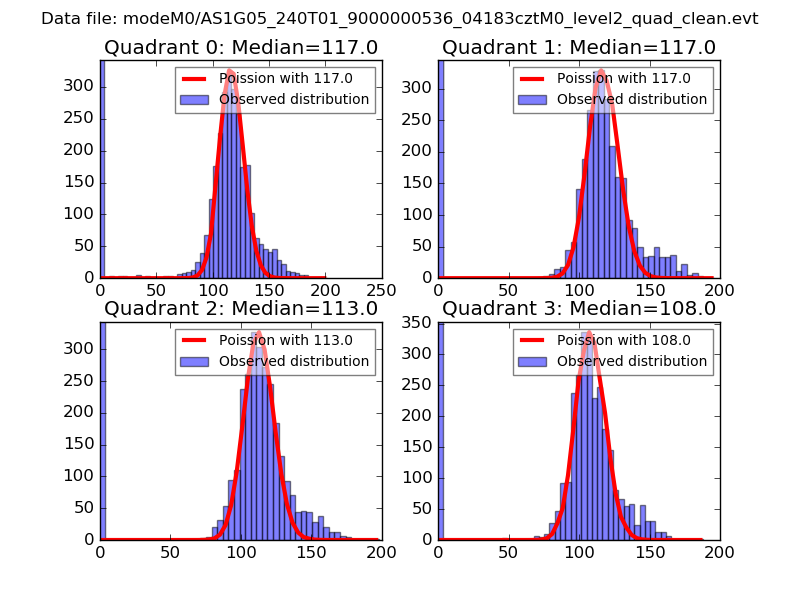 |
 |
| Quadrant-wise count rates Data is divided into 100 sec bins |
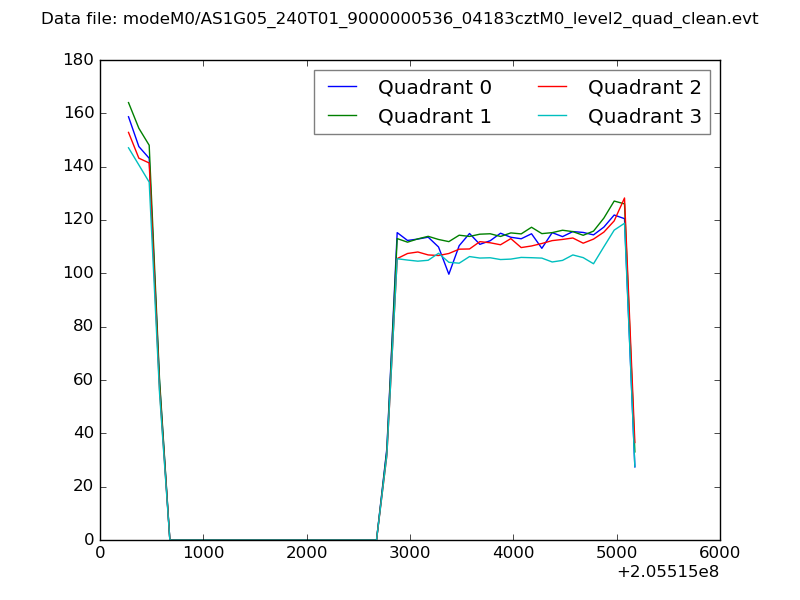 |
|
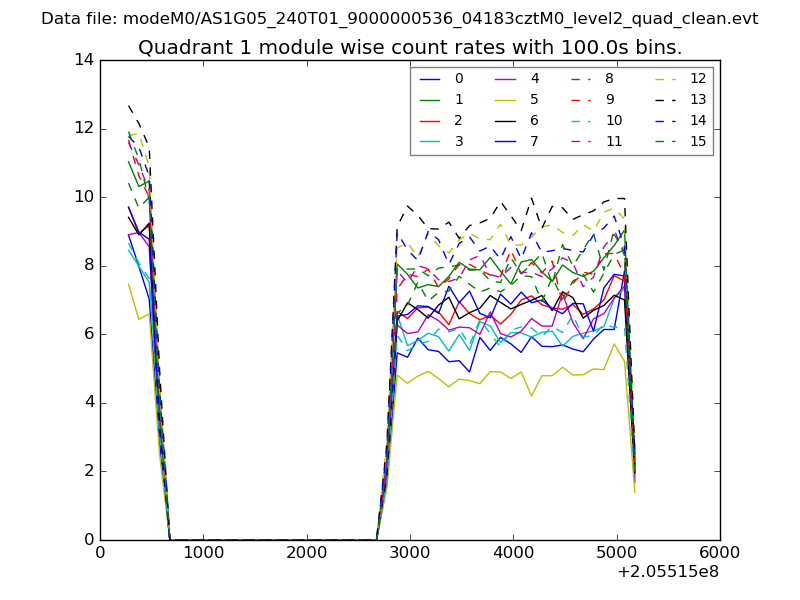
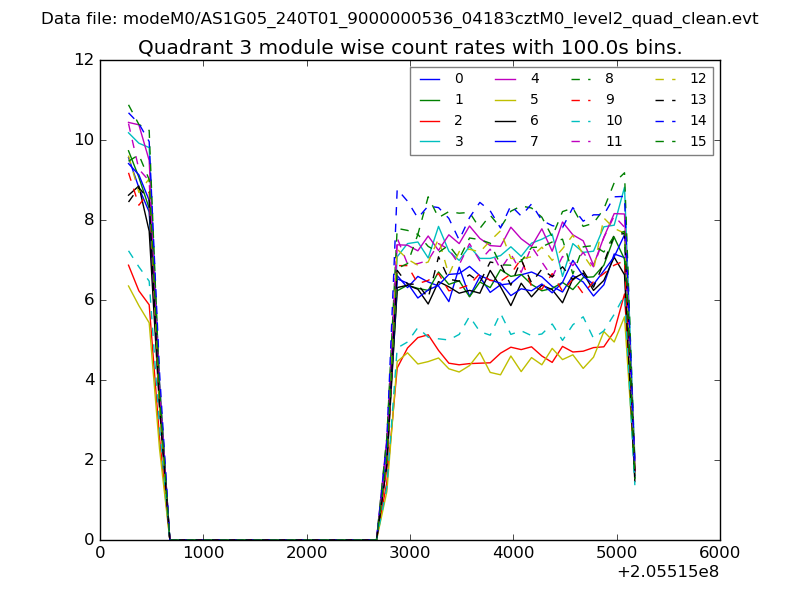
| Module-wise count rates for Quadrant A Data is divided into 100 sec bins |
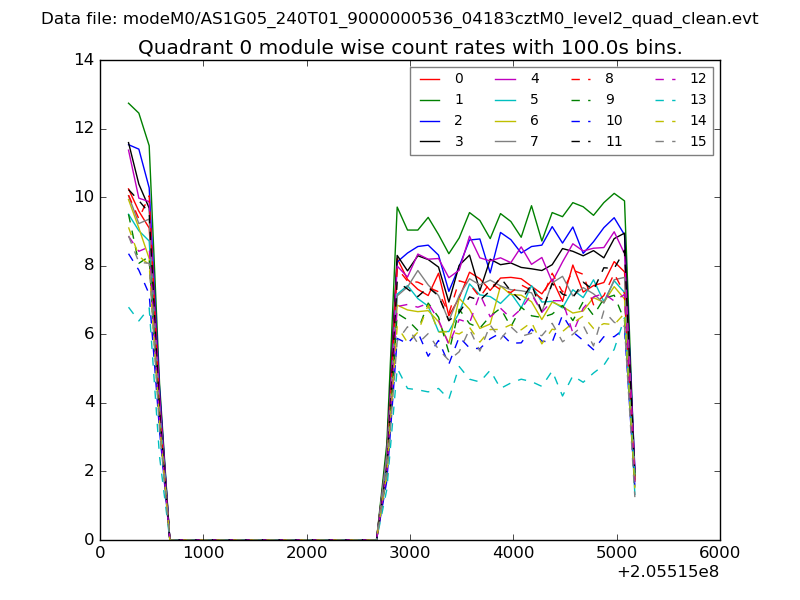 |
 |
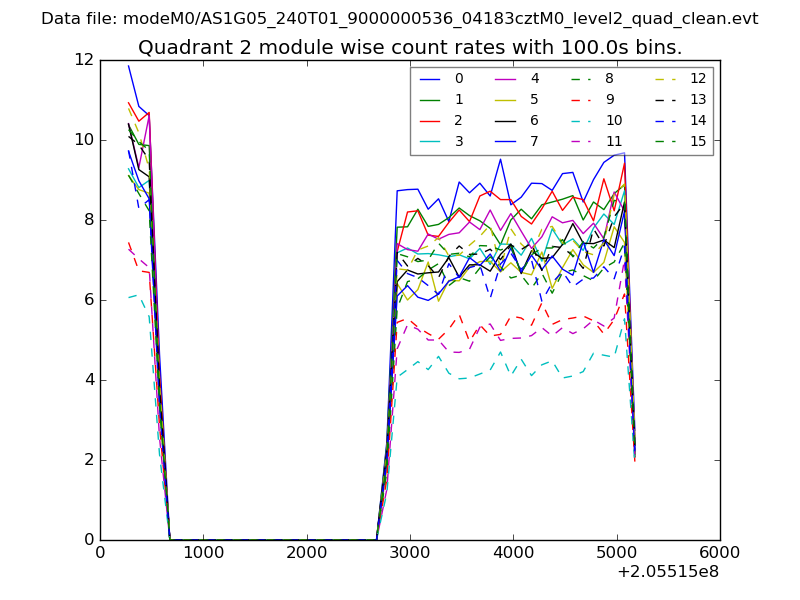
| Module-wise count rates for Quadrant B Data is divided into 100 sec bins |
 |
 |
| Module-wise count rates for Quadrant C Data is divided into 100 sec bins |
 |
 |
| Module-wise count rates for Quadrant D Data is divided into 100 sec bins |
 |
 |
| Parameter | Plot |
|---|---|
| CZT HV Monitor | 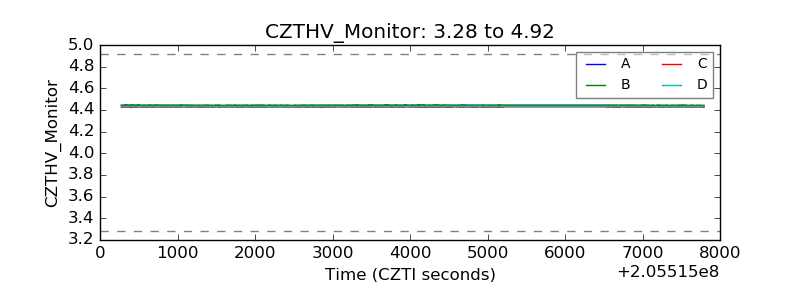 |
| D_VDD | 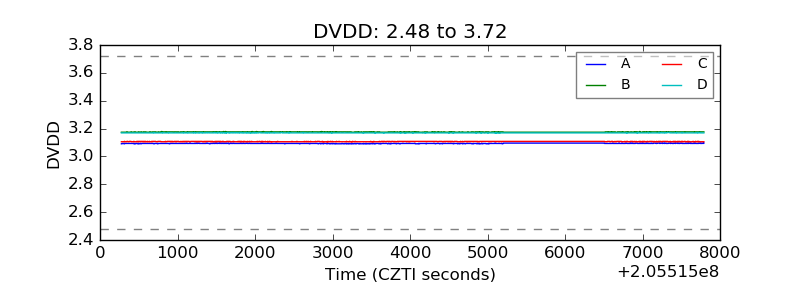 |
| Temperature 1 | 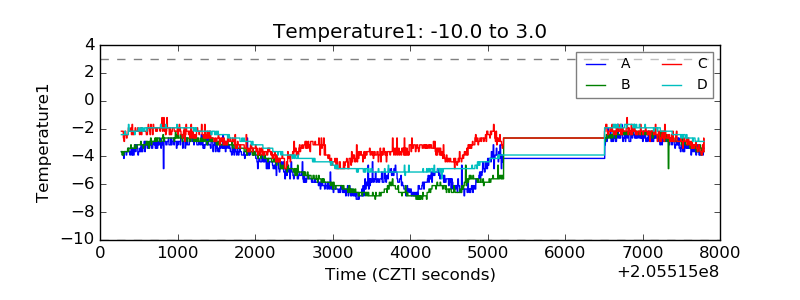 |
| Veto HV Monitor | 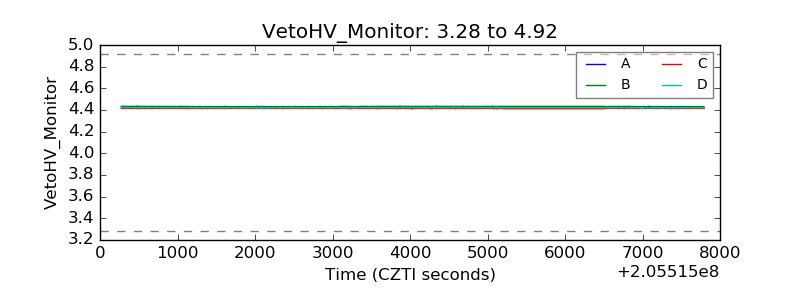 |
| Veto LLD | 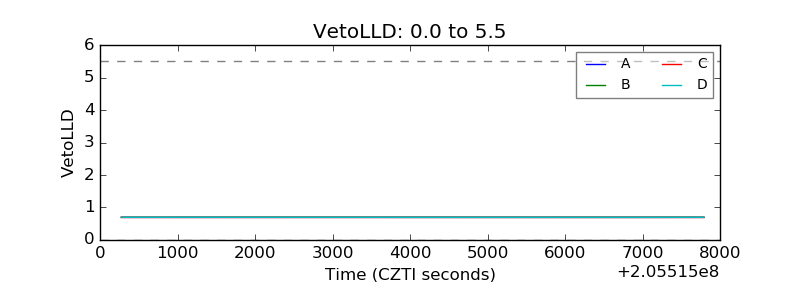 |
| Alpha Counter | 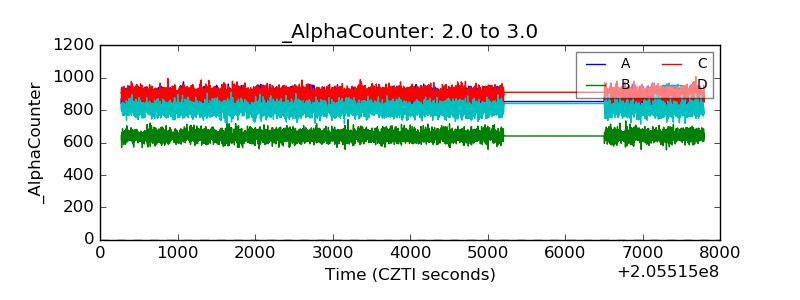 |
| _CPM_Rate | 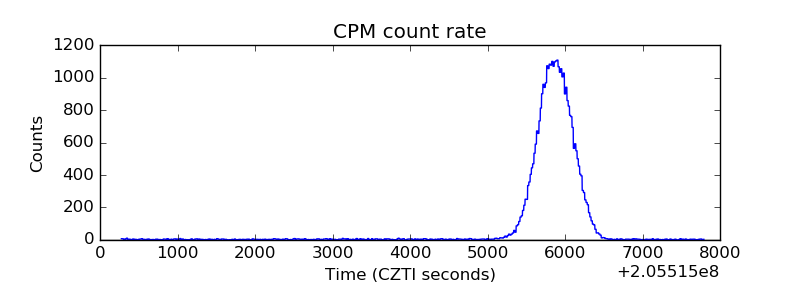 |
| CZT Counter | 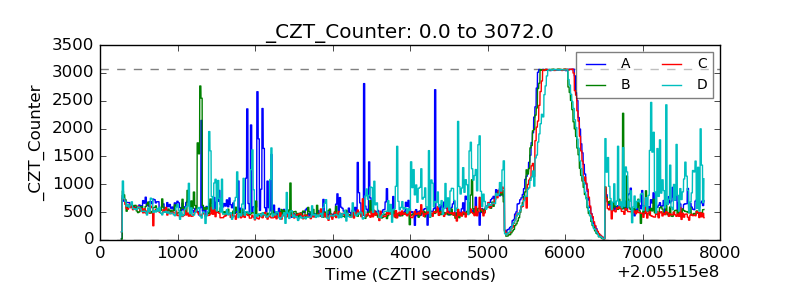 |
| +2.5 Volts monitor |  |
| +5 Volts monitor |  |
| _ROLL_ROT | 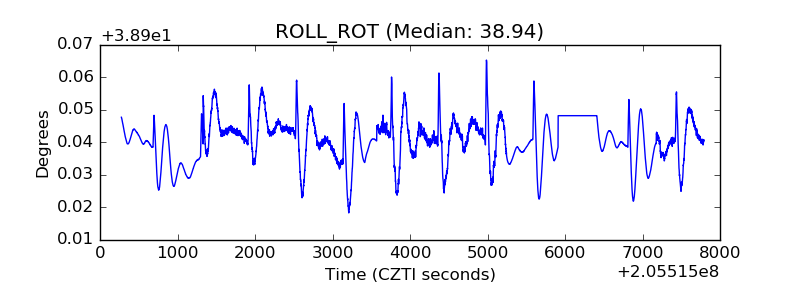 |
| _Roll_DEC | 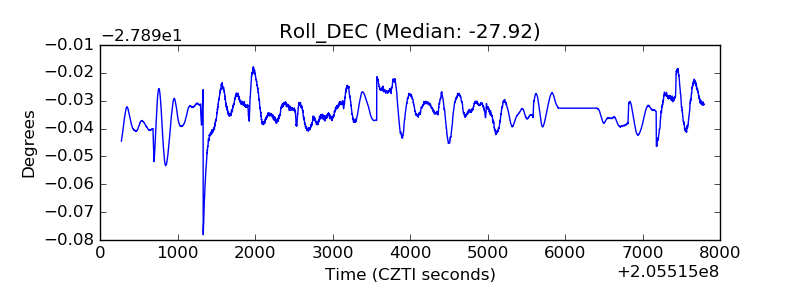 |
| _Roll_RA |  |
| Veto Counter | 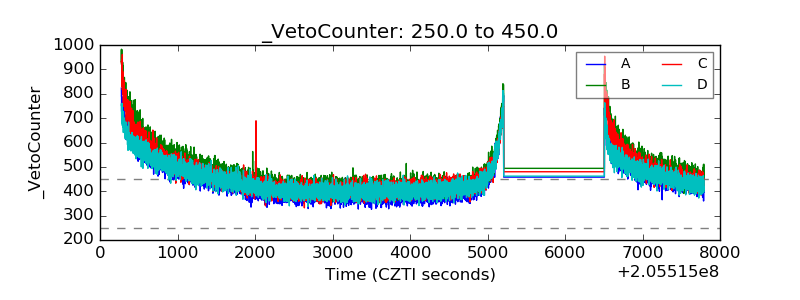 |