| Param | Original file | Final file |
|---|---|---|
| Filename | modeM0/AS1G05_240T01_9000000536_04185cztM0_level2.evt | modeM0/AS1G05_240T01_9000000536_04185cztM0_level2_quad_clean.evt |
| Size (bytes) | 456,753,600 | 63,760,320 |
| Size | 435.6 MB | 60.8 MB |
| Events in quadrant A | 3,901,082 | 372,436 |
| Events in quadrant B | 3,229,243 | 378,157 |
| Events in quadrant C | 2,980,181 | 367,935 |
| Events in quadrant D | 3,279,914 | 357,671 |
| Mode SS | |||
|---|---|---|---|
| Quadrant | BADHDUFLAG | Total packets | Discarded packets |
| A | 0 | 134 | 0 |
| B | 0 | 134 | 0 |
| C | 0 | 134 | 0 |
| D | 0 | 134 | 0 |
| Mode M9 | |||
|---|---|---|---|
| Quadrant | BADHDUFLAG | Total packets | Discarded packets |
| A | 0 | 9 | 0 |
| B | 0 | 9 | 0 |
| C | 0 | 9 | 0 |
| D | 0 | 9 | 0 |
| Mode M0 | |||
|---|---|---|---|
| Quadrant | BADHDUFLAG | Total packets | Discarded packets |
| A | 0 | 15896 | 2 |
| B | 0 | 13731 | 1 |
| C | 0 | 13337 | 1 |
| D | 0 | 14376 | 1 |
| Quadrant | Total seconds | Saturated seconds | Saturation percentage |
|---|---|---|---|
| A | 6505 | 188 | 2.890085% |
| B | 6505 | 97 | 1.491161% |
| C | 6505 | 52 | 0.799385% |
| D | 6505 | 97 | 1.491161% |
Noise dominated data is calculated using 1-second bins in cleaned event files. If a bin has >2000 counts, and if more than 50% of those come from <1% of pixels, then it is considered to be noise-dominated and hence unusable.
| Quadrant | # 1 sec bins | Bins with >0 counts | Bins with >2000 counts | High rate bins dominated by noise | Noise dominated (total time) | Noise dominated (detector-on time) | Marked lightcurve |
|---|---|---|---|---|---|---|---|
| A | 7475 | 6506 | 68 | 68 | 0.91% | 1.05% | 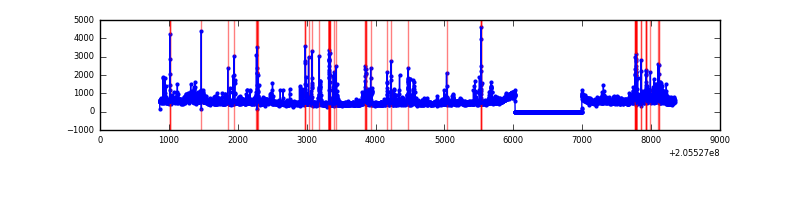 |
| B | 7475 | 6506 | 1 | 1 | 0.01% | 0.02% | 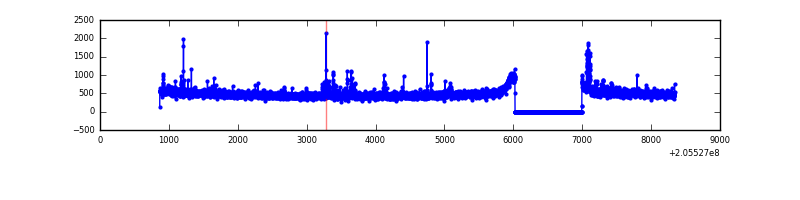 |
| C | 7475 | 6506 | 2 | 2 | 0.03% | 0.03% | 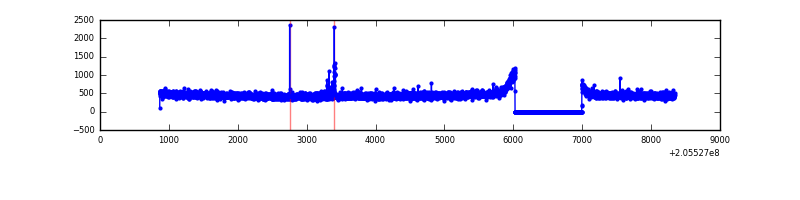 |
| D | 7475 | 6506 | 50 | 50 | 0.67% | 0.77% | 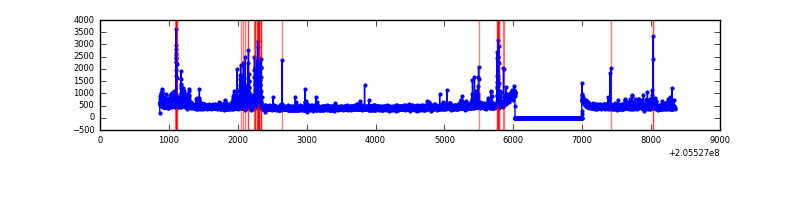 |
Top three noisy pixels from each quadrant. If the there are fewer than three noisy pixels in the level2.evt file, extra rows are filled as -1
| Pixel properties | Quadrant properties | ||||||
|---|---|---|---|---|---|---|---|
| Quadrant | DetID | PixID | Counts | Sigma | Mean | Median | Sigma |
| A | 0 | 118 | 366061 | 2293.74 | 777 | 761 | 159.3 |
| A | 3 | 1 | 206682 | 1292.99 | 777 | 761 | 159.3 |
| A | 0 | 199 | 158148 | 988.24 | 777 | 761 | 159.3 |
| B | 3 | 0 | 73143 | 471.68 | 792 | 774 | 153.4 |
| B | 4 | 48 | 23118 | 145.63 | 792 | 774 | 153.4 |
| B | 0 | 183 | 18144 | 113.21 | 792 | 774 | 153.4 |
| C | 10 | 65 | 22429 | 122.9 | 756 | 758 | 176.3 |
| C | 13 | 61 | 6243 | 31.11 | 756 | 758 | 176.3 |
| C | 9 | 144 | 4414 | 20.73 | 756 | 758 | 176.3 |
| D | 12 | 233 | 204383 | 1103.44 | 755 | 733 | 184.6 |
| D | 13 | 46 | 62099 | 332.5 | 755 | 733 | 184.6 |
| D | 13 | 239 | 56306 | 301.11 | 755 | 733 | 184.6 |
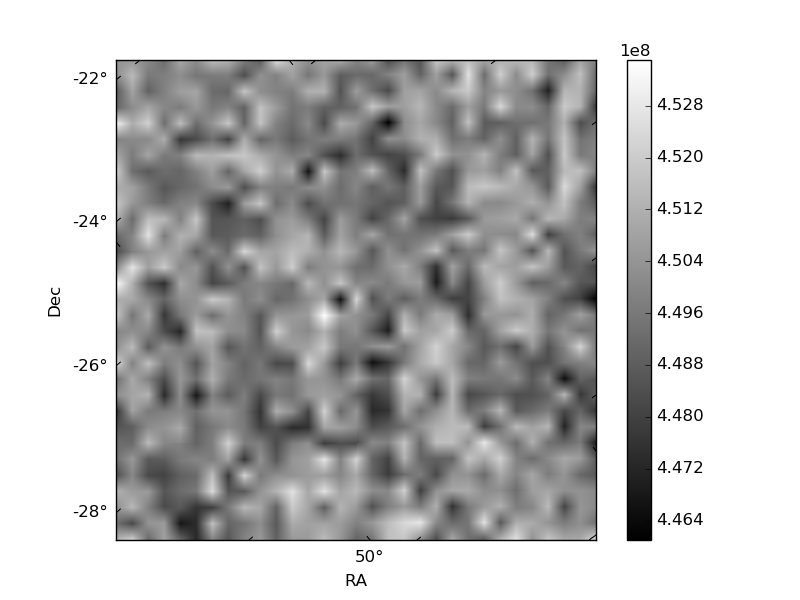
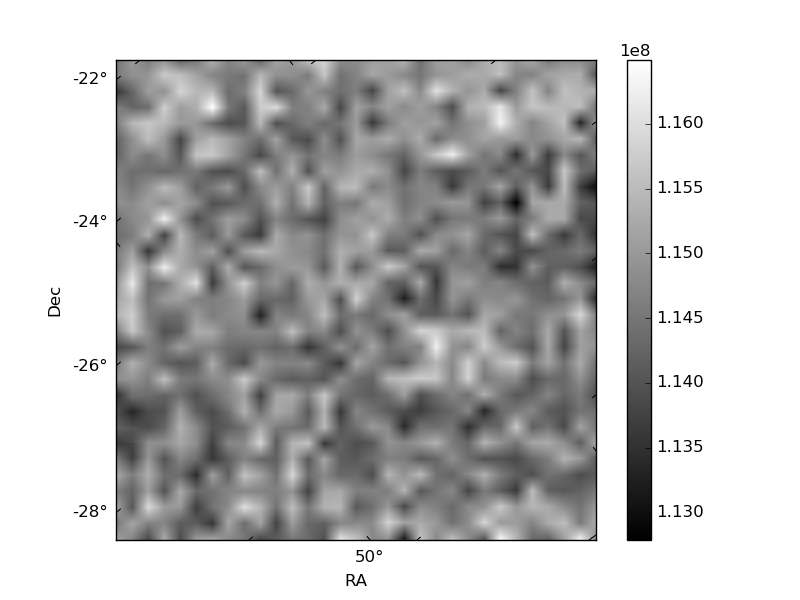
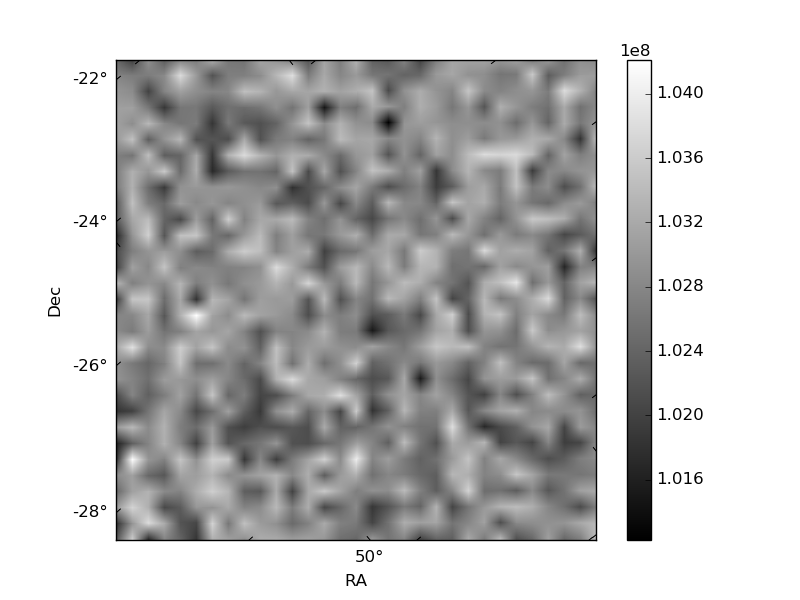
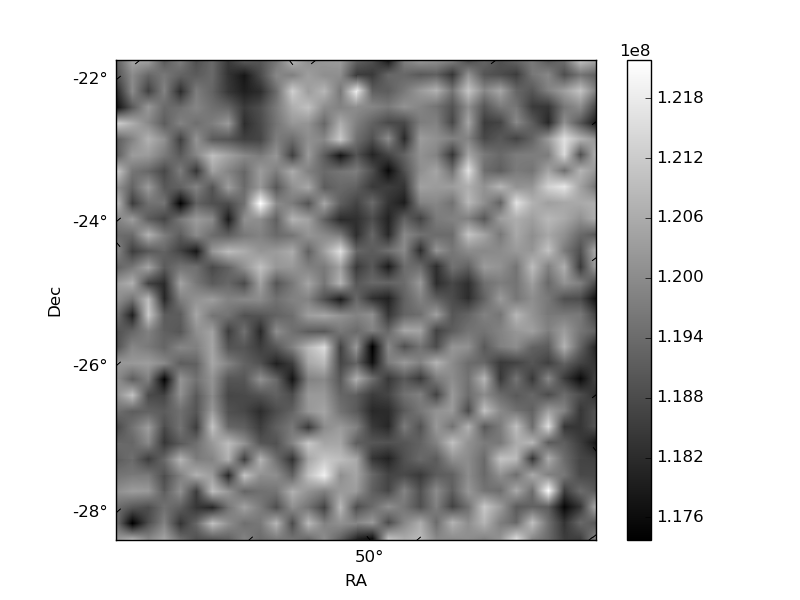
Histogram calculated using DETX and DETY for each event in the final _common_clean file
| Quadrant A | 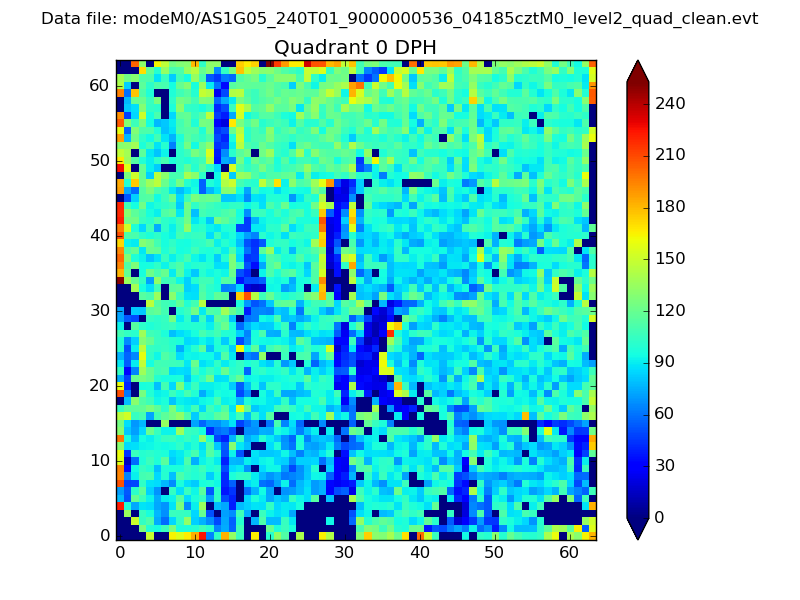 |
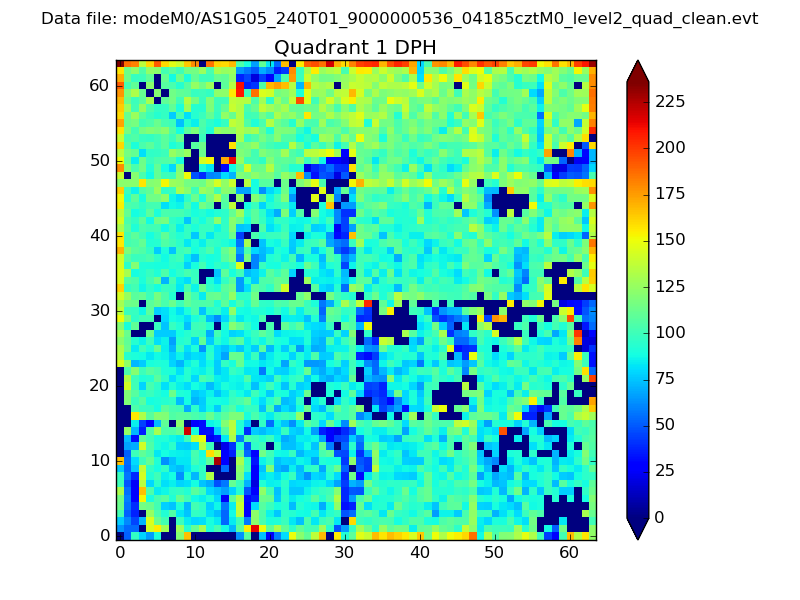 |
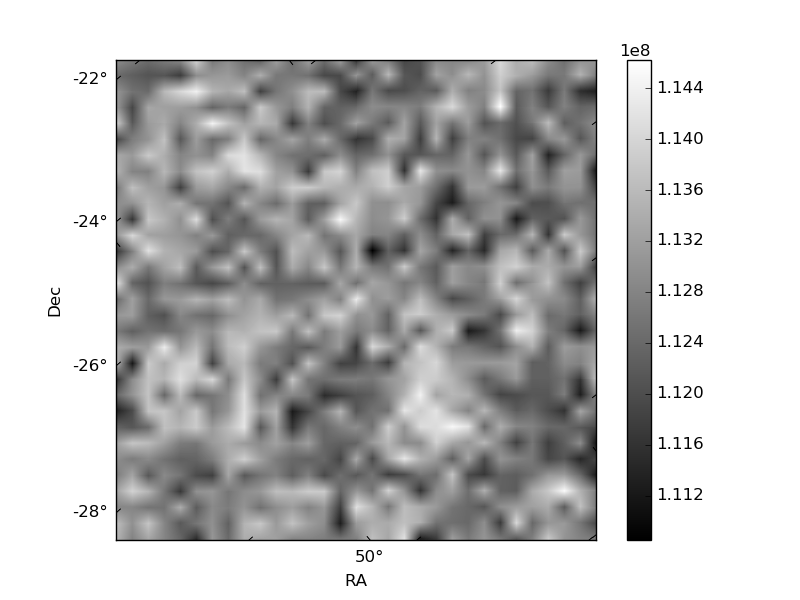
Quadrant B |
|---|---|---|---|
| Quadrant D | 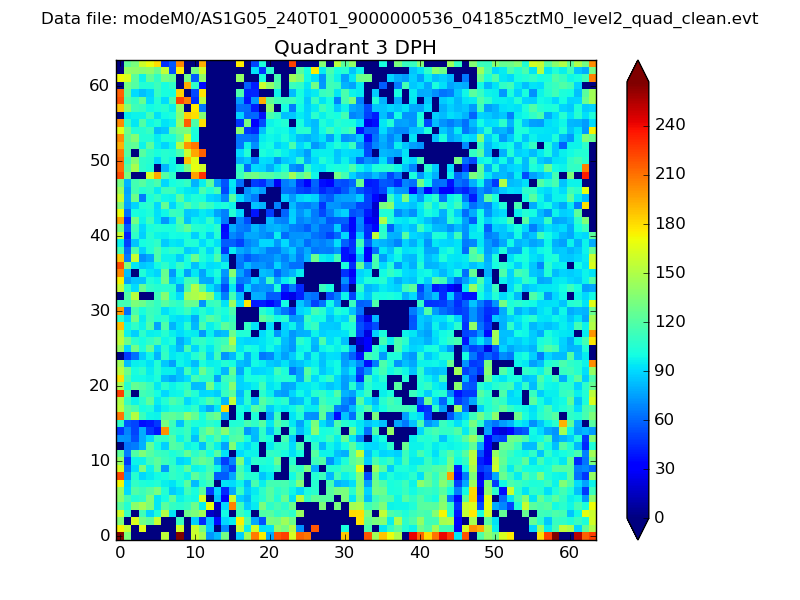 |
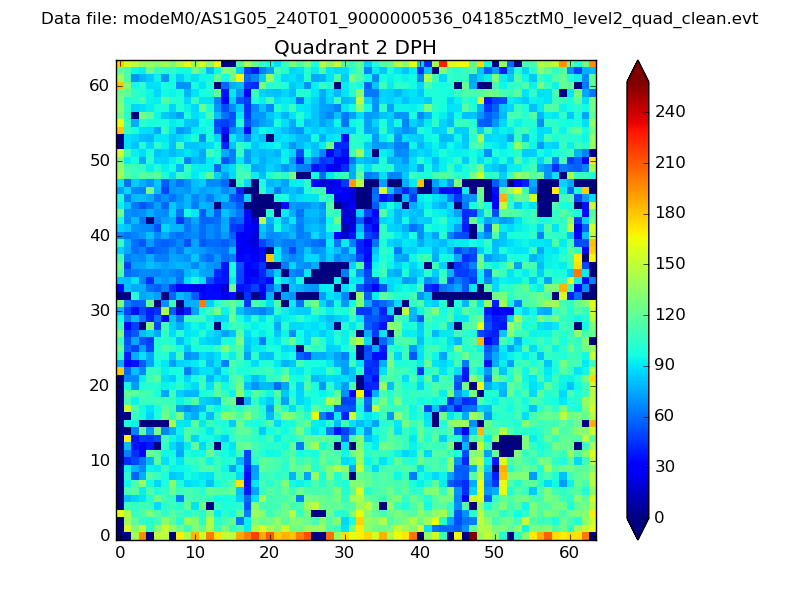 |
Quadrant C |
| Plot type | Count rate plots | Images |
|---|---|---|
| Comparison with Poisson distribution Blue bars denote a histogram of data divided into 1 sec bins. Red curve is a Poisson curve with rate = median count rate of data. |
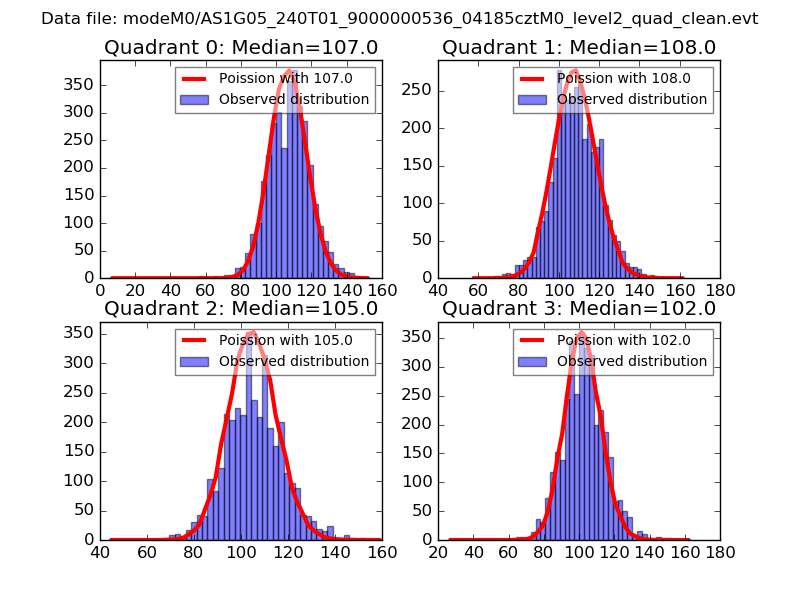 |
 |
| Quadrant-wise count rates Data is divided into 100 sec bins |
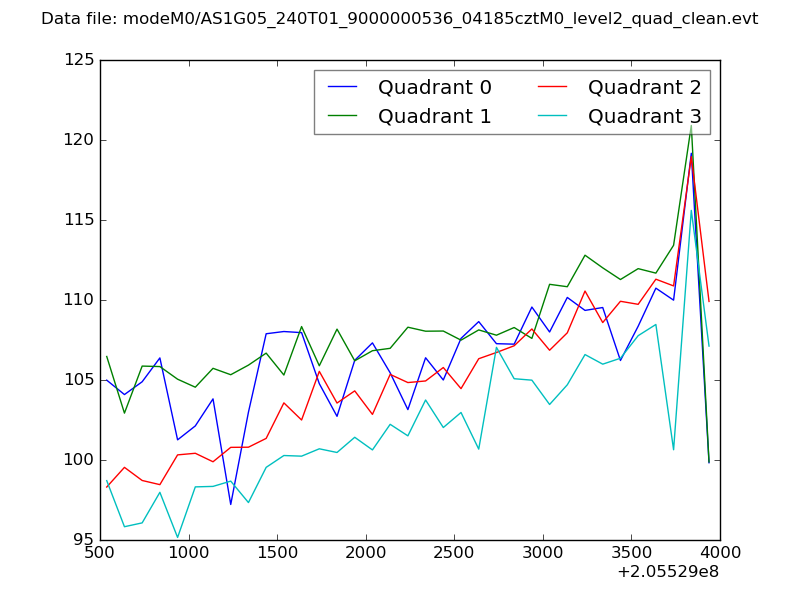 |
|
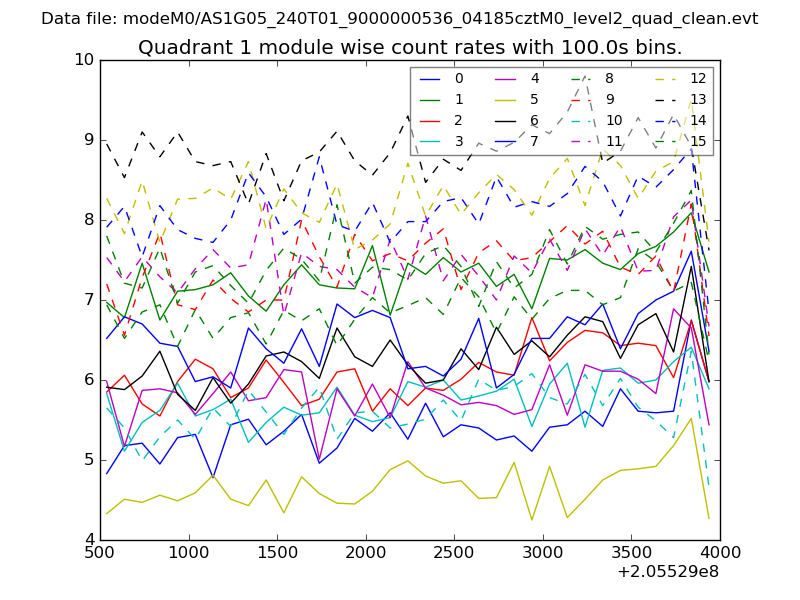
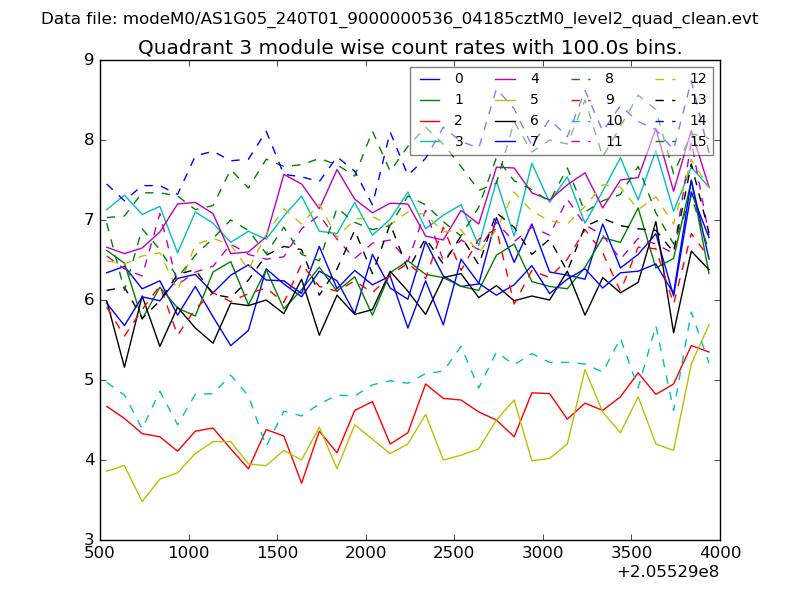
| Module-wise count rates for Quadrant A Data is divided into 100 sec bins |
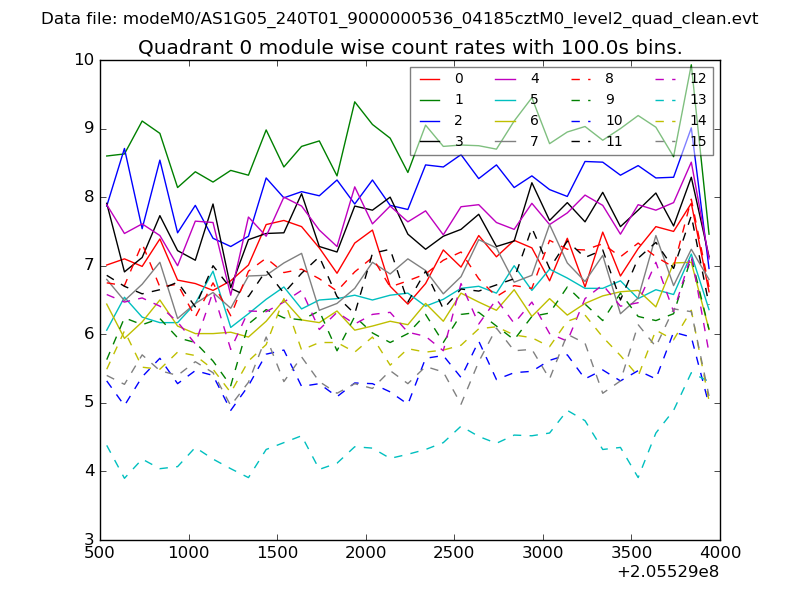 |
 |
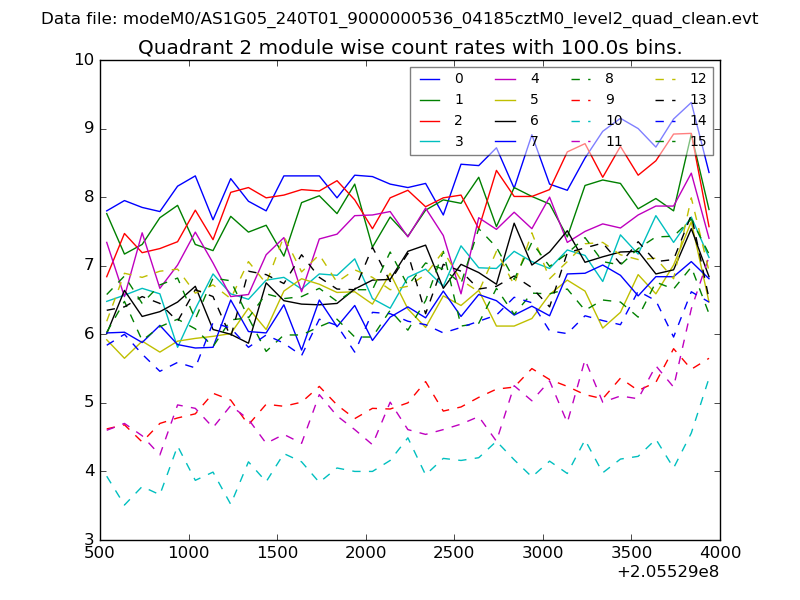
| Module-wise count rates for Quadrant B Data is divided into 100 sec bins |
 |
 |
| Module-wise count rates for Quadrant C Data is divided into 100 sec bins |
 |
 |
| Module-wise count rates for Quadrant D Data is divided into 100 sec bins |
 |
 |
| Parameter | Plot |
|---|---|
| CZT HV Monitor | 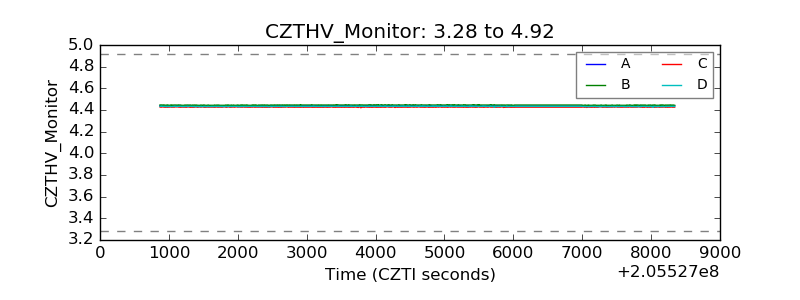 |
| D_VDD | 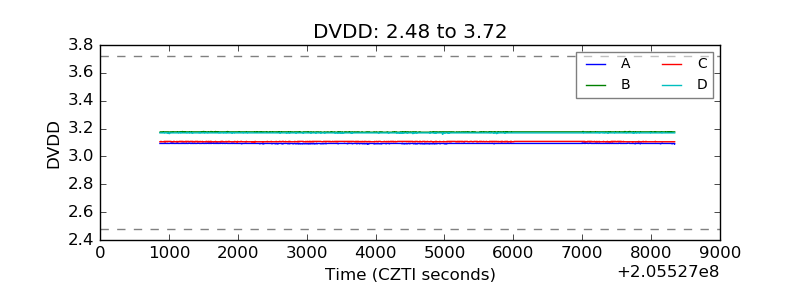 |
| Temperature 1 | 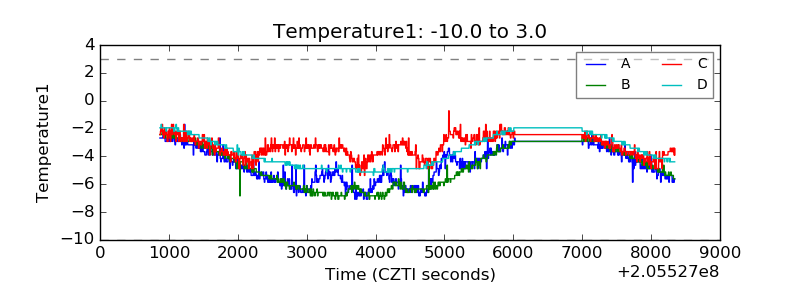 |
| Veto HV Monitor | 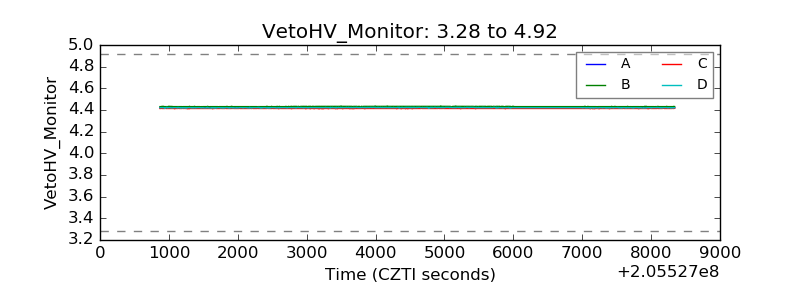 |
| Veto LLD | 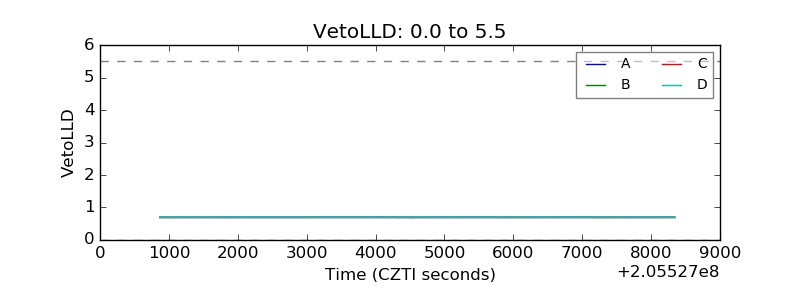 |
| Alpha Counter | 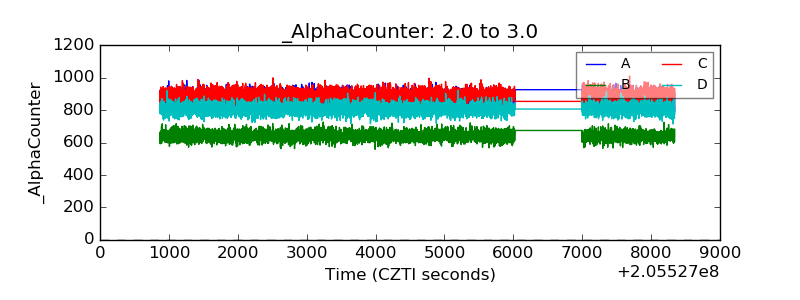 |
| _CPM_Rate | 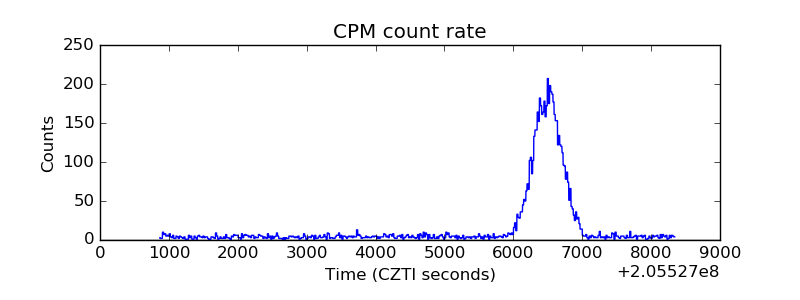 |
| CZT Counter | 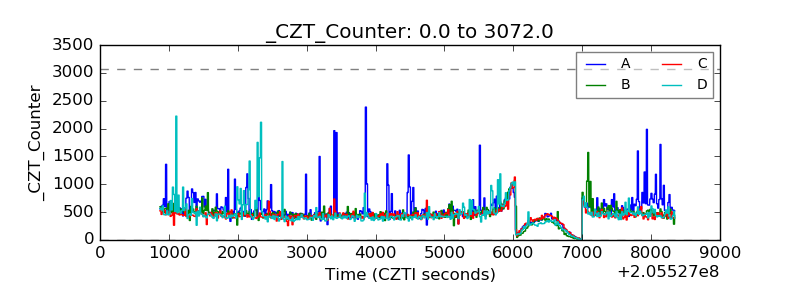 |
| +2.5 Volts monitor | 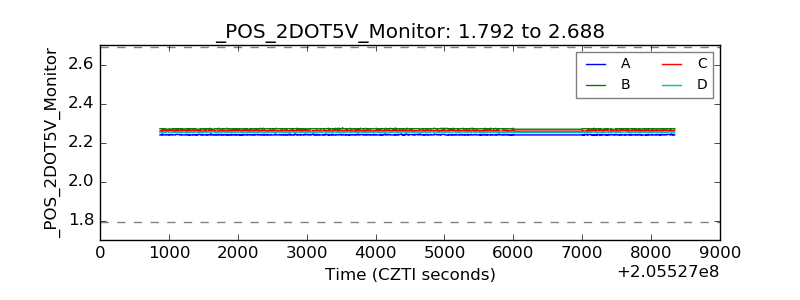 |
| +5 Volts monitor |  |
| _ROLL_ROT | 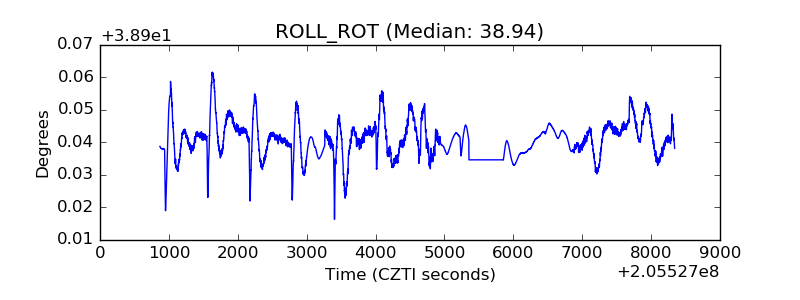 |
| _Roll_DEC | 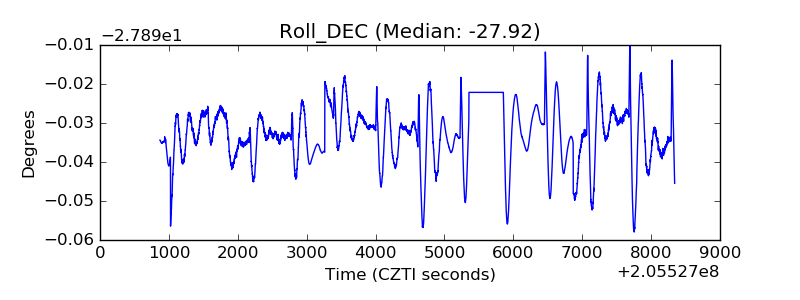 |
| _Roll_RA | 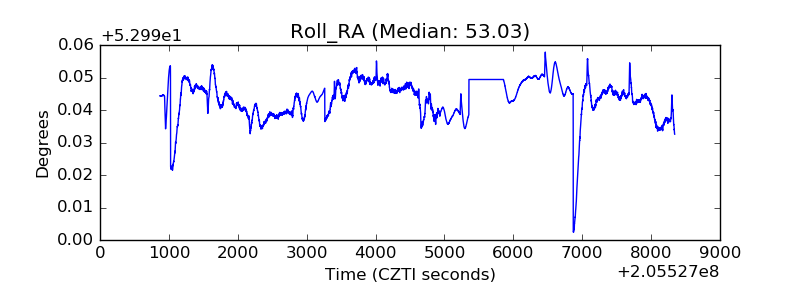 |
| Veto Counter | 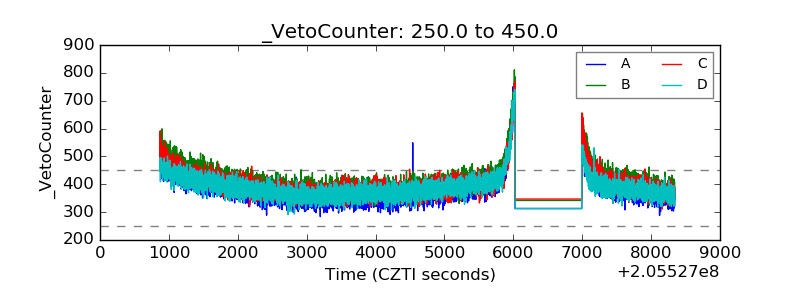 |