| Param | Original file | Final file |
|---|---|---|
| Filename | modeM0/AS1G05_240T01_9000000536_04186cztM0_level2.evt | modeM0/AS1G05_240T01_9000000536_04186cztM0_level2_quad_clean.evt |
| Size (bytes) | 574,444,800 | 71,372,160 |
| Size | 547.8 MB | 68.1 MB |
| Events in quadrant A | 5,942,102 | 413,504 |
| Events in quadrant B | 3,655,462 | 425,855 |
| Events in quadrant C | 3,671,502 | 416,716 |
| Events in quadrant D | 3,642,459 | 406,075 |
| Mode SS | |||
|---|---|---|---|
| Quadrant | BADHDUFLAG | Total packets | Discarded packets |
| A | 0 | 150 | 0 |
| B | 0 | 150 | 0 |
| C | 0 | 150 | 0 |
| D | 0 | 150 | 0 |
| Mode M9 | |||
|---|---|---|---|
| Quadrant | BADHDUFLAG | Total packets | Discarded packets |
| A | 0 | 14 | 0 |
| B | 0 | 14 | 0 |
| C | 0 | 14 | 0 |
| D | 0 | 14 | 0 |
| Mode M0 | |||
|---|---|---|---|
| Quadrant | BADHDUFLAG | Total packets | Discarded packets |
| A | 0 | 22591 | 3 |
| B | 0 | 15446 | 2 |
| C | 0 | 15996 | 2 |
| D | 0 | 15891 | 2 |
| Quadrant | Total seconds | Saturated seconds | Saturation percentage |
|---|---|---|---|
| A | 7153 | 431 | 6.025444% |
| B | 7153 | 177 | 2.474486% |
| C | 7153 | 171 | 2.390605% |
| D | 7153 | 121 | 1.691598% |
Noise dominated data is calculated using 1-second bins in cleaned event files. If a bin has >2000 counts, and if more than 50% of those come from <1% of pixels, then it is considered to be noise-dominated and hence unusable.
| Quadrant | # 1 sec bins | Bins with >0 counts | Bins with >2000 counts | High rate bins dominated by noise | Noise dominated (total time) | Noise dominated (detector-on time) | Marked lightcurve |
|---|---|---|---|---|---|---|---|
| A | 8703 | 7155 | 202 | 202 | 2.32% | 2.82% | 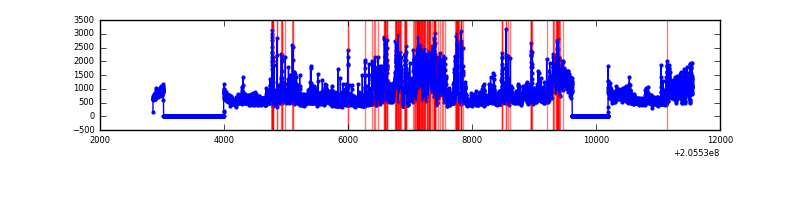 |
| B | 8703 | 7155 | 21 | 21 | 0.24% | 0.29% | 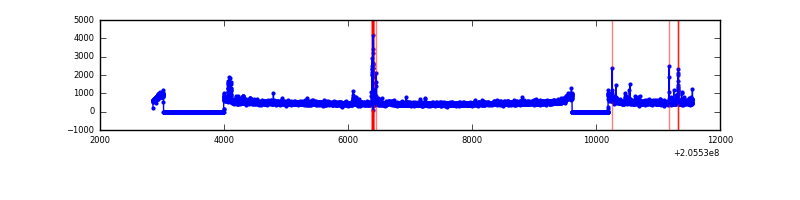 |
| C | 8703 | 7155 | 30 | 30 | 0.34% | 0.42% |  |
| D | 8703 | 7155 | 35 | 35 | 0.40% | 0.49% | 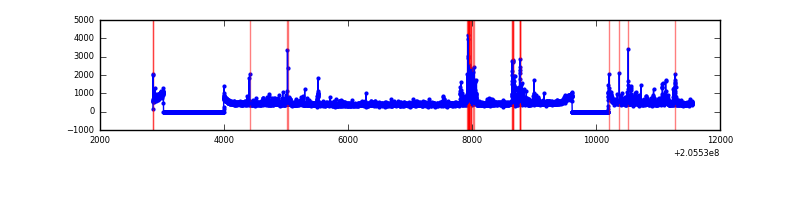 |
Top three noisy pixels from each quadrant. If the there are fewer than three noisy pixels in the level2.evt file, extra rows are filled as -1
| Pixel properties | Quadrant properties | ||||||
|---|---|---|---|---|---|---|---|
| Quadrant | DetID | PixID | Counts | Sigma | Mean | Median | Sigma |
| A | 0 | 199 | 1894747 | 10838.79 | 848 | 828 | 174.7 |
| A | 3 | 1 | 263972 | 1505.96 | 848 | 828 | 174.7 |
| A | 0 | 226 | 182423 | 1039.26 | 848 | 828 | 174.7 |
| B | 3 | 0 | 140658 | 829.35 | 867 | 846 | 168.6 |
| B | 5 | 200 | 44145 | 256.84 | 867 | 846 | 168.6 |
| B | 10 | 16 | 41098 | 238.77 | 867 | 846 | 168.6 |
| C | 9 | 144 | 433443 | 2213.76 | 829 | 832 | 195.4 |
| C | 13 | 61 | 6783 | 30.45 | 829 | 832 | 195.4 |
| C | 12 | 4 | 2188 | 6.94 | 829 | 832 | 195.4 |
| D | 13 | 46 | 119096 | 577.49 | 831 | 806 | 204.8 |
| D | 13 | 239 | 115926 | 562.02 | 831 | 806 | 204.8 |
| D | 9 | 85 | 82052 | 396.64 | 831 | 806 | 204.8 |
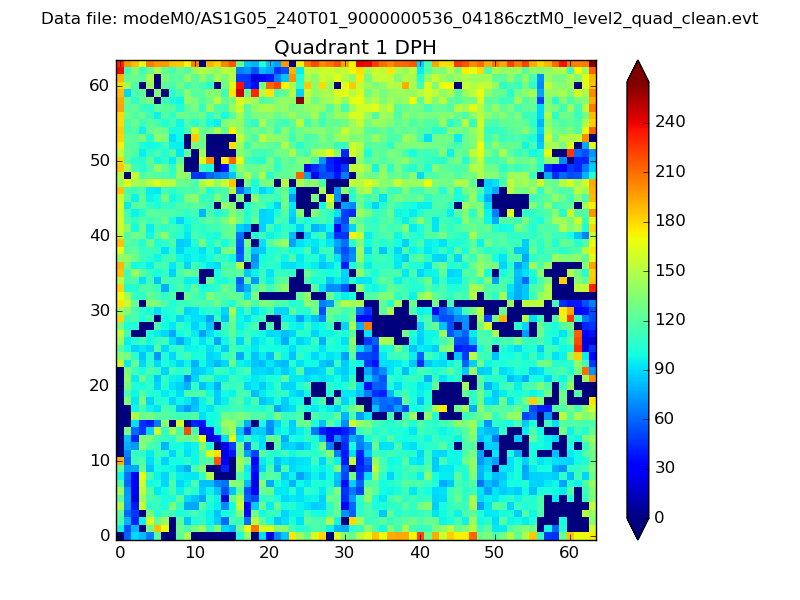
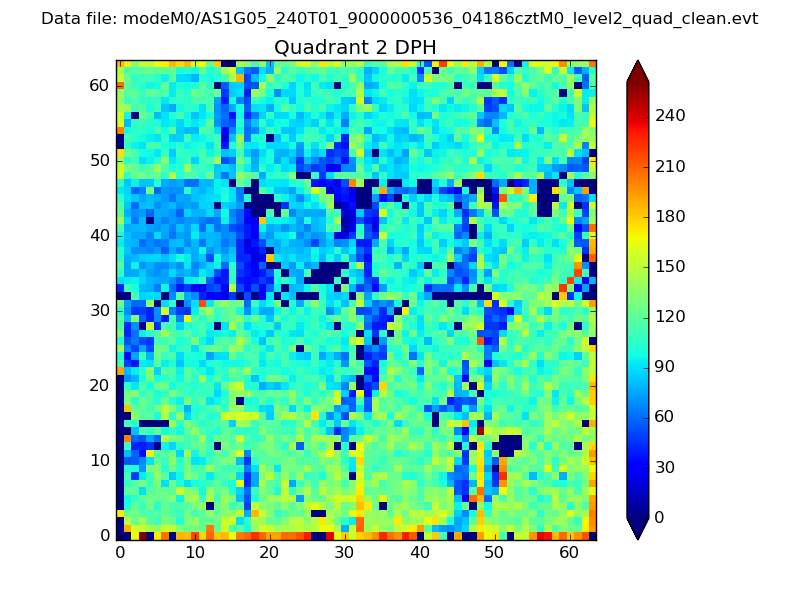
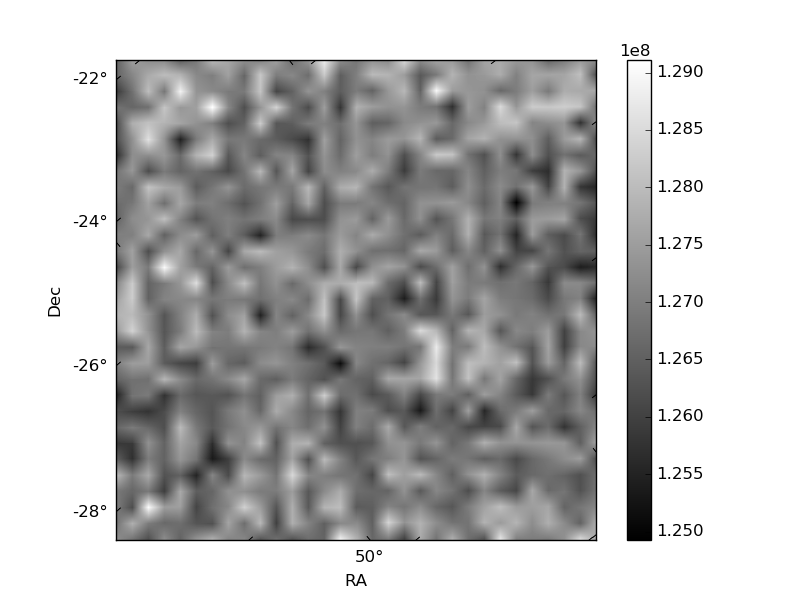
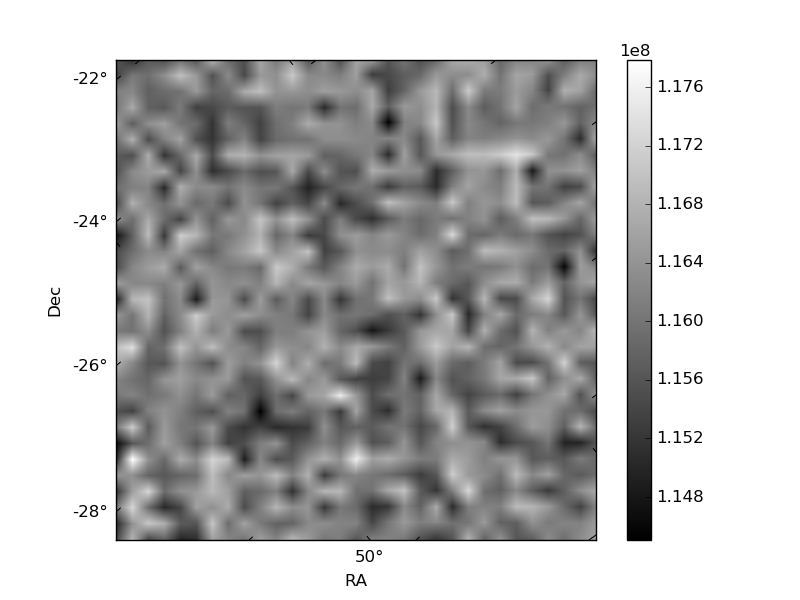
Histogram calculated using DETX and DETY for each event in the final _common_clean file
| Quadrant A | 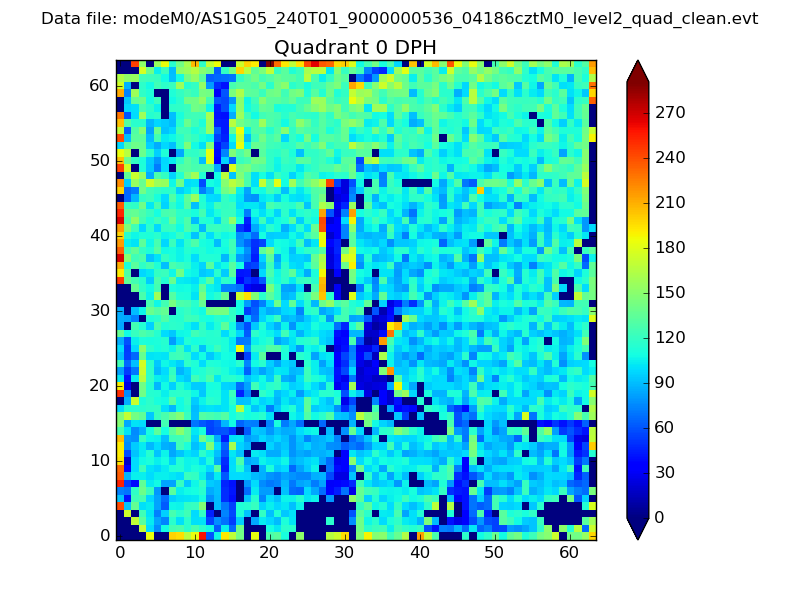 |
 |
Quadrant B |
|---|---|---|---|
| Quadrant D | 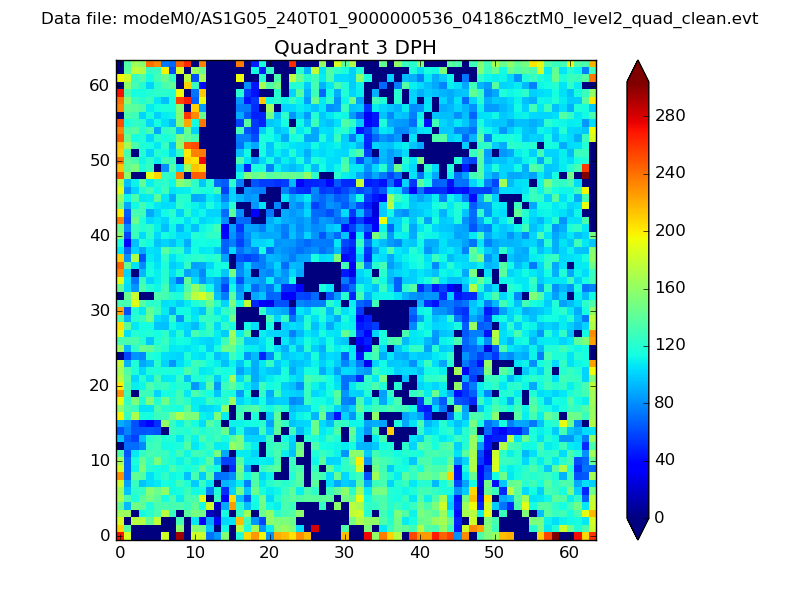 |
 |
Quadrant C |
| Plot type | Count rate plots | Images |
|---|---|---|
| Comparison with Poisson distribution Blue bars denote a histogram of data divided into 1 sec bins. Red curve is a Poisson curve with rate = median count rate of data. |
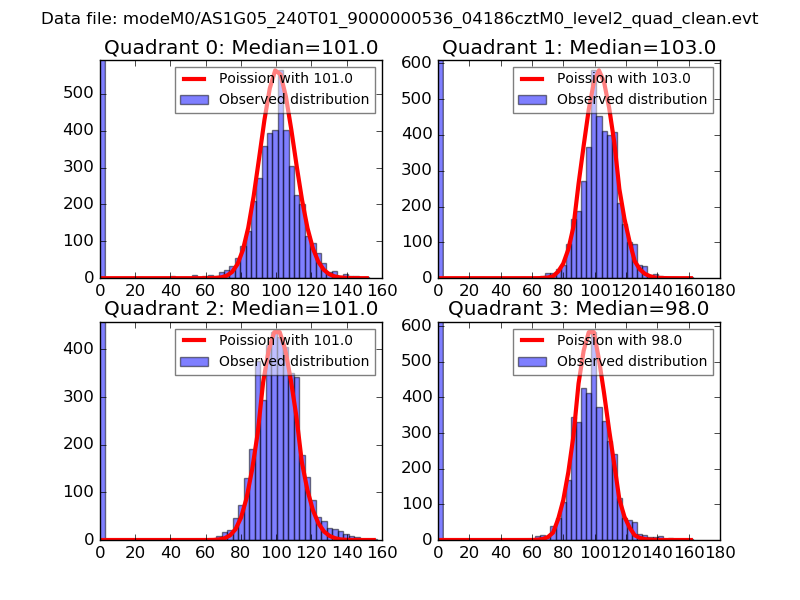 |
 |
| Quadrant-wise count rates Data is divided into 100 sec bins |
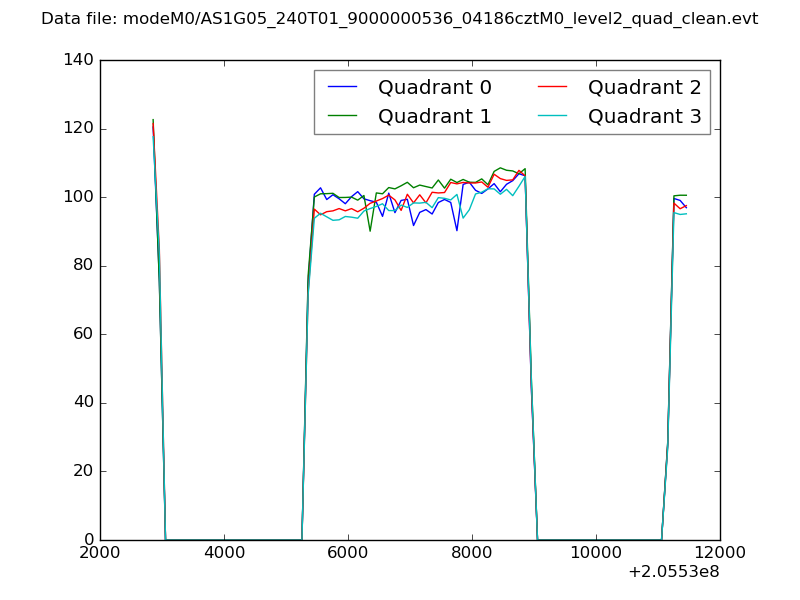 |
|
| Module-wise count rates for Quadrant A Data is divided into 100 sec bins |
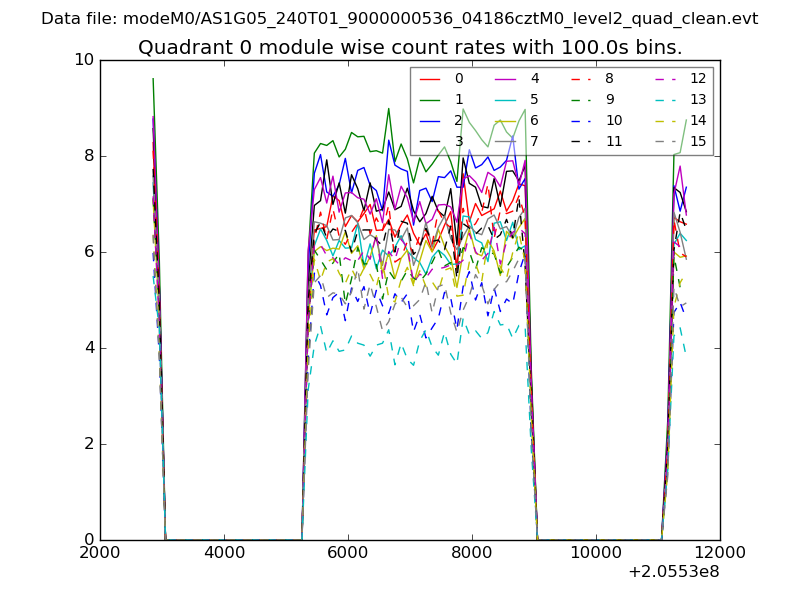 |
 |
| Module-wise count rates for Quadrant B Data is divided into 100 sec bins |
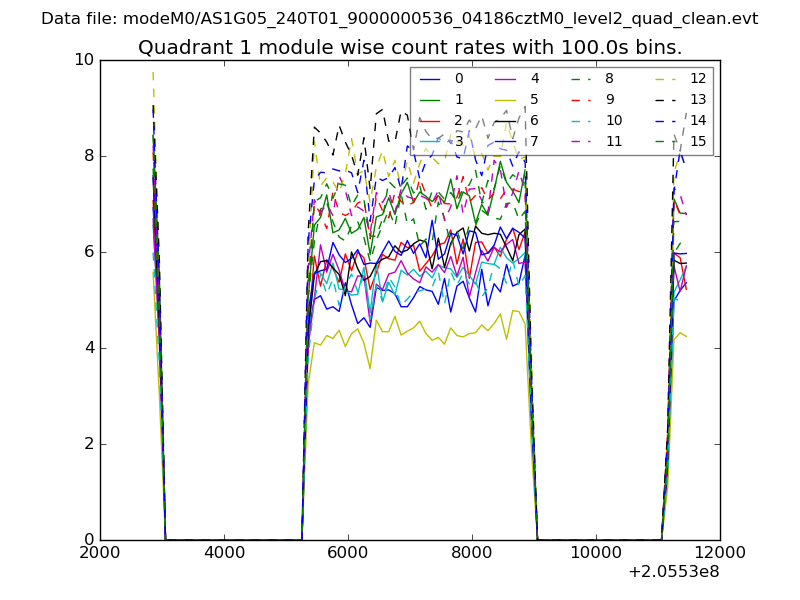 |
 |
| Module-wise count rates for Quadrant C Data is divided into 100 sec bins |
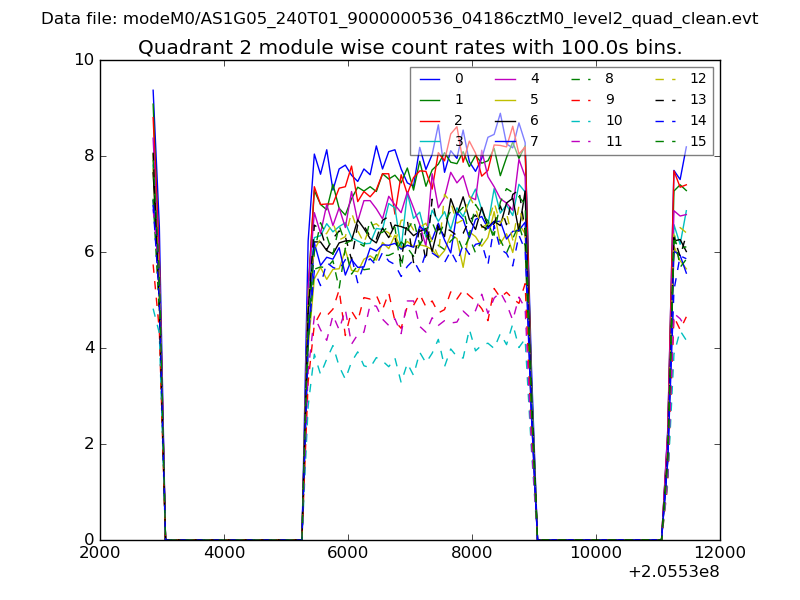 |
 |
| Module-wise count rates for Quadrant D Data is divided into 100 sec bins |
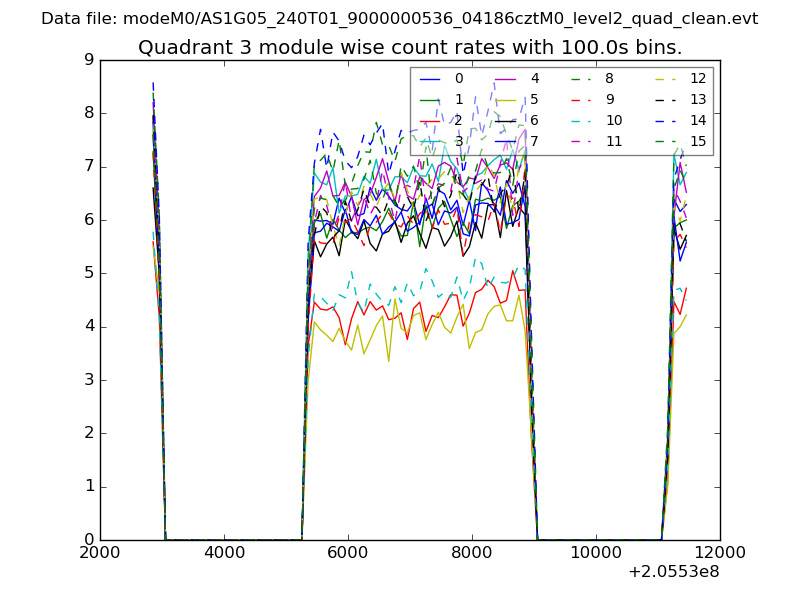 |
 |
| Parameter | Plot |
|---|---|
| CZT HV Monitor | 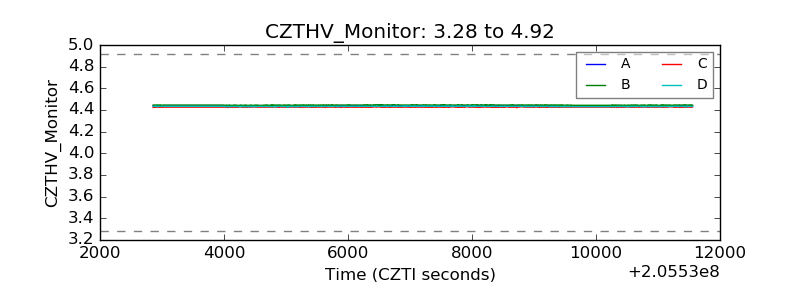 |
| D_VDD | 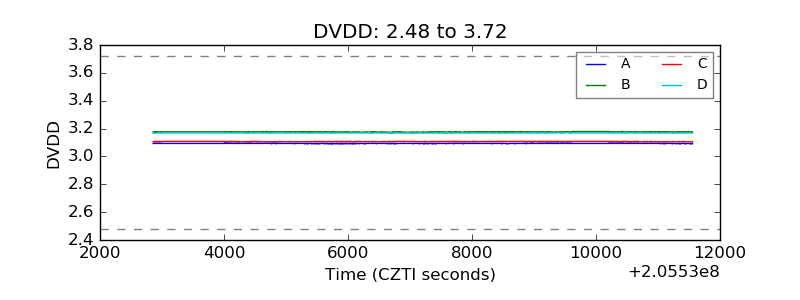 |
| Temperature 1 | 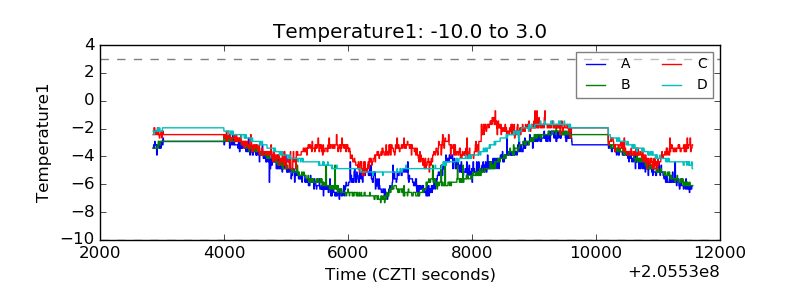 |
| Veto HV Monitor | 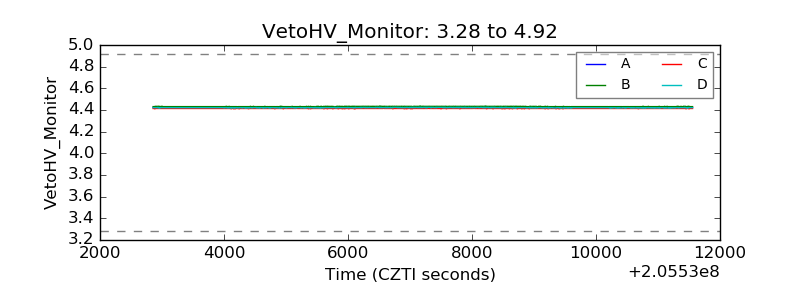 |
| Veto LLD | 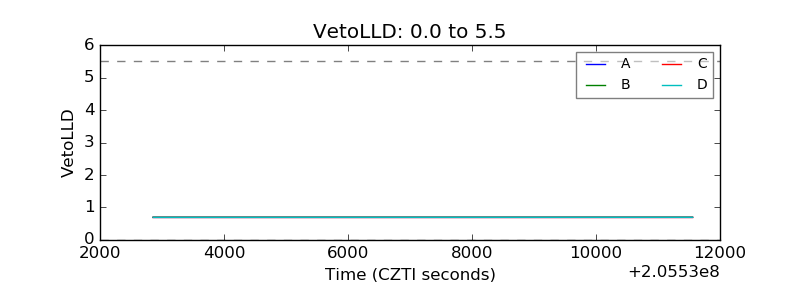 |
| Alpha Counter | 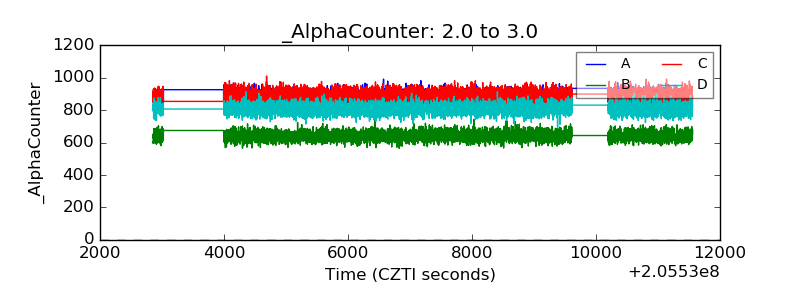 |
| _CPM_Rate | 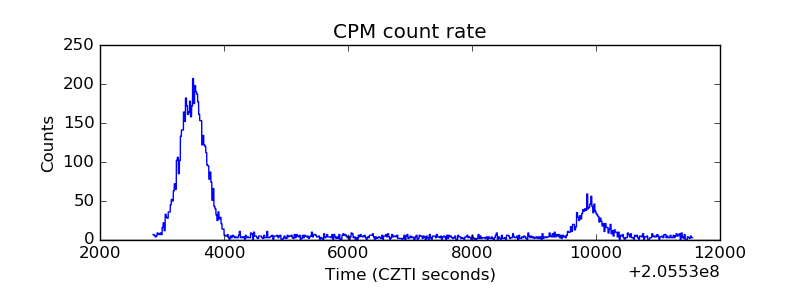 |
| CZT Counter | 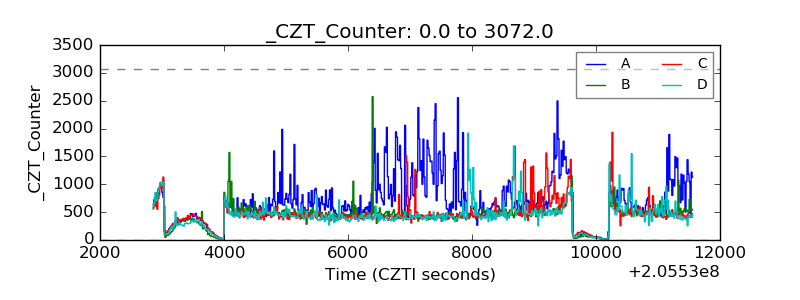 |
| +2.5 Volts monitor |  |
| +5 Volts monitor |  |
| _ROLL_ROT | 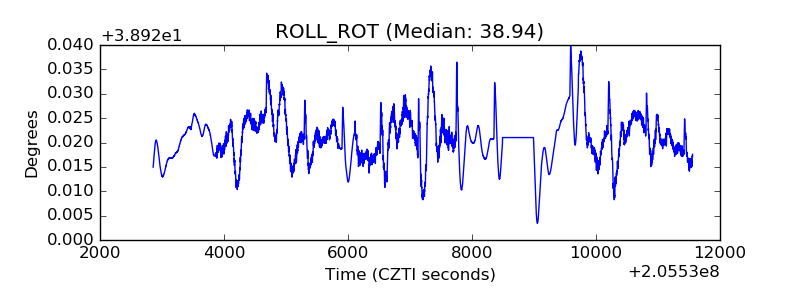 |
| _Roll_DEC | 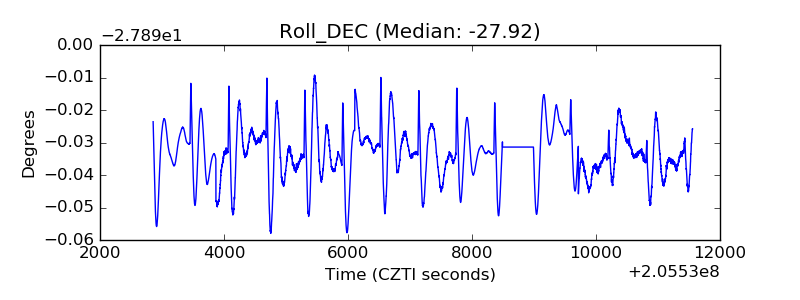 |
| _Roll_RA |  |
| Veto Counter | 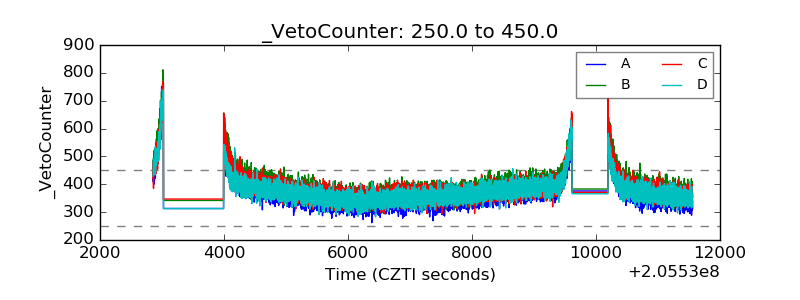 |