| Param | Original file | Final file |
|---|---|---|
| Filename | modeM0/AS1G05_240T01_9000000536_04187cztM0_level2.evt | modeM0/AS1G05_240T01_9000000536_04187cztM0_level2_quad_clean.evt |
| Size (bytes) | 625,559,040 | 77,163,840 |
| Size | 596.6 MB | 73.6 MB |
| Events in quadrant A | 5,239,922 | 448,986 |
| Events in quadrant B | 5,097,440 | 443,547 |
| Events in quadrant C | 3,995,917 | 444,443 |
| Events in quadrant D | 4,057,017 | 430,623 |
| Mode SS | |||
|---|---|---|---|
| Quadrant | BADHDUFLAG | Total packets | Discarded packets |
| A | 0 | 170 | 0 |
| B | 0 | 170 | 0 |
| C | 0 | 170 | 0 |
| D | 0 | 170 | 0 |
| Mode M9 | |||
|---|---|---|---|
| Quadrant | BADHDUFLAG | Total packets | Discarded packets |
| A | 0 | 9 | 0 |
| B | 0 | 9 | 0 |
| C | 0 | 9 | 0 |
| D | 0 | 9 | 0 |
| Mode M0 | |||
|---|---|---|---|
| Quadrant | BADHDUFLAG | Total packets | Discarded packets |
| A | 0 | 21000 | 3 |
| B | 0 | 20498 | 2 |
| C | 0 | 17633 | 2 |
| D | 0 | 17879 | 2 |
| Quadrant | Total seconds | Saturated seconds | Saturation percentage |
|---|---|---|---|
| A | 8189 | 292 | 3.565759% |
| B | 8189 | 449 | 5.482965% |
| C | 8189 | 168 | 2.051533% |
| D | 8189 | 114 | 1.392111% |
Noise dominated data is calculated using 1-second bins in cleaned event files. If a bin has >2000 counts, and if more than 50% of those come from <1% of pixels, then it is considered to be noise-dominated and hence unusable.
| Quadrant | # 1 sec bins | Bins with >0 counts | Bins with >2000 counts | High rate bins dominated by noise | Noise dominated (total time) | Noise dominated (detector-on time) | Marked lightcurve |
|---|---|---|---|---|---|---|---|
| A | 8984 | 8193 | 39 | 39 | 0.43% | 0.48% |  |
| B | 8984 | 8193 | 192 | 192 | 2.14% | 2.34% |  |
| C | 8984 | 8193 | 8 | 8 | 0.09% | 0.10% | 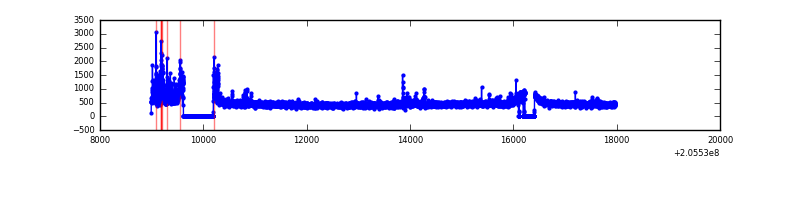 |
| D | 8984 | 8193 | 35 | 35 | 0.39% | 0.43% |  |
Top three noisy pixels from each quadrant. If the there are fewer than three noisy pixels in the level2.evt file, extra rows are filled as -1
| Pixel properties | Quadrant properties | ||||||
|---|---|---|---|---|---|---|---|
| Quadrant | DetID | PixID | Counts | Sigma | Mean | Median | Sigma |
| A | 0 | 199 | 1052591 | 5271.92 | 968 | 945 | 199.5 |
| A | 3 | 1 | 137752 | 685.82 | 968 | 945 | 199.5 |
| A | 0 | 50 | 114033 | 566.91 | 968 | 945 | 199.5 |
| B | 10 | 16 | 969729 | 5190.49 | 970 | 948 | 186.6 |
| B | 3 | 0 | 283275 | 1512.64 | 970 | 948 | 186.6 |
| B | 0 | 183 | 30306 | 157.29 | 970 | 948 | 186.6 |
| C | 9 | 144 | 302594 | 1370.4 | 944 | 948 | 220.1 |
| C | 13 | 61 | 7830 | 31.27 | 944 | 948 | 220.1 |
| C | 7 | 247 | 3192 | 10.19 | 944 | 948 | 220.1 |
| D | 13 | 239 | 135940 | 585.69 | 944 | 914 | 230.5 |
| D | 13 | 46 | 99077 | 425.79 | 944 | 914 | 230.5 |
| D | 10 | 172 | 78581 | 336.89 | 944 | 914 | 230.5 |
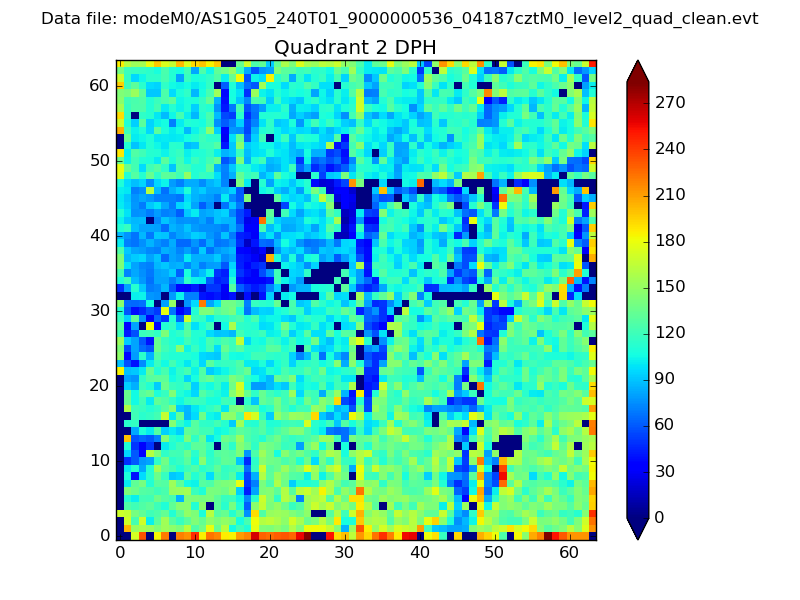
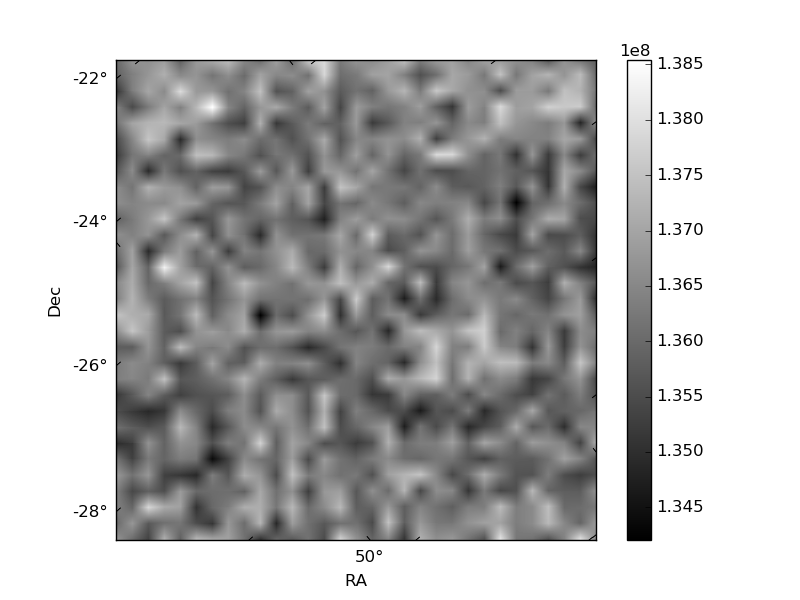
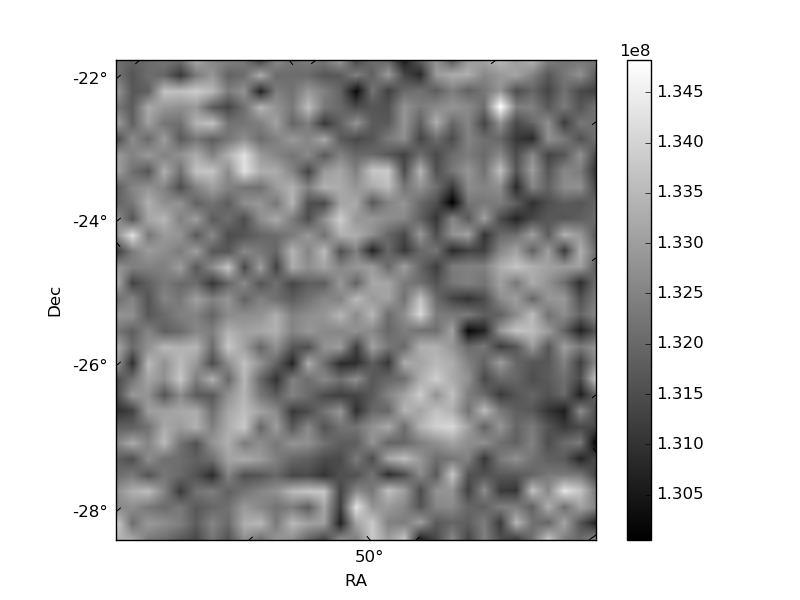
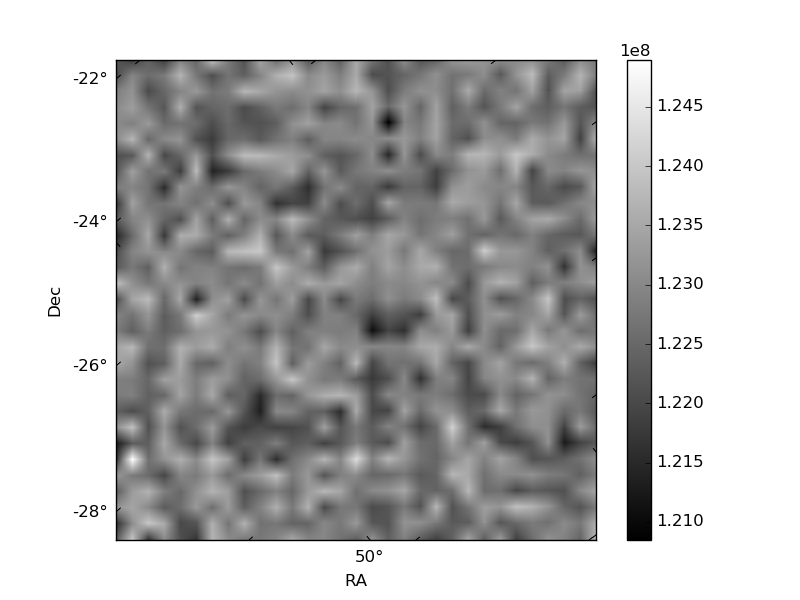
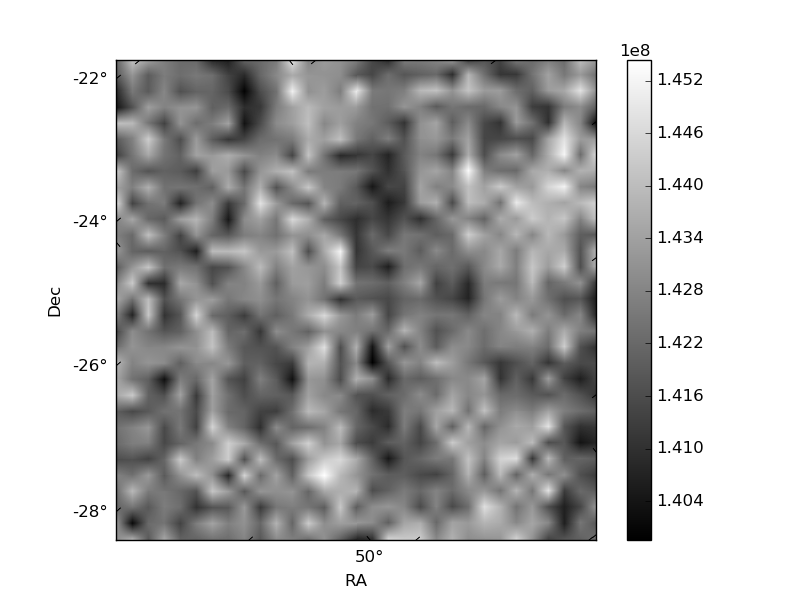
Histogram calculated using DETX and DETY for each event in the final _common_clean file
| Quadrant A | 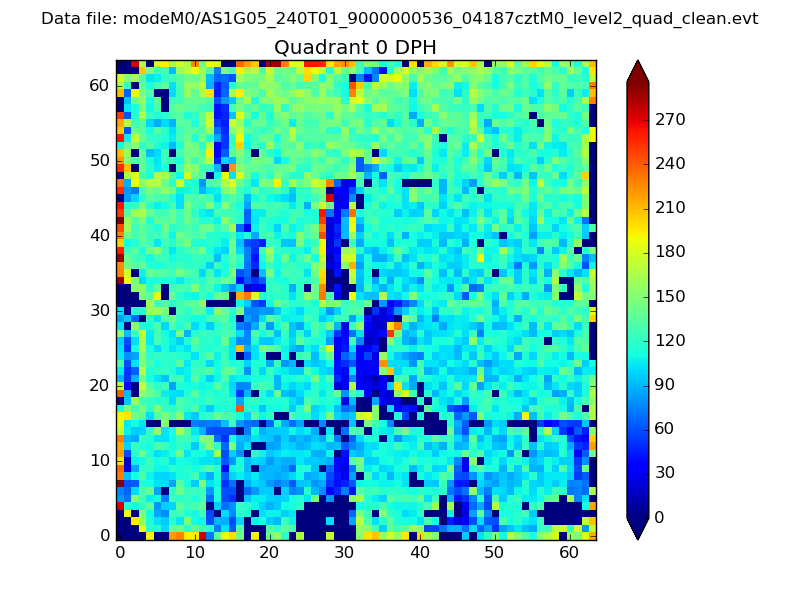 |
 |
Quadrant B |
|---|---|---|---|
| Quadrant D | 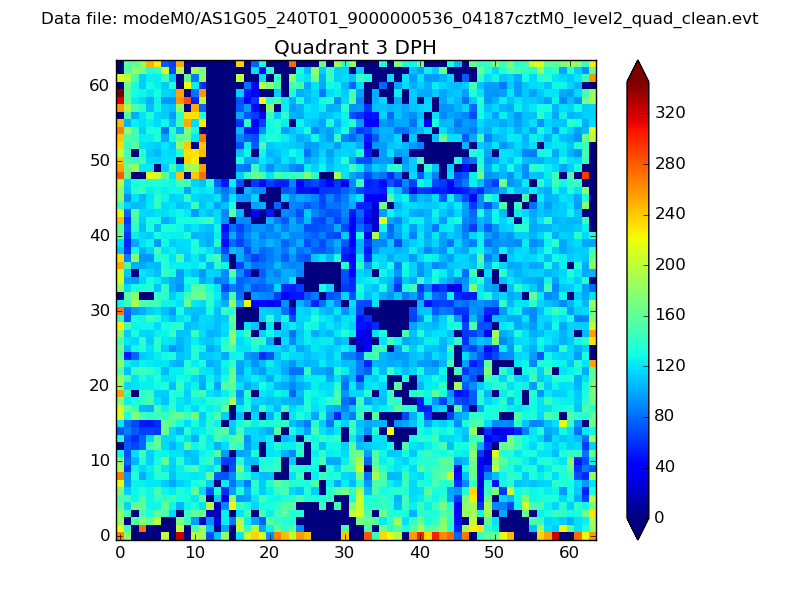 |
 |
Quadrant C |
| Plot type | Count rate plots | Images |
|---|---|---|
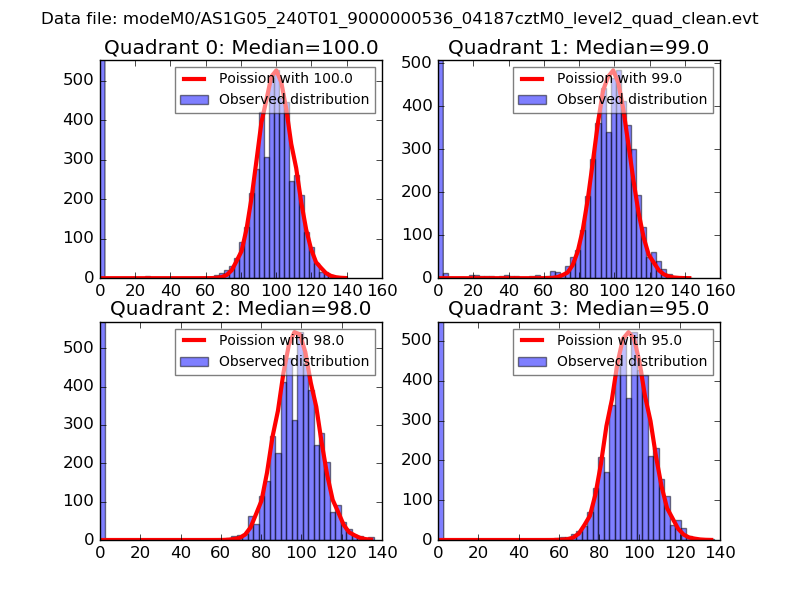
| Comparison with Poisson distribution Blue bars denote a histogram of data divided into 1 sec bins. Red curve is a Poisson curve with rate = median count rate of data. |
 |
 |
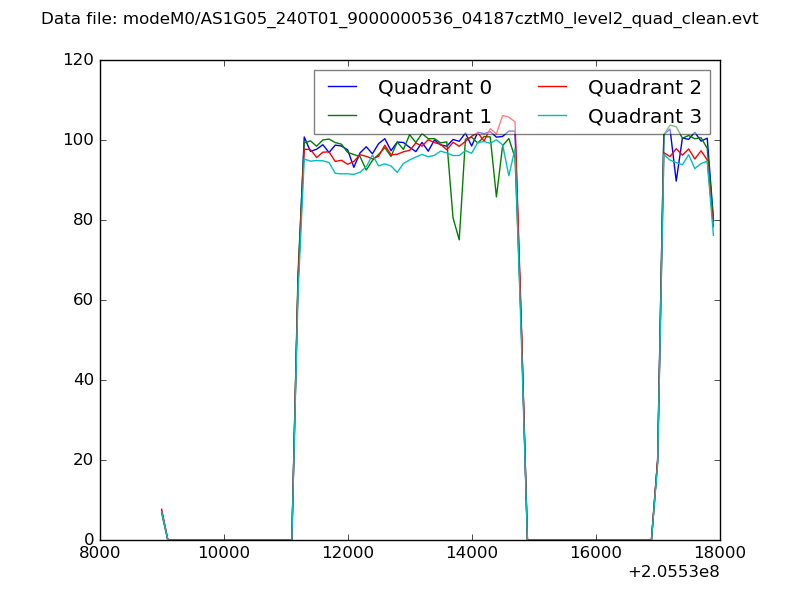
| Quadrant-wise count rates Data is divided into 100 sec bins |
 |
|
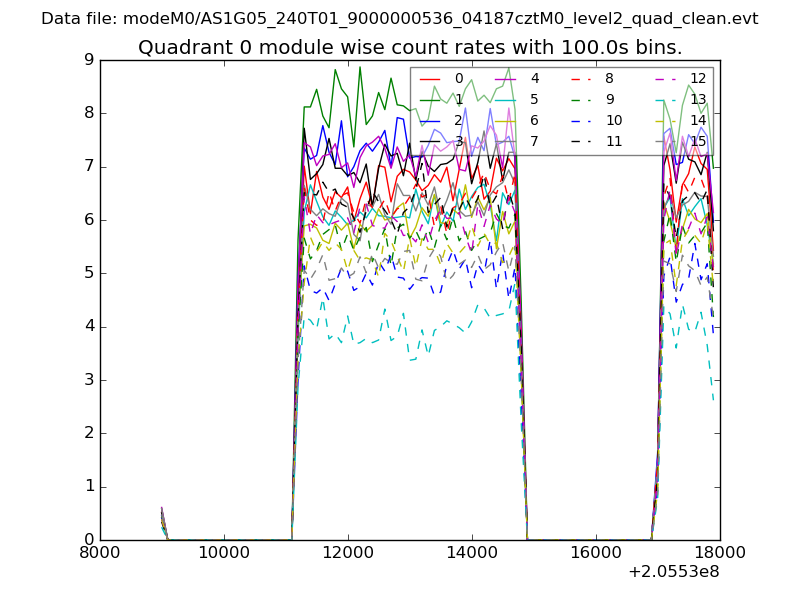
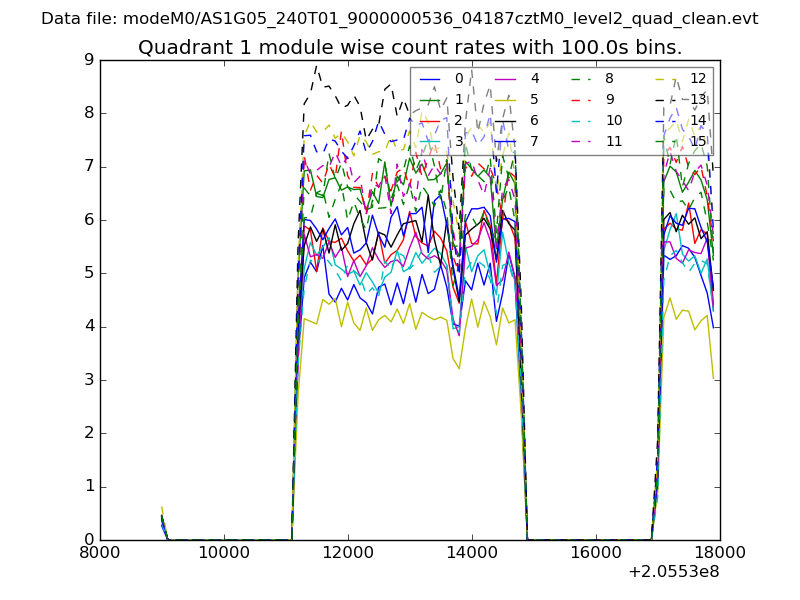
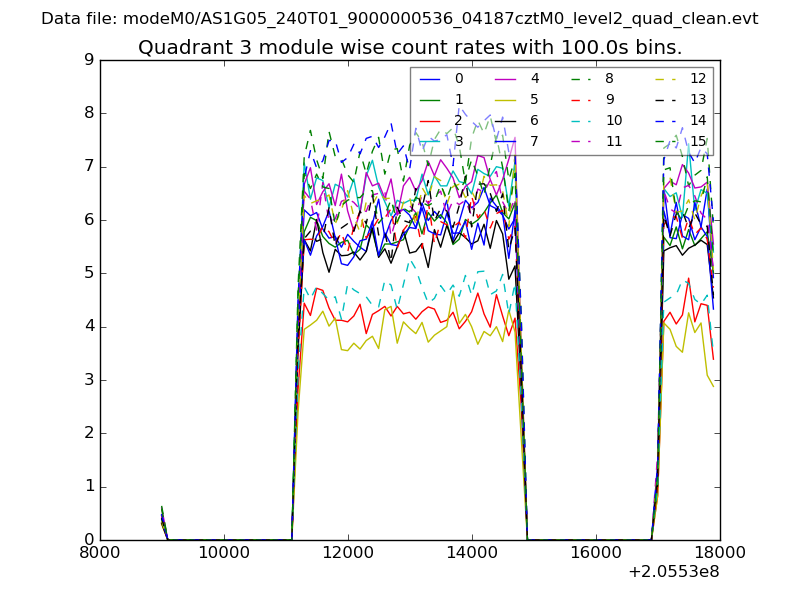
| Module-wise count rates for Quadrant A Data is divided into 100 sec bins |
 |
 |
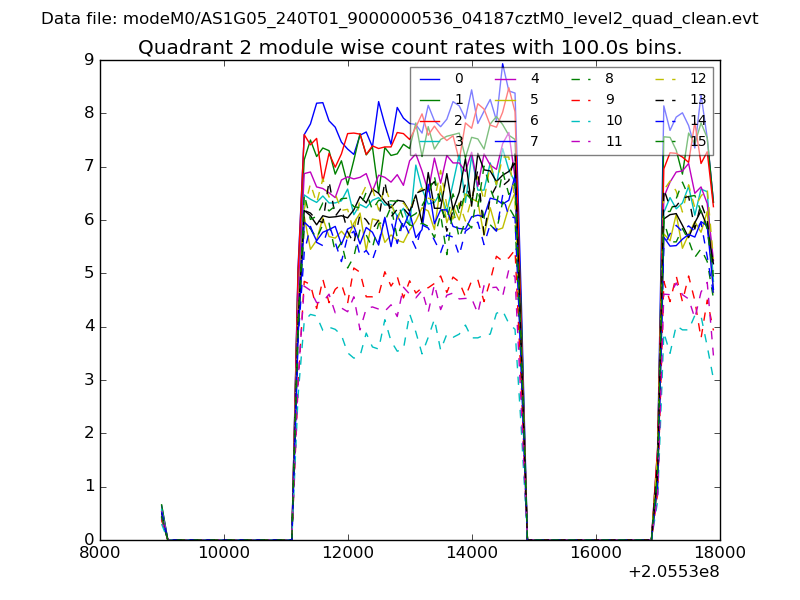
| Module-wise count rates for Quadrant B Data is divided into 100 sec bins |
 |
 |
| Module-wise count rates for Quadrant C Data is divided into 100 sec bins |
 |
 |
| Module-wise count rates for Quadrant D Data is divided into 100 sec bins |
 |
 |
| Parameter | Plot |
|---|---|
| CZT HV Monitor | 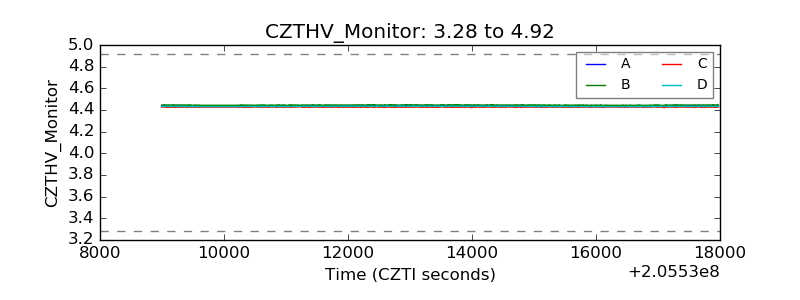 |
| D_VDD | 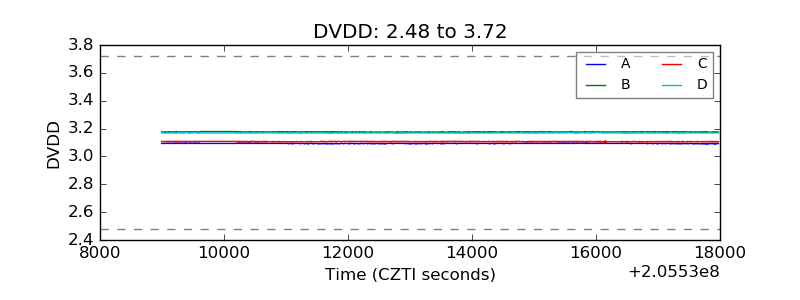 |
| Temperature 1 | 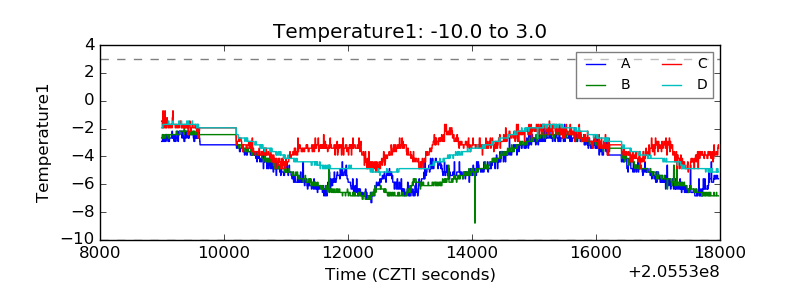 |
| Veto HV Monitor | 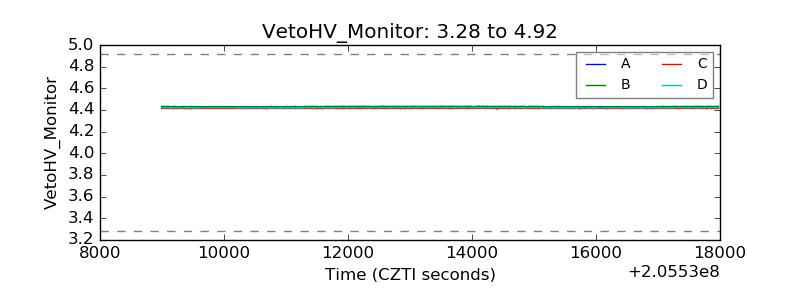 |
| Veto LLD | 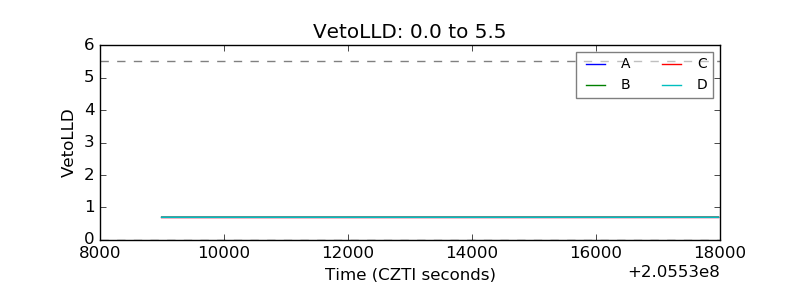 |
| Alpha Counter | 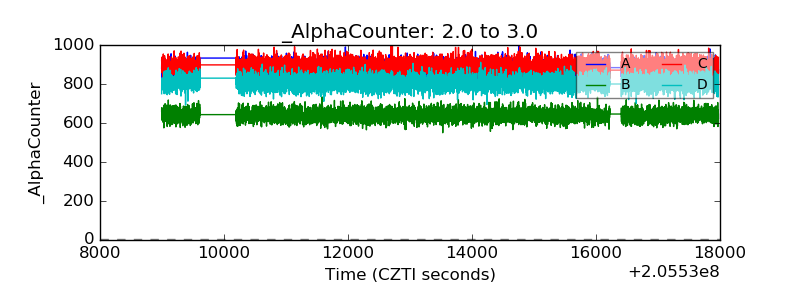 |
| _CPM_Rate | 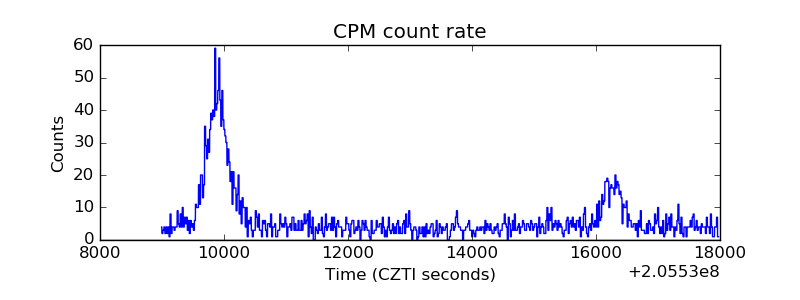 |
| CZT Counter | 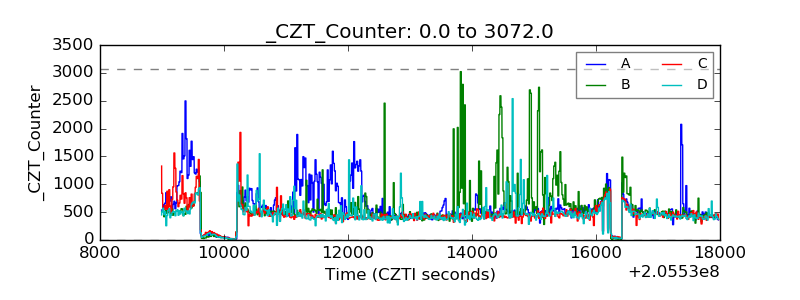 |
| +2.5 Volts monitor | 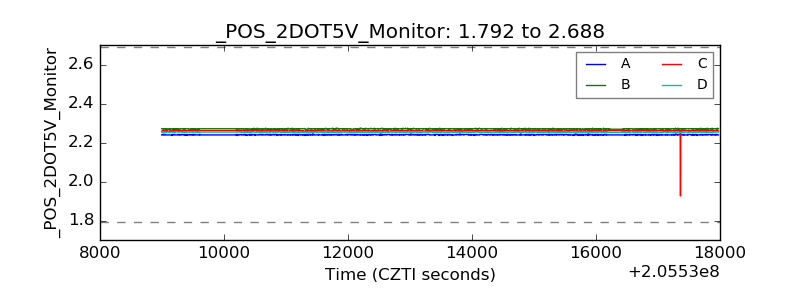 |
| +5 Volts monitor |  |
| _ROLL_ROT | 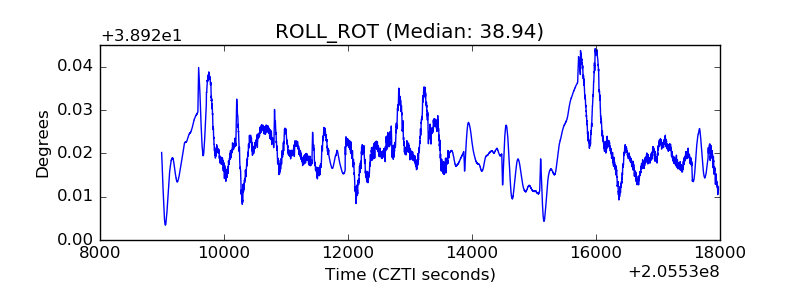 |
| _Roll_DEC | 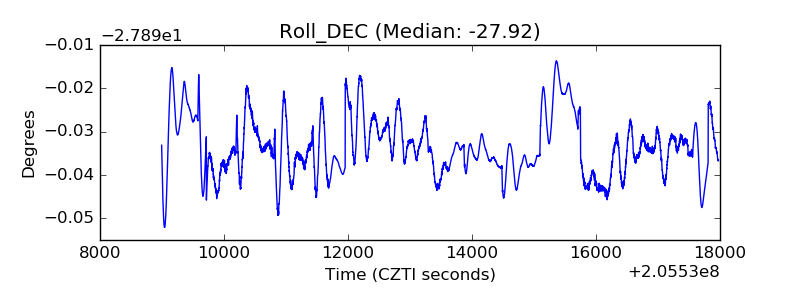 |
| _Roll_RA | 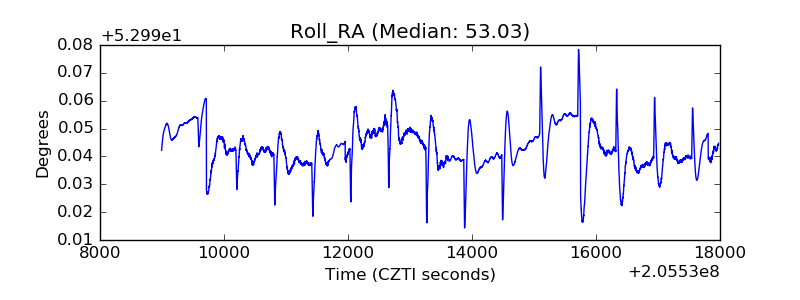 |
| Veto Counter | 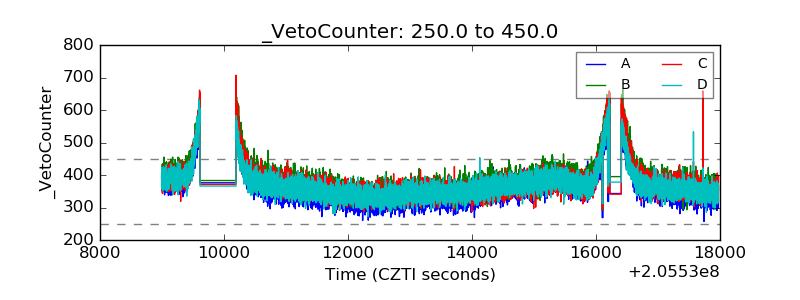 |