| Param | Original file | Final file |
|---|---|---|
| Filename | modeM0/AS1G05_240T01_9000000536_04191cztM0_level2.evt | modeM0/AS1G05_240T01_9000000536_04191cztM0_level2_quad_clean.evt |
| Size (bytes) | 1,746,809,280 | 193,072,320 |
| Size | 1.6 GB | 184.1 MB |
| Events in quadrant A | 9,975,859 | 1,172,174 |
| Events in quadrant B | 22,407,774 | 1,077,943 |
| Events in quadrant C | 8,845,908 | 1,176,088 |
| Events in quadrant D | 10,411,764 | 1,131,627 |
| Mode SS | |||
|---|---|---|---|
| Quadrant | BADHDUFLAG | Total packets | Discarded packets |
| A | 0 | 382 | 0 |
| B | 0 | 382 | 0 |
| C | 0 | 382 | 6 |
| D | 0 | 382 | 0 |
| Mode M9 | |||
|---|---|---|---|
| Quadrant | BADHDUFLAG | Total packets | Discarded packets |
| A | 0 | 18 | 0 |
| B | 0 | 18 | 0 |
| C | 0 | 18 | 0 |
| D | 0 | 18 | 0 |
| Mode M0 | |||
|---|---|---|---|
| Quadrant | BADHDUFLAG | Total packets | Discarded packets |
| A | 0 | 42665 | 167 |
| B | 0 | 79919 | 751 |
| C | 0 | 39535 | 70 |
| D | 0 | 44974 | 248 |
| Quadrant | Total seconds | Saturated seconds | Saturation percentage |
|---|---|---|---|
| A | 18711 | 547 | 2.923414% |
| B | 18646 | 5381 | 28.858736% |
| C | 18735 | 235 | 1.254337% |
| D | 18699 | 758 | 4.053693% |
Noise dominated data is calculated using 1-second bins in cleaned event files. If a bin has >2000 counts, and if more than 50% of those come from <1% of pixels, then it is considered to be noise-dominated and hence unusable.
| Quadrant | # 1 sec bins | Bins with >0 counts | Bins with >2000 counts | High rate bins dominated by noise | Noise dominated (total time) | Noise dominated (detector-on time) | Marked lightcurve |
|---|---|---|---|---|---|---|---|
| A | 20493 | 18769 | 215 | 215 | 1.05% | 1.15% | 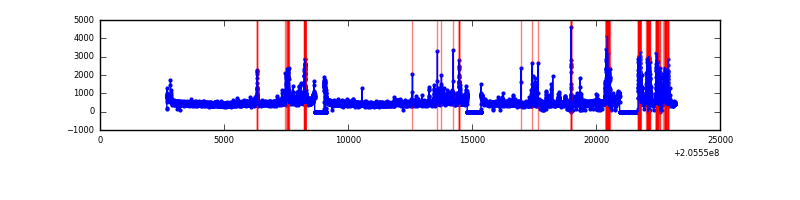 |
| B | 20493 | 18751 | 4282 | 4282 | 20.89% | 22.84% | 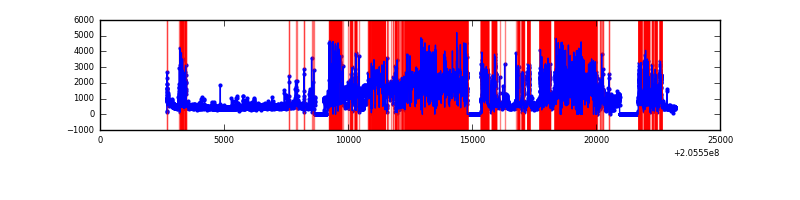 |
| C | 20493 | 18770 | 23 | 23 | 0.11% | 0.12% | 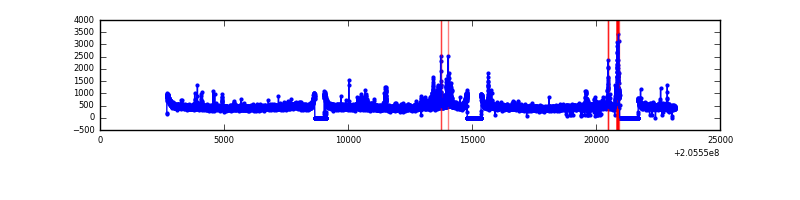 |
| D | 20493 | 18771 | 485 | 485 | 2.37% | 2.58% | 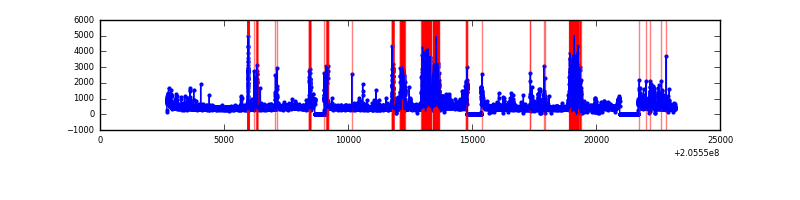 |
Top three noisy pixels from each quadrant. If the there are fewer than three noisy pixels in the level2.evt file, extra rows are filled as -1
| Pixel properties | Quadrant properties | ||||||
|---|---|---|---|---|---|---|---|
| Quadrant | DetID | PixID | Counts | Sigma | Mean | Median | Sigma |
| A | 0 | 50 | 1197445 | 2703.25 | 2159 | 2110 | 442.2 |
| A | 3 | 1 | 133095 | 296.22 | 2159 | 2110 | 442.2 |
| A | 15 | 234 | 123368 | 274.22 | 2159 | 2110 | 442.2 |
| B | 3 | 0 | 14786877 | 39929.1 | 1928 | 1878 | 370.3 |
| B | 10 | 16 | 48849 | 126.85 | 1928 | 1878 | 370.3 |
| B | 15 | 204 | 44204 | 114.31 | 1928 | 1878 | 370.3 |
| C | 9 | 144 | 467236 | 943.39 | 2121 | 2133 | 493.0 |
| C | 8 | 128 | 20914 | 38.09 | 2121 | 2133 | 493.0 |
| C | 1 | 16 | 19879 | 36.0 | 2121 | 2133 | 493.0 |
| D | 13 | 239 | 1372513 | 2726.29 | 2085 | 2022 | 502.7 |
| D | 4 | 95 | 262846 | 518.85 | 2085 | 2022 | 502.7 |
| D | 10 | 172 | 215840 | 425.34 | 2085 | 2022 | 502.7 |
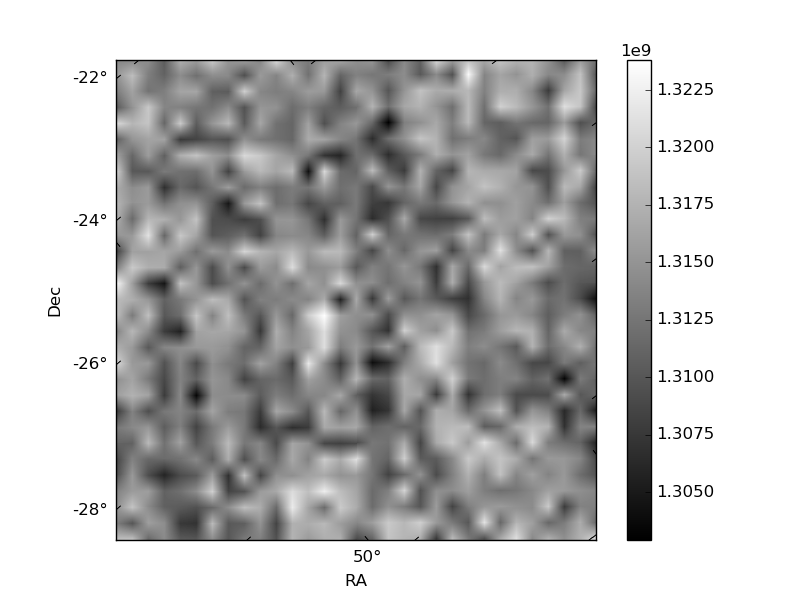
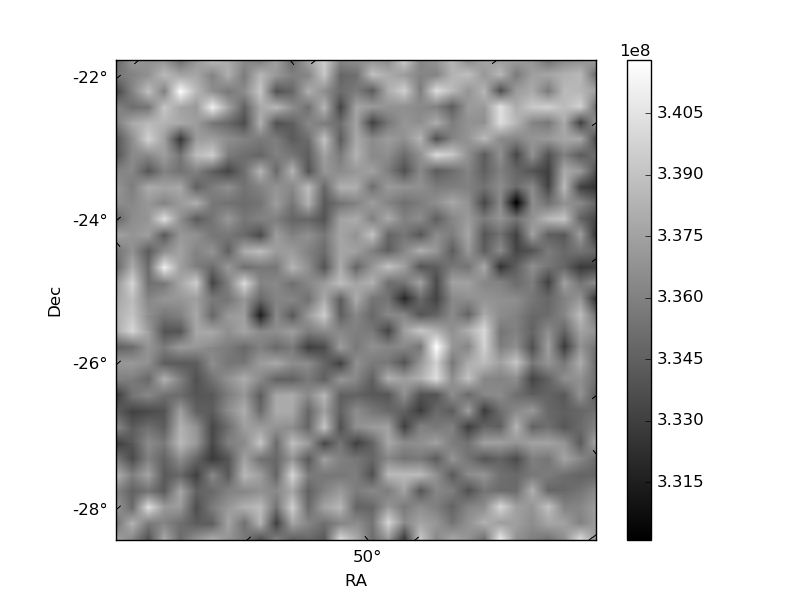
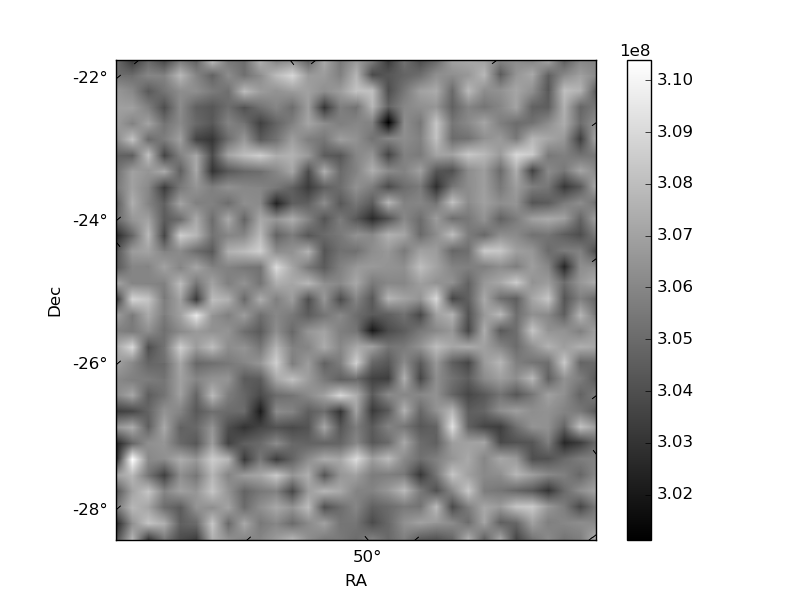
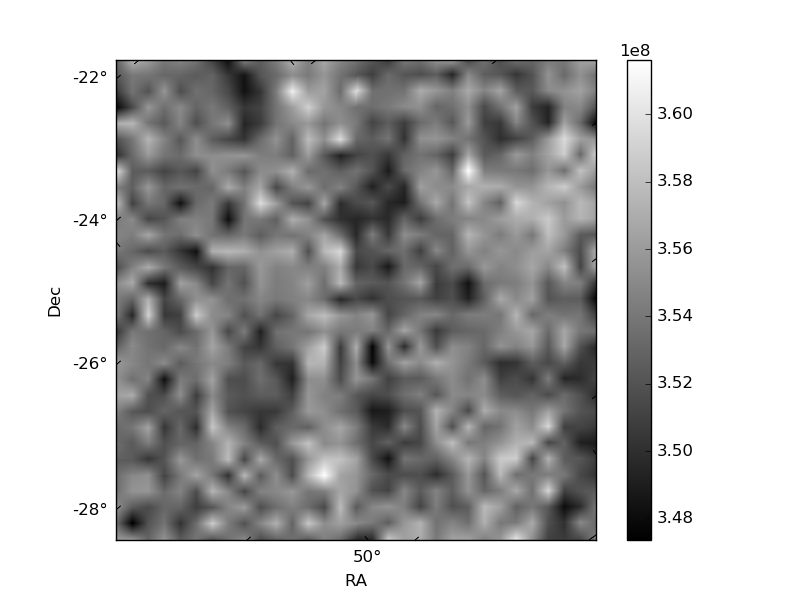
Histogram calculated using DETX and DETY for each event in the final _common_clean file
| Quadrant A | 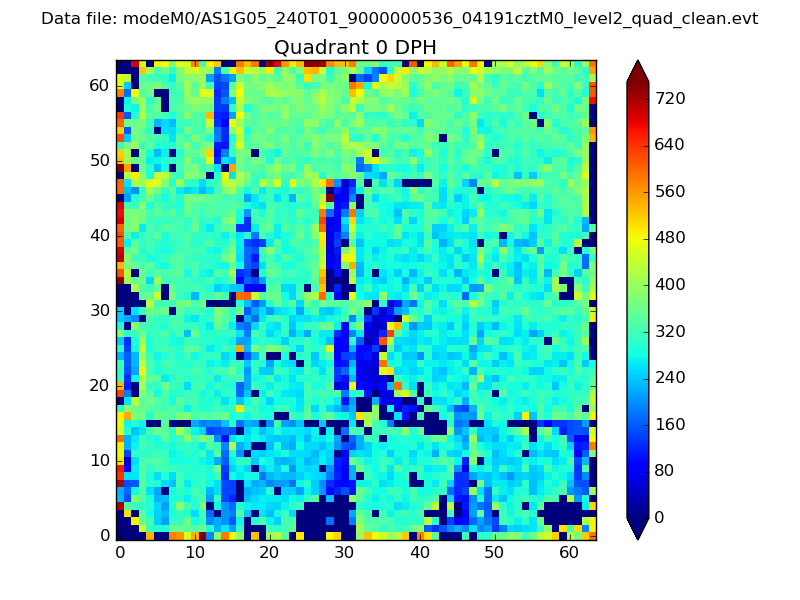 |
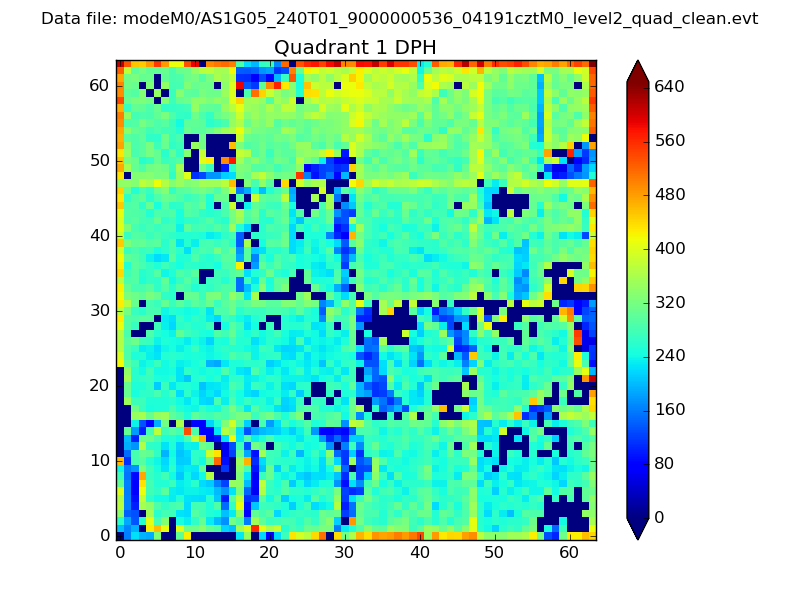 |
Quadrant B |
|---|---|---|---|
| Quadrant D | 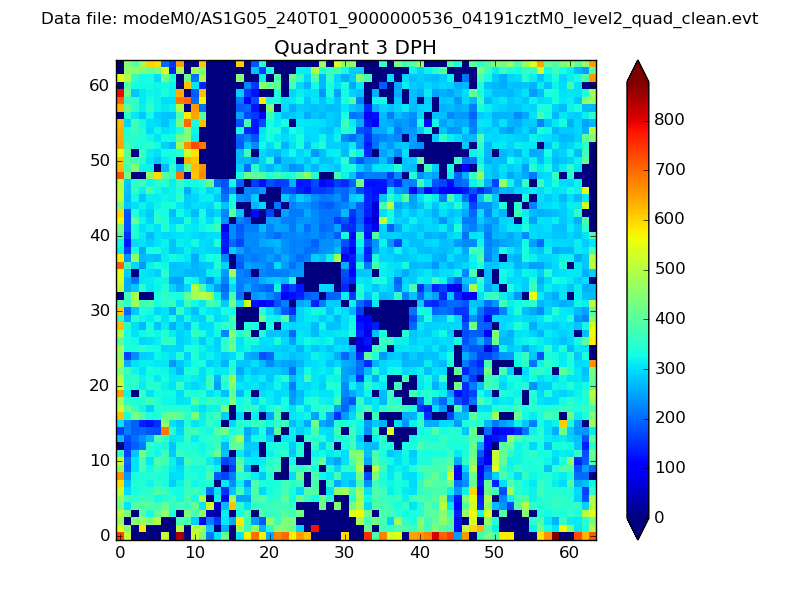 |
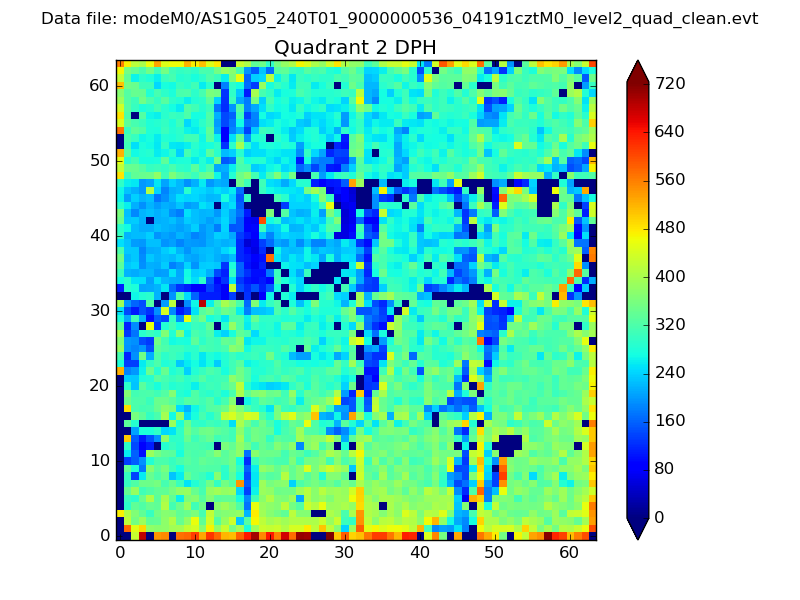 |
Quadrant C |
| Plot type | Count rate plots | Images |
|---|---|---|
| Comparison with Poisson distribution Blue bars denote a histogram of data divided into 1 sec bins. Red curve is a Poisson curve with rate = median count rate of data. |
 |
 |
| Quadrant-wise count rates Data is divided into 100 sec bins |
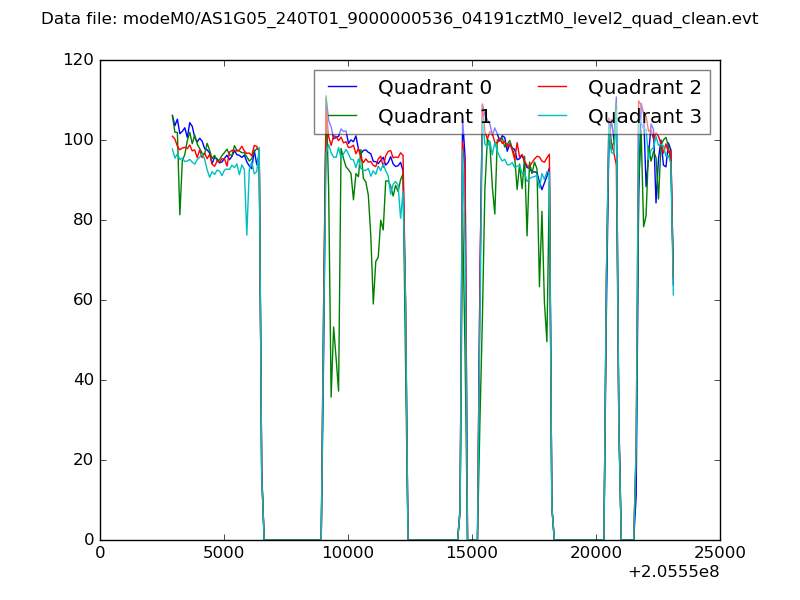 |
|
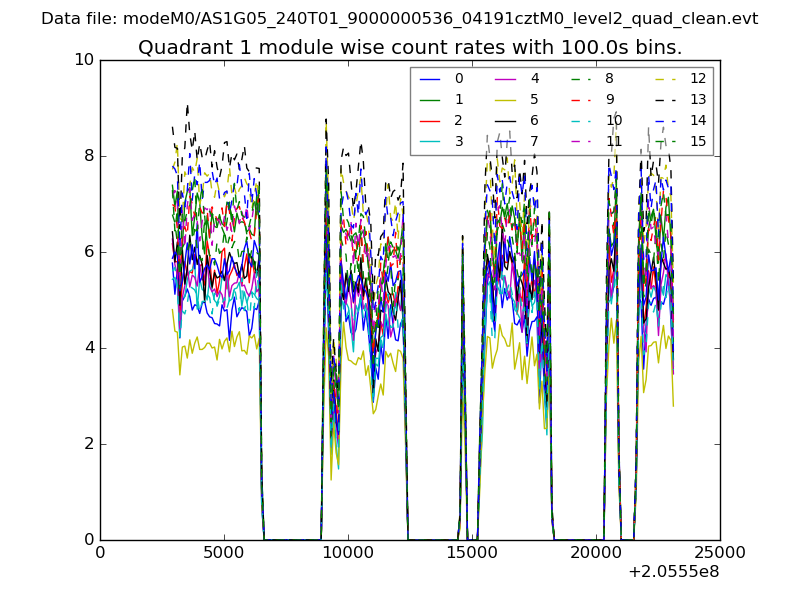
| Module-wise count rates for Quadrant A Data is divided into 100 sec bins |
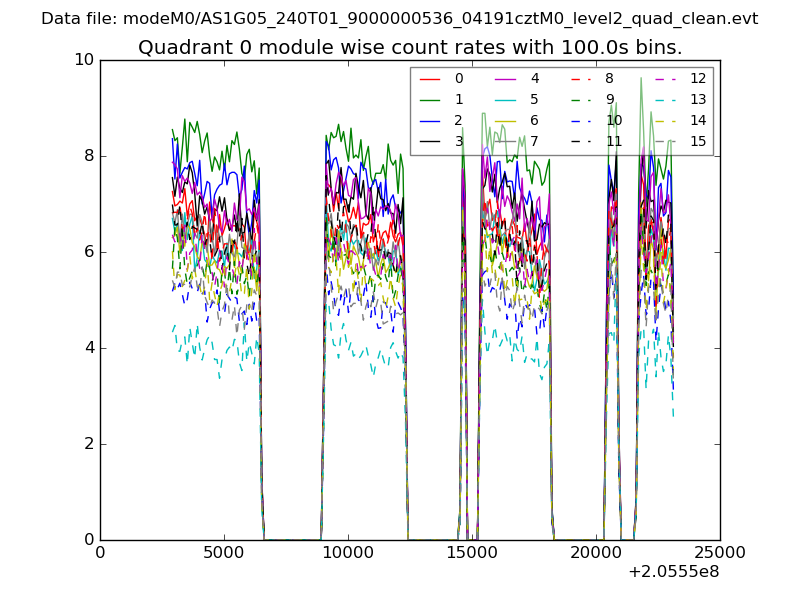 |
 |
| Module-wise count rates for Quadrant B Data is divided into 100 sec bins |
 |
 |
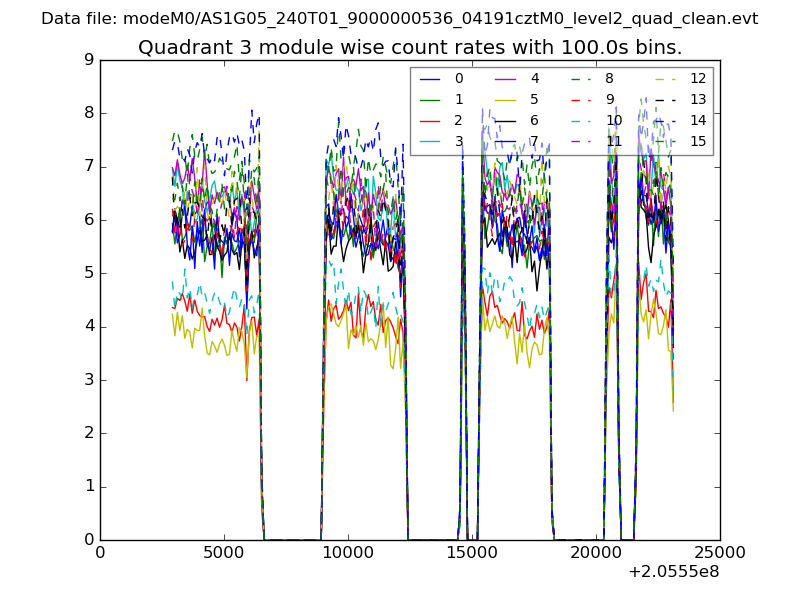
| Module-wise count rates for Quadrant C Data is divided into 100 sec bins |
 |
 |
| Module-wise count rates for Quadrant D Data is divided into 100 sec bins |
 |
 |
| Parameter | Plot |
|---|---|
| CZT HV Monitor | 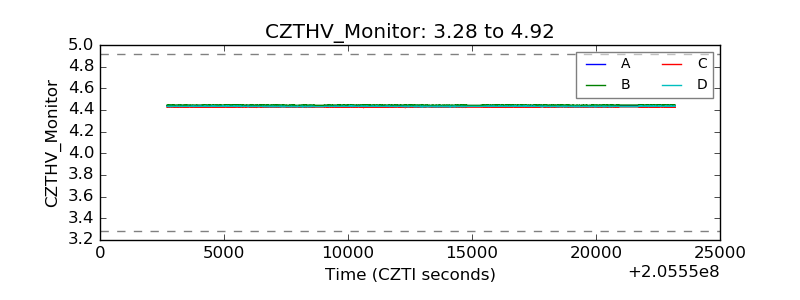 |
| D_VDD | 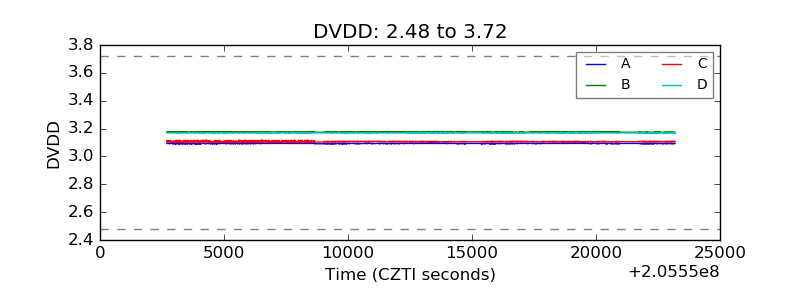 |
| Temperature 1 | 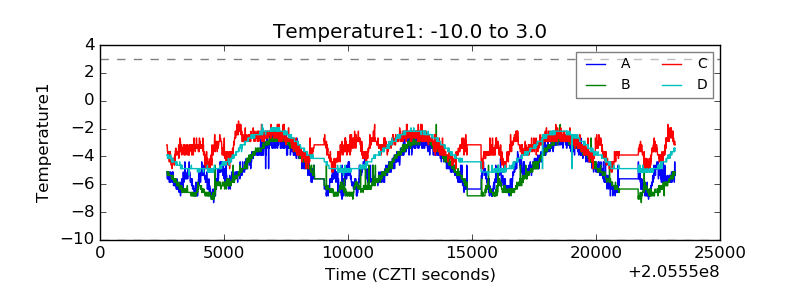 |
| Veto HV Monitor | 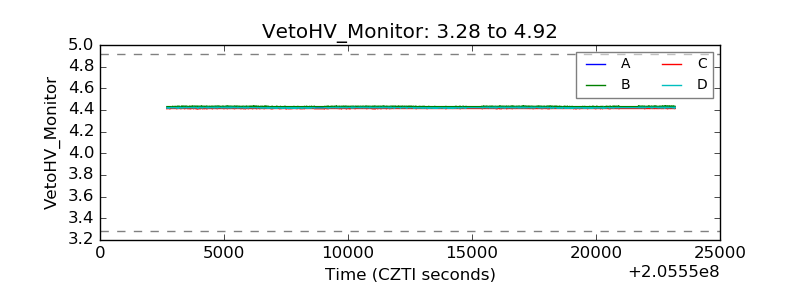 |
| Veto LLD | 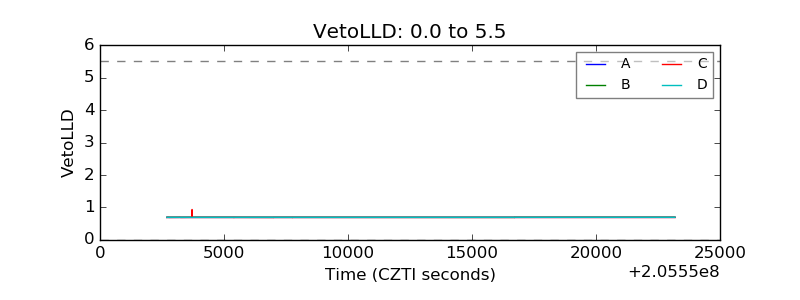 |
| Alpha Counter | 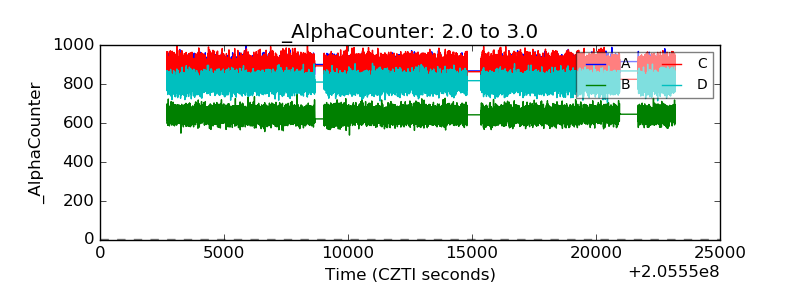 |
| _CPM_Rate | 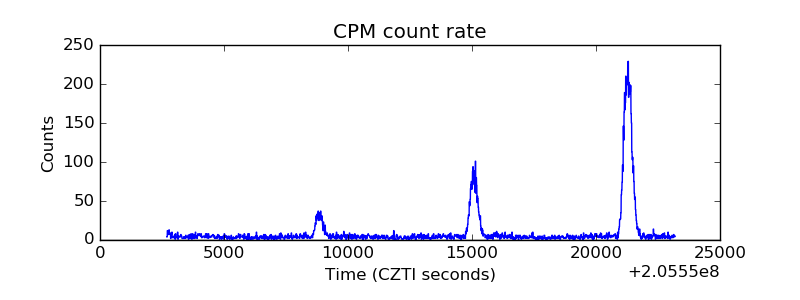 |
| CZT Counter | 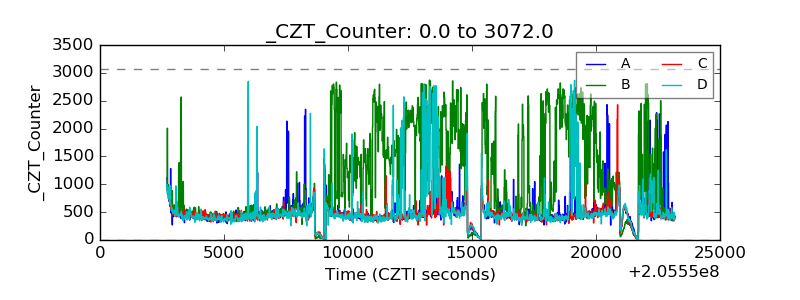 |
| +2.5 Volts monitor |  |
| +5 Volts monitor |  |
| _ROLL_ROT | 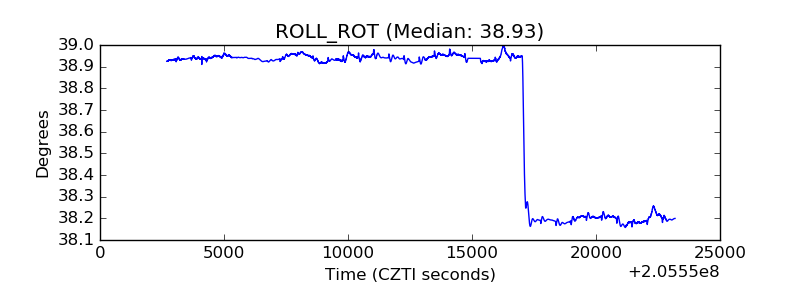 |
| _Roll_DEC | 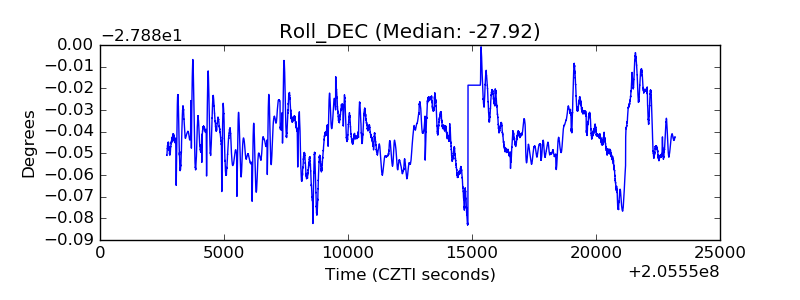 |
| _Roll_RA | 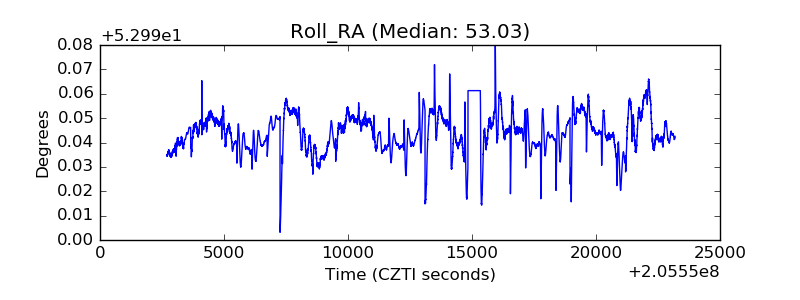 |
| Veto Counter |  |