| Param | Original file | Final file |
|---|---|---|
| Filename | modeM0/AS1G05_240T01_9000000536_04192cztM0_level2.evt | modeM0/AS1G05_240T01_9000000536_04192cztM0_level2_quad_clean.evt |
| Size (bytes) | 667,938,240 | 66,479,040 |
| Size | 637.0 MB | 63.4 MB |
| Events in quadrant A | 5,484,590 | 363,401 |
| Events in quadrant B | 7,970,713 | 355,154 |
| Events in quadrant C | 3,012,015 | 432,749 |
| Events in quadrant D | 3,330,601 | 417,180 |
| Mode SS | |||
|---|---|---|---|
| Quadrant | BADHDUFLAG | Total packets | Discarded packets |
| A | 0 | 130 | 0 |
| B | 0 | 130 | 0 |
| C | 0 | 130 | 0 |
| D | 0 | 130 | 0 |
| Mode M9 | |||
|---|---|---|---|
| Quadrant | BADHDUFLAG | Total packets | Discarded packets |
| A | 0 | 9 | 0 |
| B | 0 | 9 | 0 |
| C | 0 | 9 | 0 |
| D | 0 | 9 | 0 |
| Mode M0 | |||
|---|---|---|---|
| Quadrant | BADHDUFLAG | Total packets | Discarded packets |
| A | 0 | 20590 | 5 |
| B | 0 | 28066 | 1 |
| C | 0 | 13417 | 3 |
| D | 0 | 14374 | 1 |
| Quadrant | Total seconds | Saturated seconds | Saturation percentage |
|---|---|---|---|
| A | 6350 | 1092 | 17.196850% |
| B | 6351 | 2037 | 32.073689% |
| C | 6350 | 39 | 0.614173% |
| D | 6351 | 95 | 1.495827% |
Noise dominated data is calculated using 1-second bins in cleaned event files. If a bin has >2000 counts, and if more than 50% of those come from <1% of pixels, then it is considered to be noise-dominated and hence unusable.
| Quadrant | # 1 sec bins | Bins with >0 counts | Bins with >2000 counts | High rate bins dominated by noise | Noise dominated (total time) | Noise dominated (detector-on time) | Marked lightcurve |
|---|---|---|---|---|---|---|---|
| A | 7271 | 6352 | 879 | 879 | 12.09% | 13.84% | 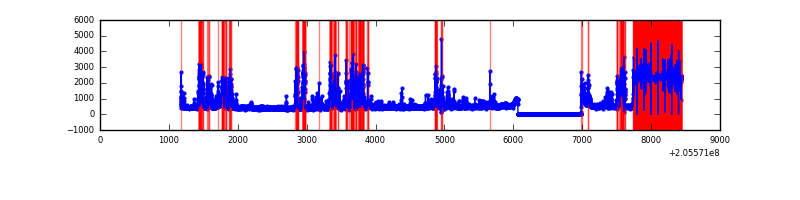 |
| B | 7271 | 6352 | 1642 | 1642 | 22.58% | 25.85% | 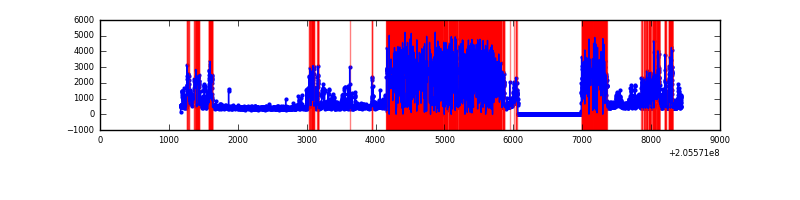 |
| C | 7271 | 6352 | 10 | 10 | 0.14% | 0.16% | 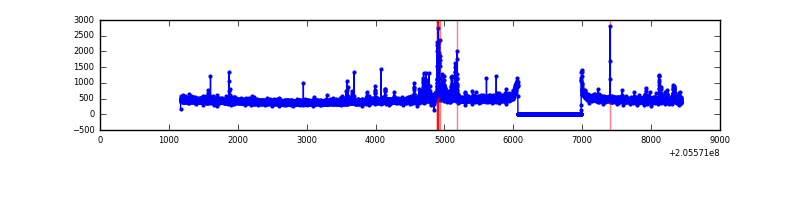 |
| D | 7271 | 6352 | 55 | 55 | 0.76% | 0.87% | 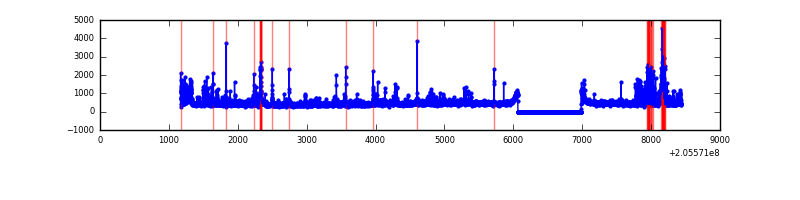 |
Top three noisy pixels from each quadrant. If the there are fewer than three noisy pixels in the level2.evt file, extra rows are filled as -1
| Pixel properties | Quadrant properties | ||||||
|---|---|---|---|---|---|---|---|
| Quadrant | DetID | PixID | Counts | Sigma | Mean | Median | Sigma |
| A | 0 | 50 | 2779534 | 20110.63 | 662 | 643 | 138.2 |
| A | 12 | 247 | 80938 | 581.09 | 662 | 643 | 138.2 |
| A | 15 | 234 | 51698 | 369.48 | 662 | 643 | 138.2 |
| B | 3 | 0 | 5576008 | 49307.41 | 582 | 570 | 113.1 |
| B | 10 | 16 | 67306 | 590.19 | 582 | 570 | 113.1 |
| B | 15 | 204 | 34476 | 299.85 | 582 | 570 | 113.1 |
| C | 9 | 144 | 209754 | 1251.35 | 714 | 717 | 167.0 |
| C | 1 | 16 | 7527 | 40.77 | 714 | 717 | 167.0 |
| C | 13 | 61 | 5845 | 30.7 | 714 | 717 | 167.0 |
| D | 12 | 110 | 189179 | 1078.24 | 715 | 694 | 174.8 |
| D | 13 | 239 | 189178 | 1078.23 | 715 | 694 | 174.8 |
| D | 12 | 233 | 71433 | 404.67 | 715 | 694 | 174.8 |
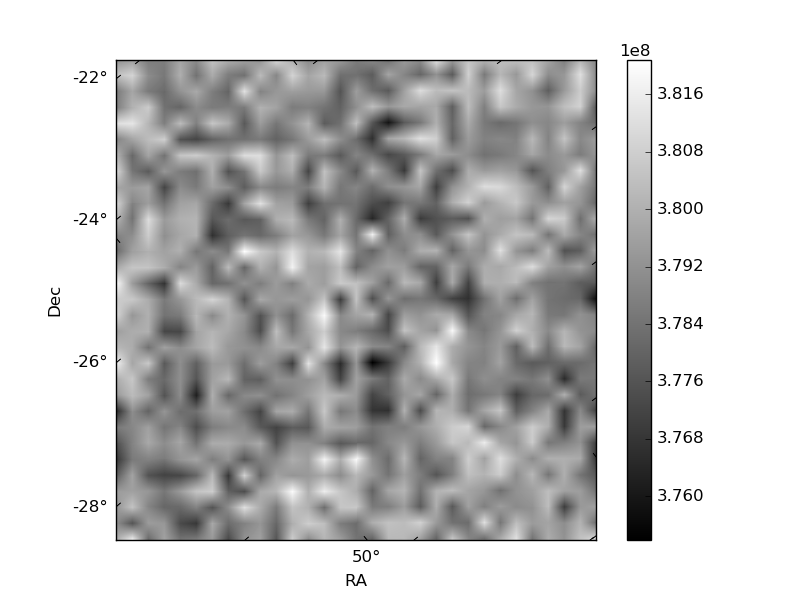
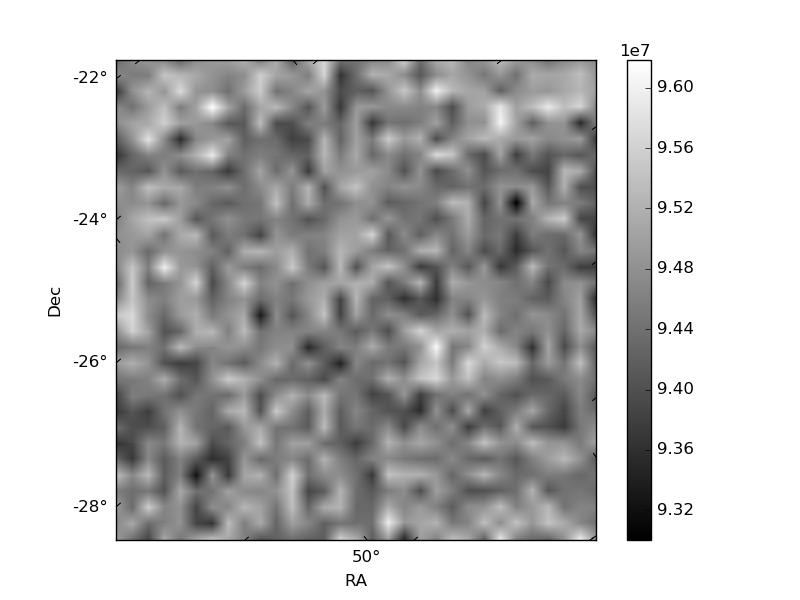
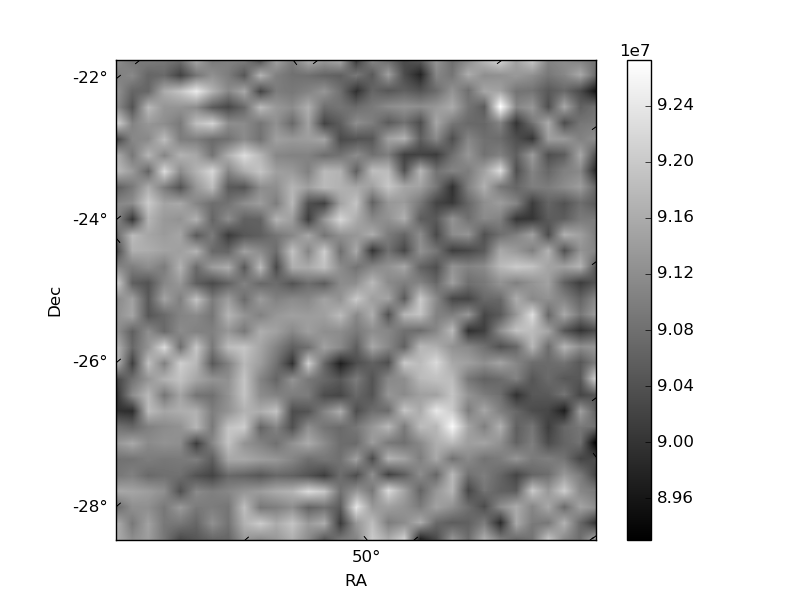
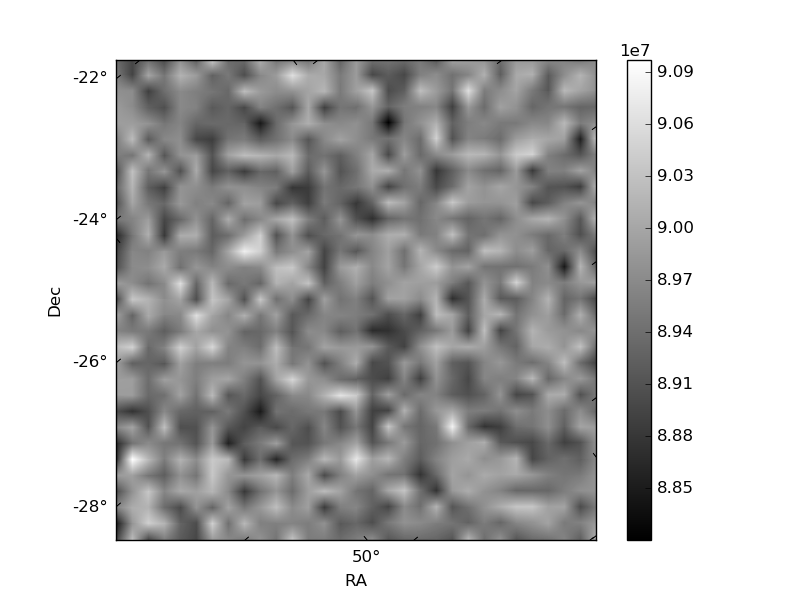
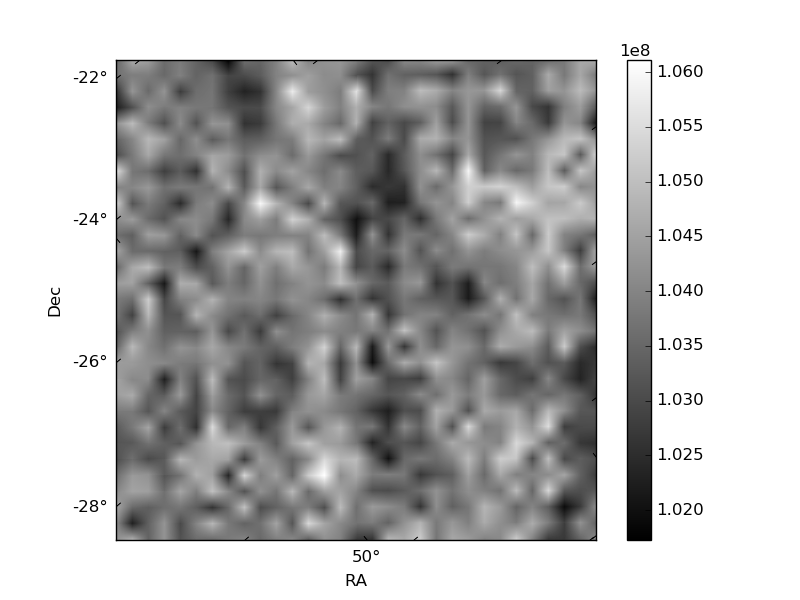
Histogram calculated using DETX and DETY for each event in the final _common_clean file
| Quadrant A | 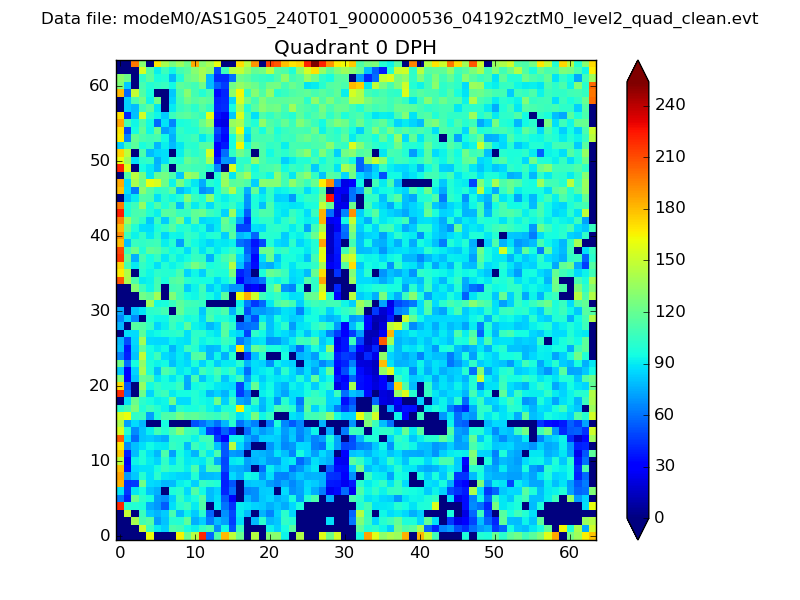 |
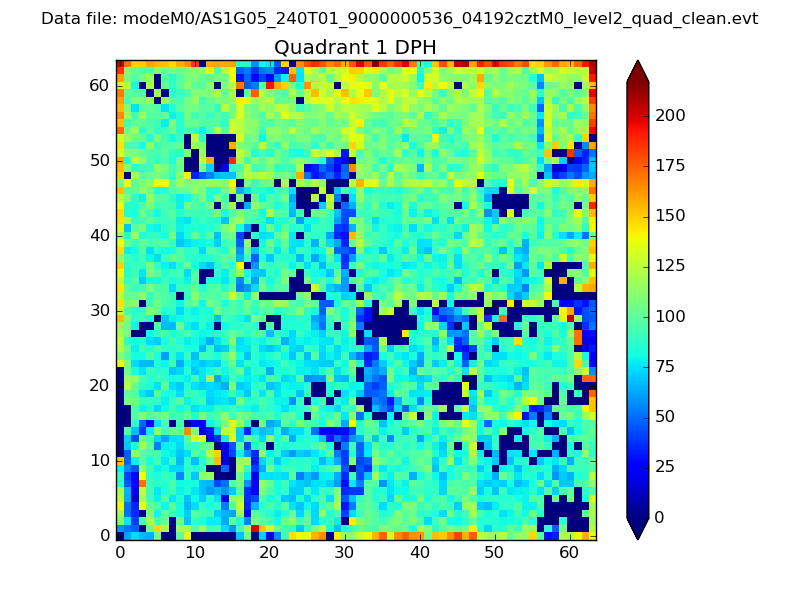 |
Quadrant B |
|---|---|---|---|
| Quadrant D | 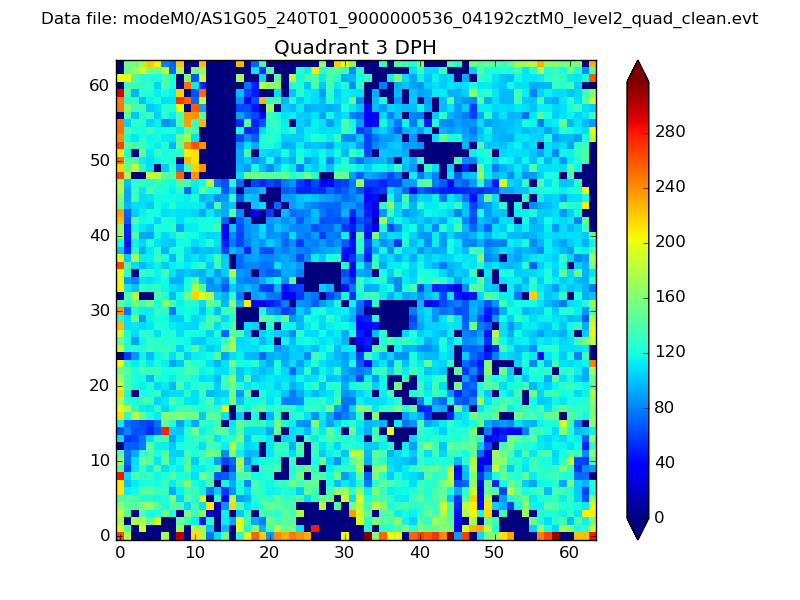 |
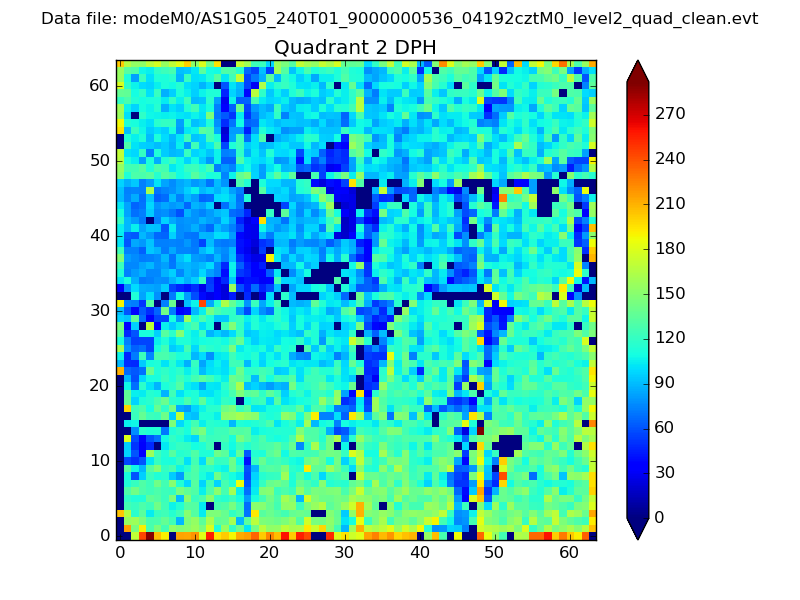 |
Quadrant C |
| Plot type | Count rate plots | Images |
|---|---|---|
| Comparison with Poisson distribution Blue bars denote a histogram of data divided into 1 sec bins. Red curve is a Poisson curve with rate = median count rate of data. |
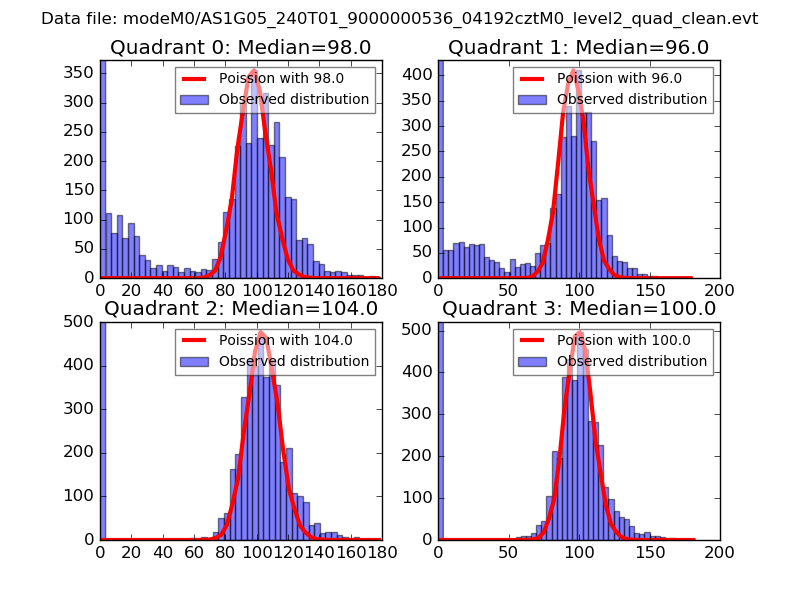 |
 |
| Quadrant-wise count rates Data is divided into 100 sec bins |
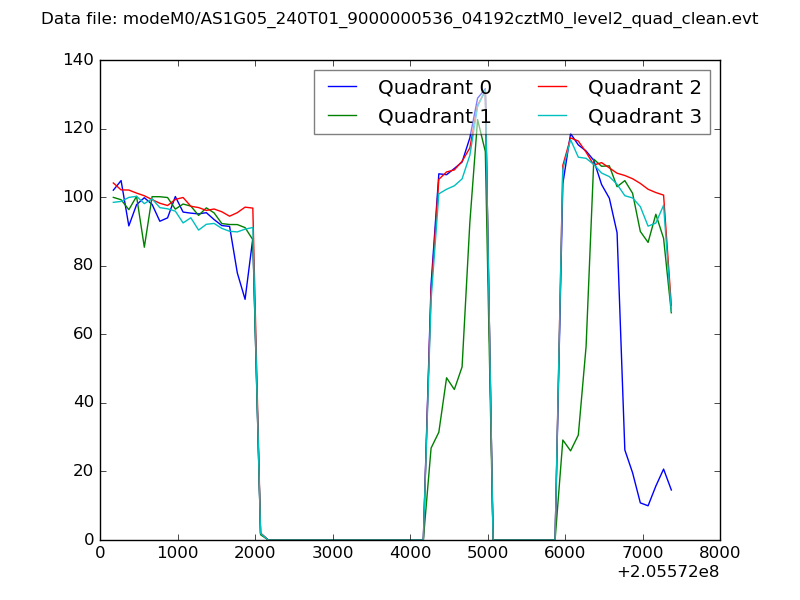 |
|
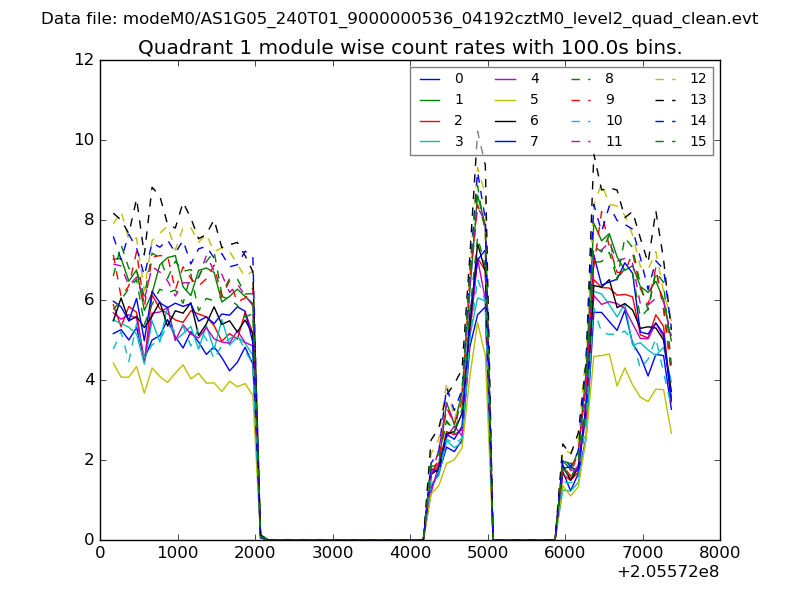
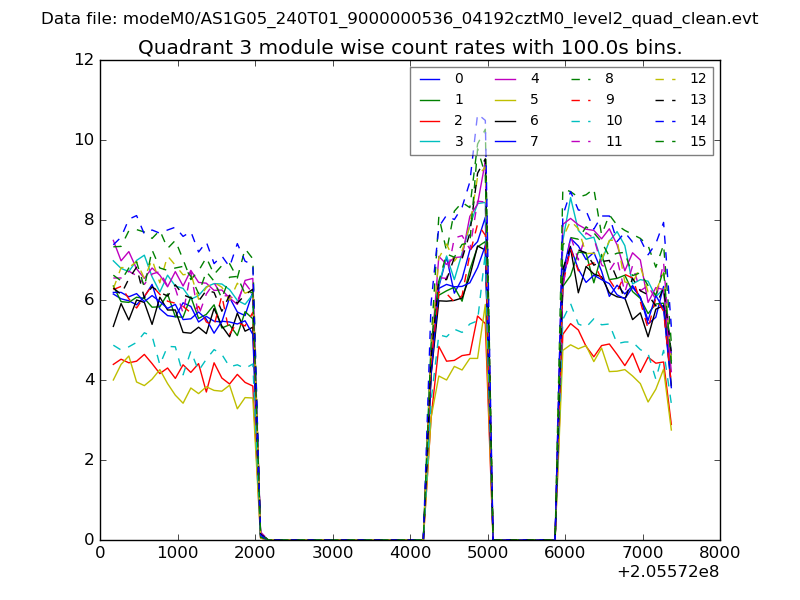
| Module-wise count rates for Quadrant A Data is divided into 100 sec bins |
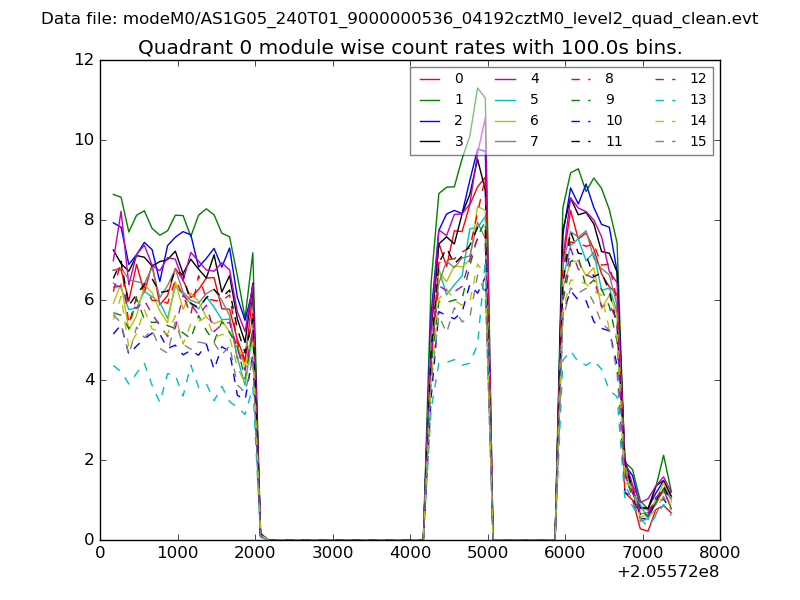 |
 |
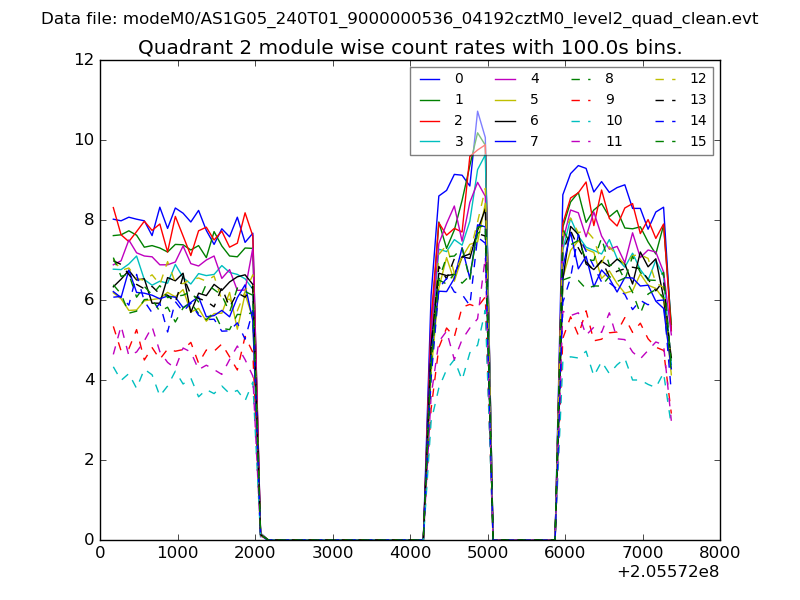
| Module-wise count rates for Quadrant B Data is divided into 100 sec bins |
 |
 |
| Module-wise count rates for Quadrant C Data is divided into 100 sec bins |
 |
 |
| Module-wise count rates for Quadrant D Data is divided into 100 sec bins |
 |
 |
| Parameter | Plot |
|---|---|
| CZT HV Monitor | 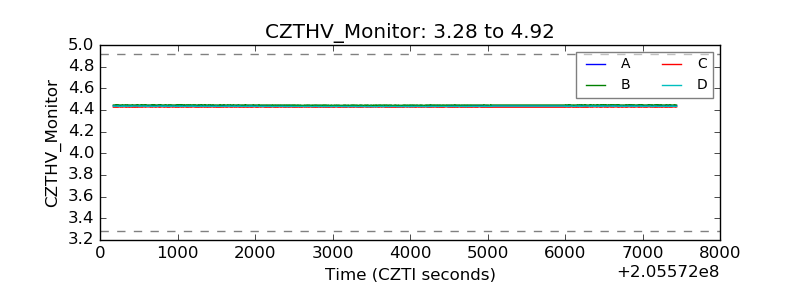 |
| D_VDD | 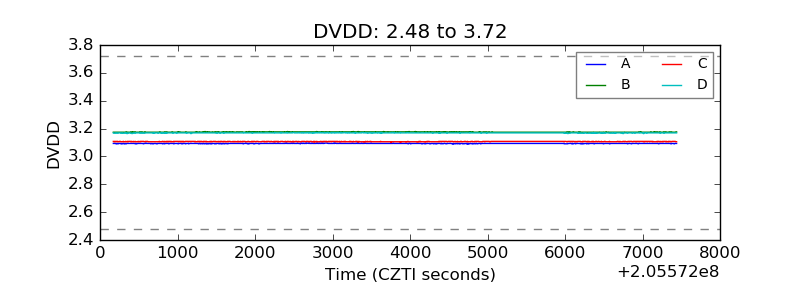 |
| Temperature 1 | 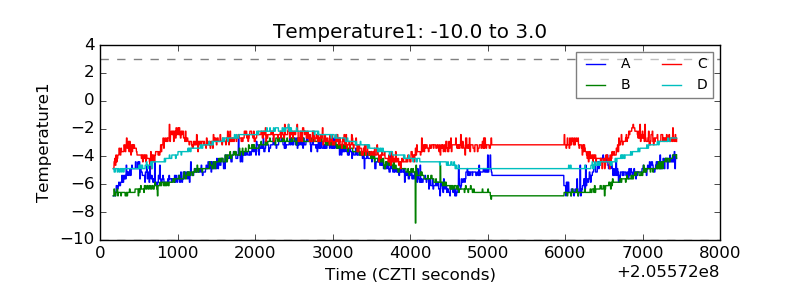 |
| Veto HV Monitor |  |
| Veto LLD | 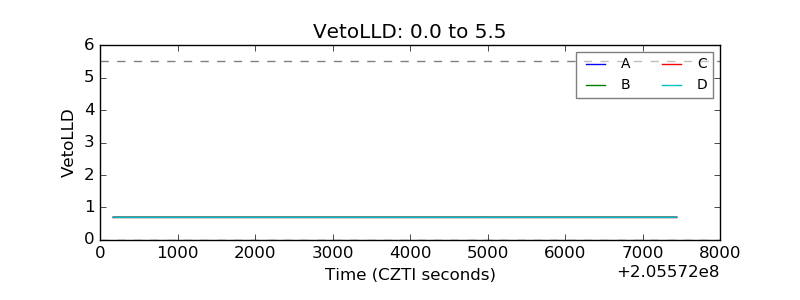 |
| Alpha Counter | 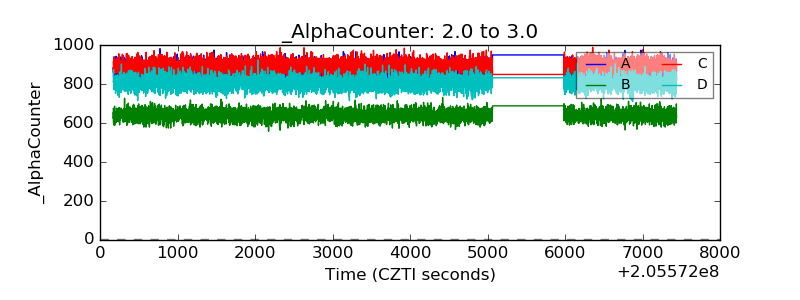 |
| _CPM_Rate | 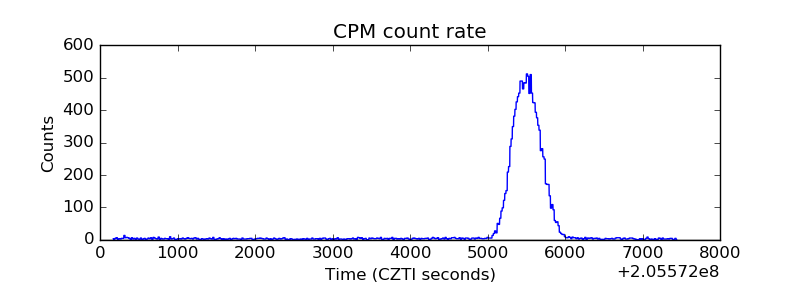 |
| CZT Counter | 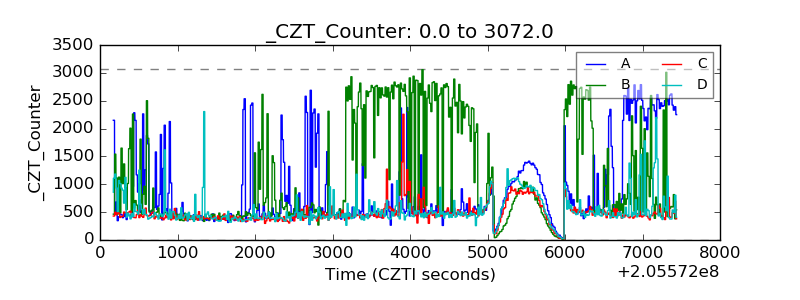 |
| +2.5 Volts monitor | 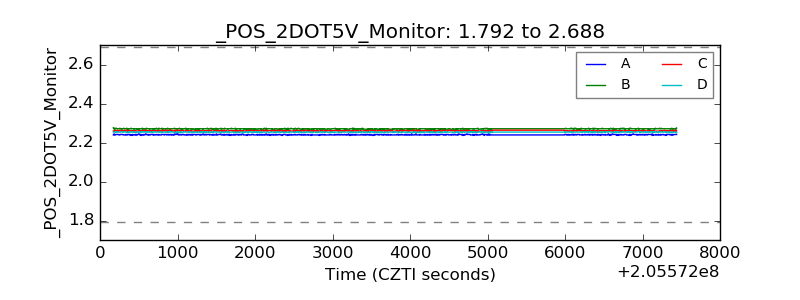 |
| +5 Volts monitor |  |
| _ROLL_ROT | 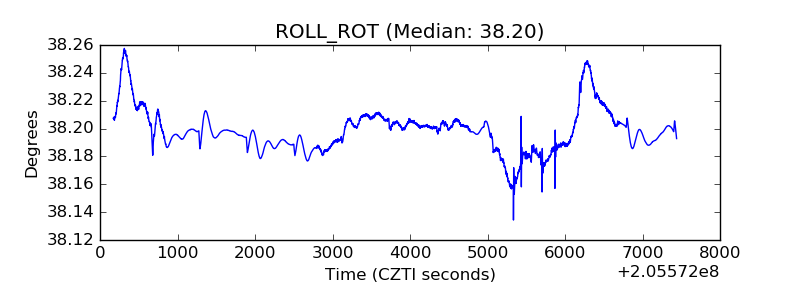 |
| _Roll_DEC | 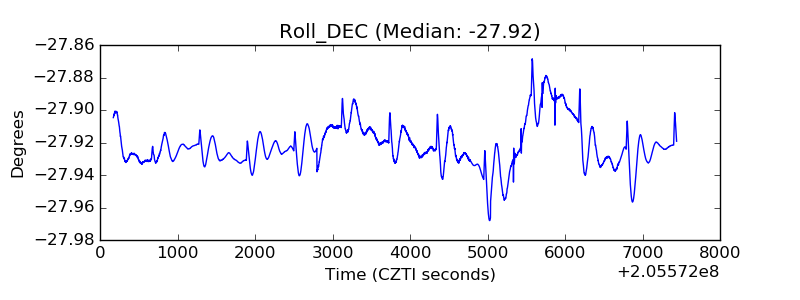 |
| _Roll_RA | 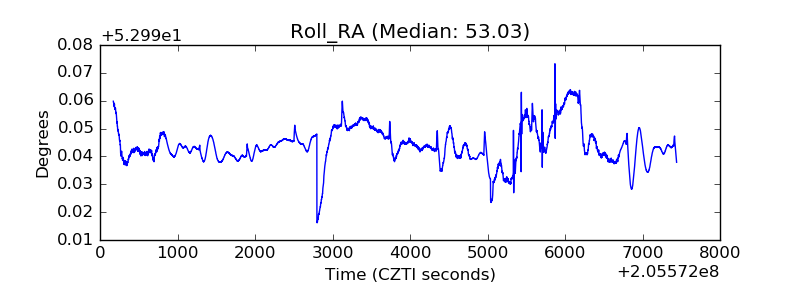 |
| Veto Counter | 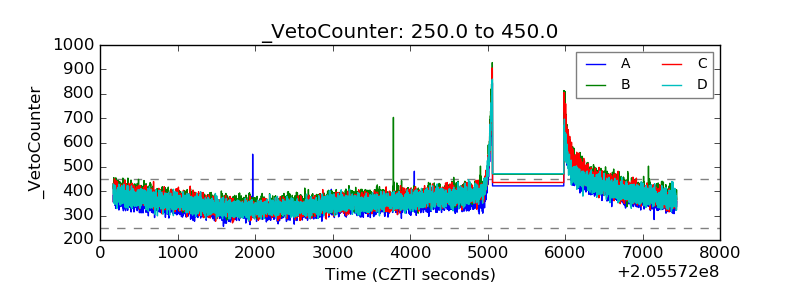 |