| Param | Original file | Final file |
|---|---|---|
| Filename | modeM0/AS1G05_240T01_9000000536_04194cztM0_level2.evt | modeM0/AS1G05_240T01_9000000536_04194cztM0_level2_quad_clean.evt |
| Size (bytes) | 585,267,840 | 63,207,360 |
| Size | 558.2 MB | 60.3 MB |
| Events in quadrant A | 5,610,456 | 329,653 |
| Events in quadrant B | 4,250,077 | 394,273 |
| Events in quadrant C | 3,939,191 | 392,099 |
| Events in quadrant D | 3,524,621 | 383,877 |
| Mode SS | |||
|---|---|---|---|
| Quadrant | BADHDUFLAG | Total packets | Discarded packets |
| A | 0 | 120 | 0 |
| B | 0 | 120 | 0 |
| C | 0 | 120 | 0 |
| D | 0 | 120 | 0 |
| Mode M9 | |||
|---|---|---|---|
| Quadrant | BADHDUFLAG | Total packets | Discarded packets |
| A | 0 | 10 | 0 |
| B | 0 | 10 | 0 |
| C | 0 | 10 | 0 |
| D | 0 | 10 | 0 |
| Mode M0 | |||
|---|---|---|---|
| Quadrant | BADHDUFLAG | Total packets | Discarded packets |
| A | 0 | 20565 | 2 |
| B | 0 | 16345 | 1 |
| C | 0 | 15784 | 1 |
| D | 0 | 14666 | 1 |
| Quadrant | Total seconds | Saturated seconds | Saturation percentage |
|---|---|---|---|
| A | 5911 | 1283 | 21.705295% |
| B | 5911 | 411 | 6.953138% |
| C | 5911 | 212 | 3.586534% |
| D | 5911 | 256 | 4.330908% |
Noise dominated data is calculated using 1-second bins in cleaned event files. If a bin has >2000 counts, and if more than 50% of those come from <1% of pixels, then it is considered to be noise-dominated and hence unusable.
| Quadrant | # 1 sec bins | Bins with >0 counts | Bins with >2000 counts | High rate bins dominated by noise | Noise dominated (total time) | Noise dominated (detector-on time) | Marked lightcurve |
|---|---|---|---|---|---|---|---|
| A | 6962 | 5913 | 991 | 991 | 14.23% | 16.76% | 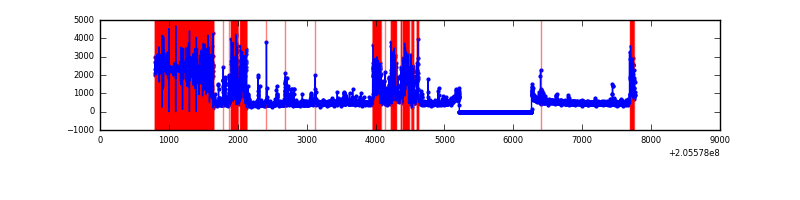 |
| B | 6962 | 5912 | 287 | 287 | 4.12% | 4.85% | 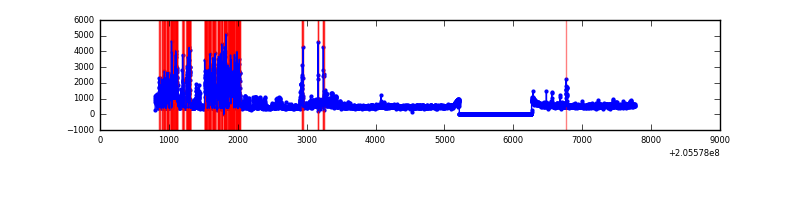 |
| C | 6962 | 5913 | 146 | 146 | 2.10% | 2.47% | 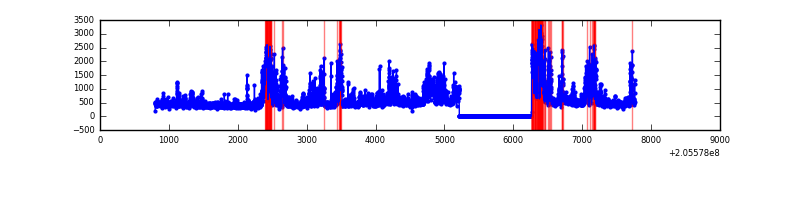 |
| D | 6962 | 5913 | 187 | 187 | 2.69% | 3.16% | 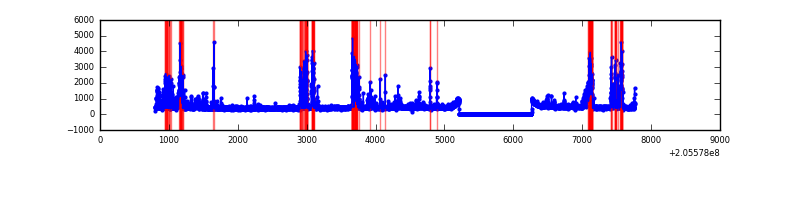 |
Top three noisy pixels from each quadrant. If the there are fewer than three noisy pixels in the level2.evt file, extra rows are filled as -1
| Pixel properties | Quadrant properties | ||||||
|---|---|---|---|---|---|---|---|
| Quadrant | DetID | PixID | Counts | Sigma | Mean | Median | Sigma |
| A | 0 | 50 | 2936227 | 23424.66 | 614 | 599 | 125.3 |
| A | 12 | 247 | 145266 | 1154.36 | 614 | 599 | 125.3 |
| A | 0 | 199 | 105911 | 840.33 | 614 | 599 | 125.3 |
| B | 3 | 0 | 1369661 | 10242.28 | 688 | 671 | 133.7 |
| B | 8 | 3 | 105697 | 785.77 | 688 | 671 | 133.7 |
| B | 10 | 16 | 47390 | 349.53 | 688 | 671 | 133.7 |
| C | 9 | 144 | 1345046 | 8663.84 | 663 | 667 | 155.2 |
| C | 13 | 61 | 5403 | 30.52 | 663 | 667 | 155.2 |
| C | 12 | 4 | 3153 | 16.02 | 663 | 667 | 155.2 |
| D | 13 | 239 | 691246 | 4261.1 | 668 | 648 | 162.1 |
| D | 12 | 233 | 98186 | 601.82 | 668 | 648 | 162.1 |
| D | 12 | 110 | 98025 | 600.83 | 668 | 648 | 162.1 |
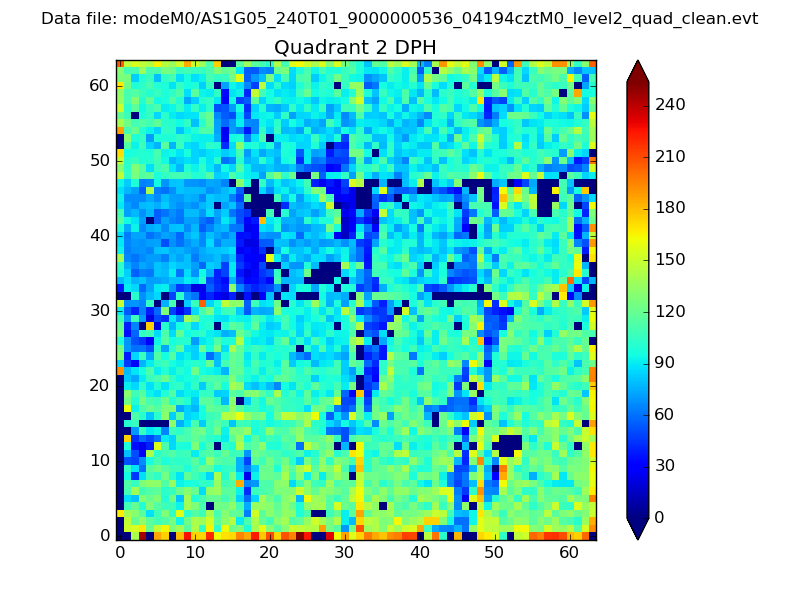
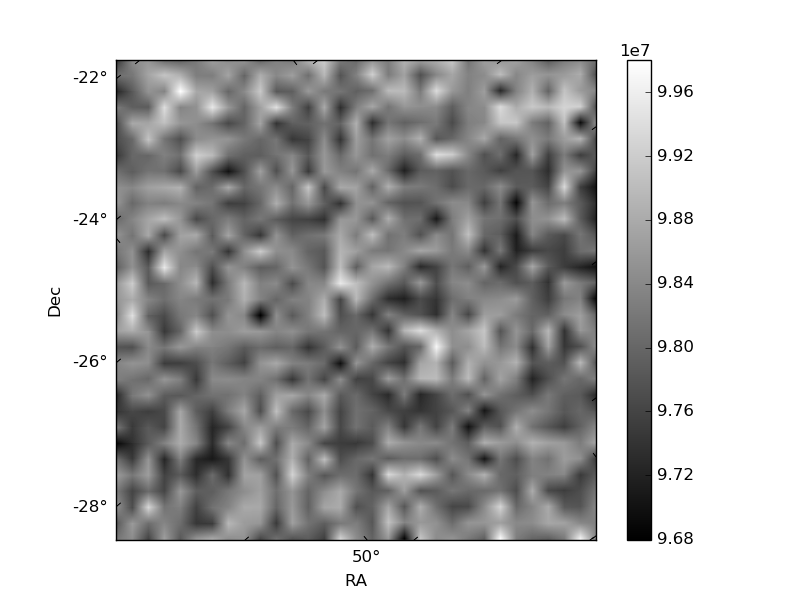
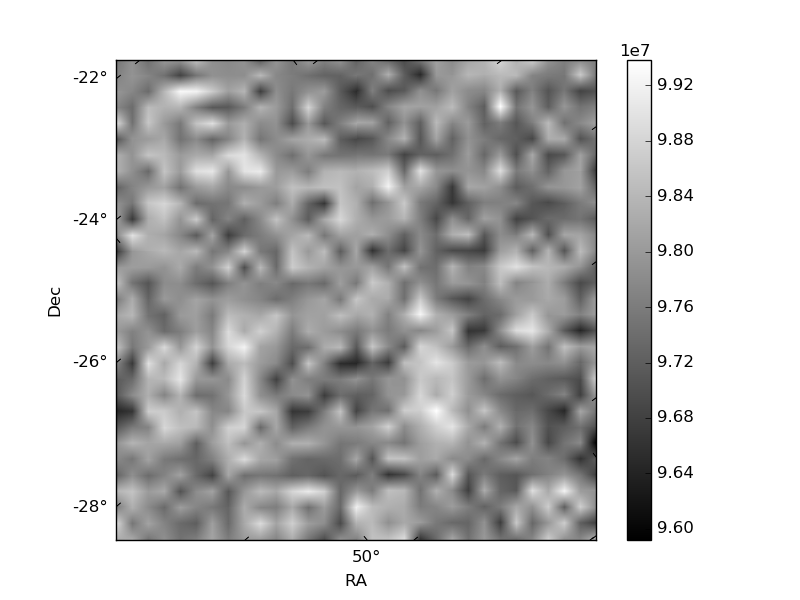
Histogram calculated using DETX and DETY for each event in the final _common_clean file
| Quadrant A | 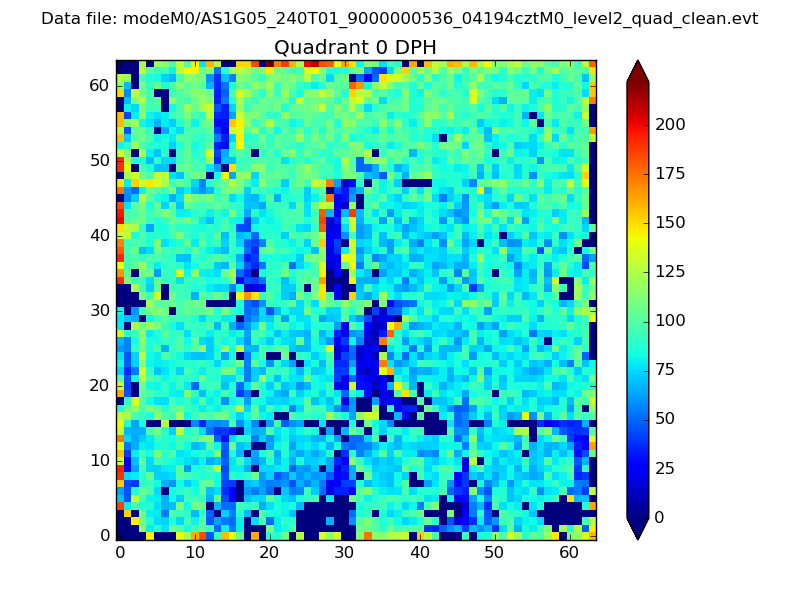 |
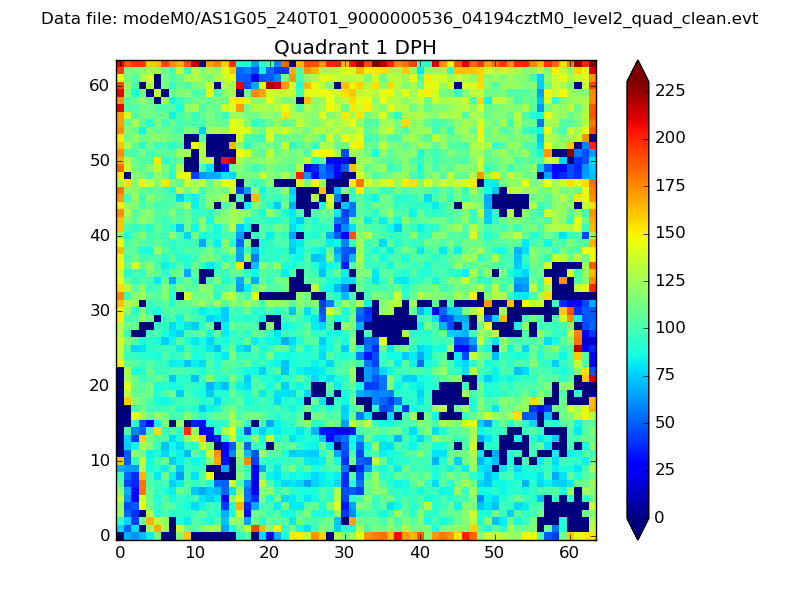 |
Quadrant B |
|---|---|---|---|
| Quadrant D | 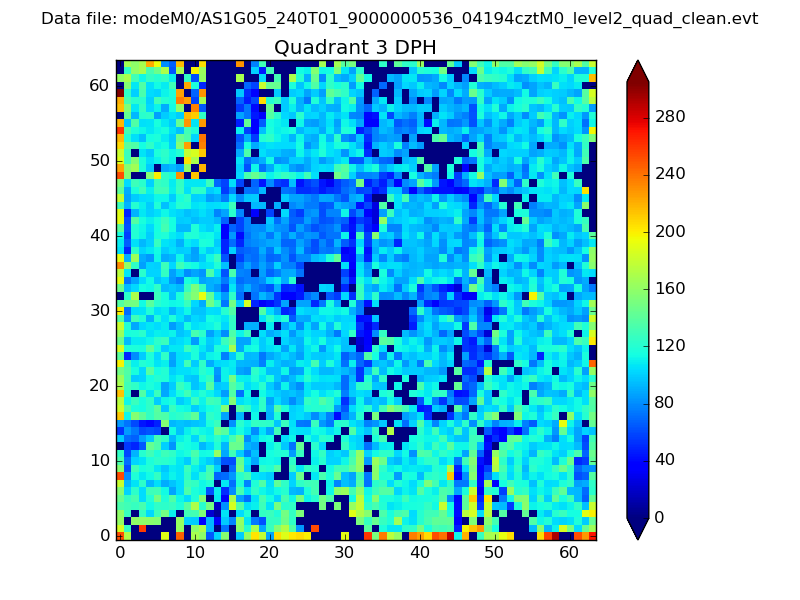 |
 |
Quadrant C |
| Plot type | Count rate plots | Images |
|---|---|---|
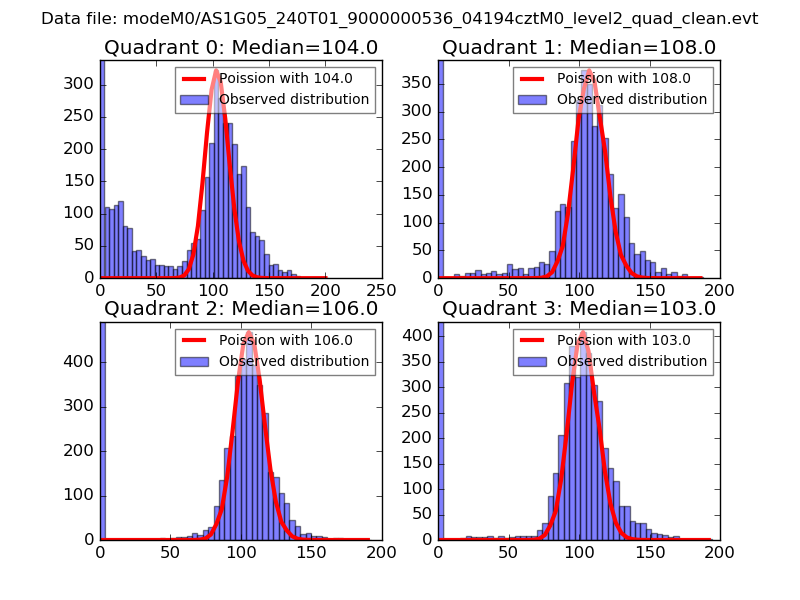
| Comparison with Poisson distribution Blue bars denote a histogram of data divided into 1 sec bins. Red curve is a Poisson curve with rate = median count rate of data. |
 |
 |
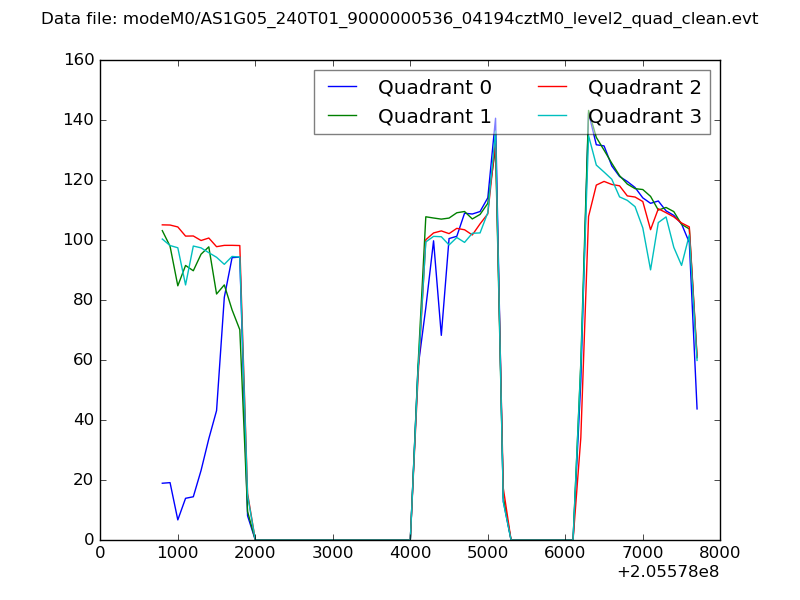
| Quadrant-wise count rates Data is divided into 100 sec bins |
 |
|
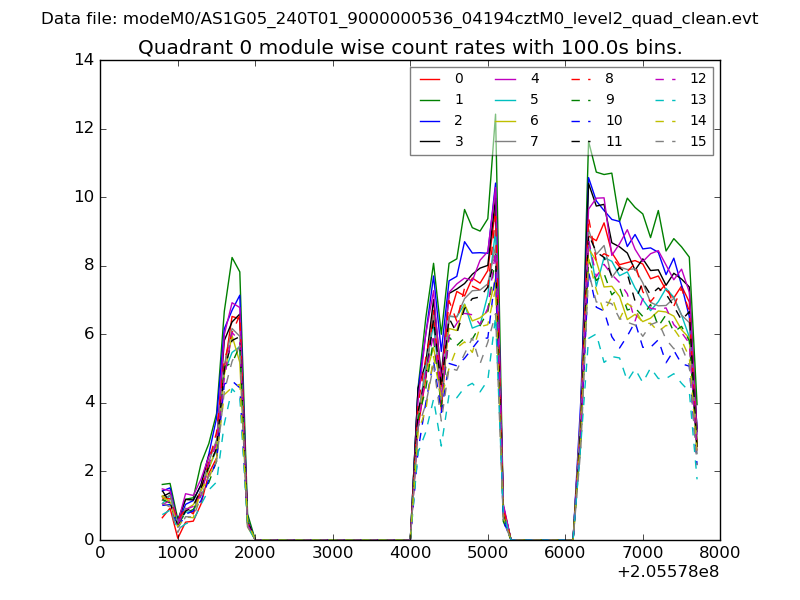
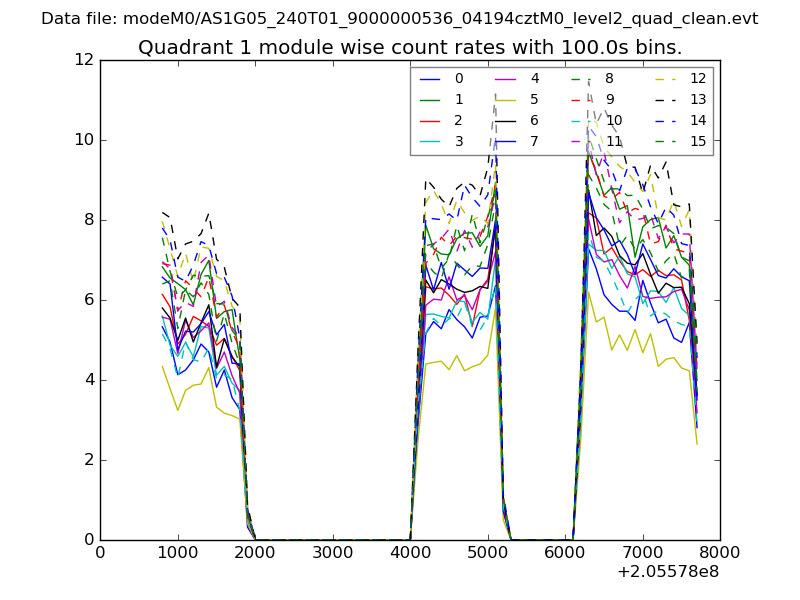
| Module-wise count rates for Quadrant A Data is divided into 100 sec bins |
 |
 |
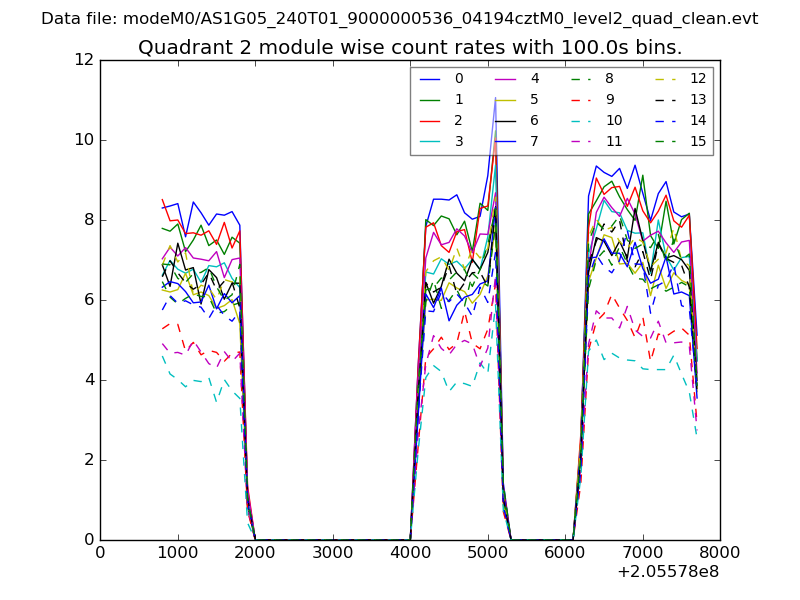
| Module-wise count rates for Quadrant B Data is divided into 100 sec bins |
 |
 |
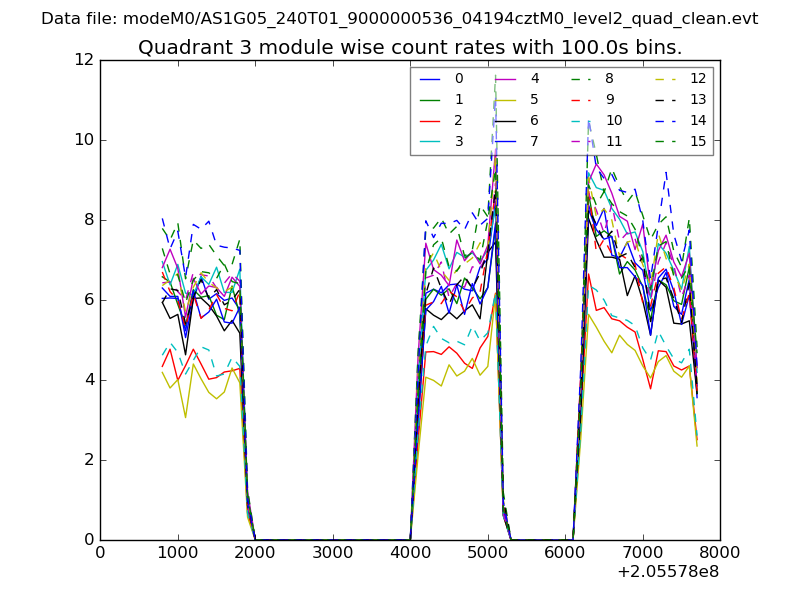
| Module-wise count rates for Quadrant C Data is divided into 100 sec bins |
 |
 |
| Module-wise count rates for Quadrant D Data is divided into 100 sec bins |
 |
 |
| Parameter | Plot |
|---|---|
| CZT HV Monitor | 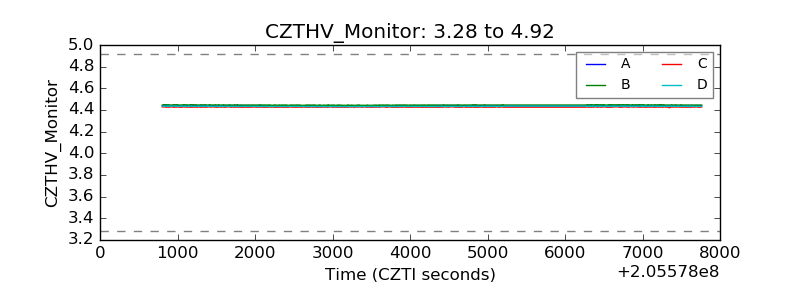 |
| D_VDD | 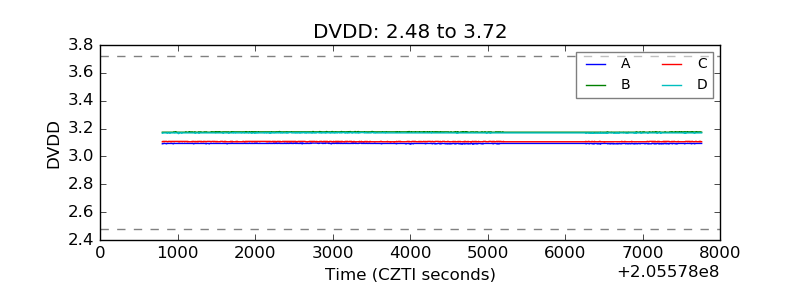 |
| Temperature 1 | 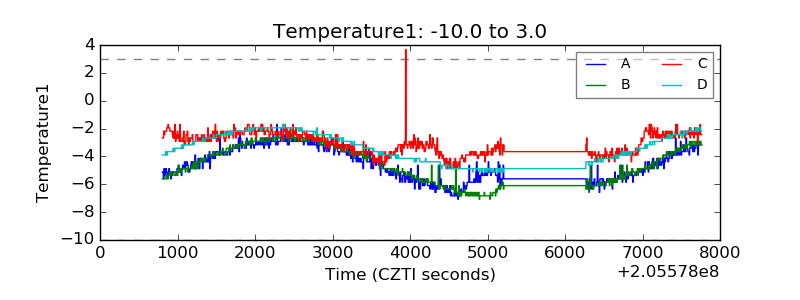 |
| Veto HV Monitor | 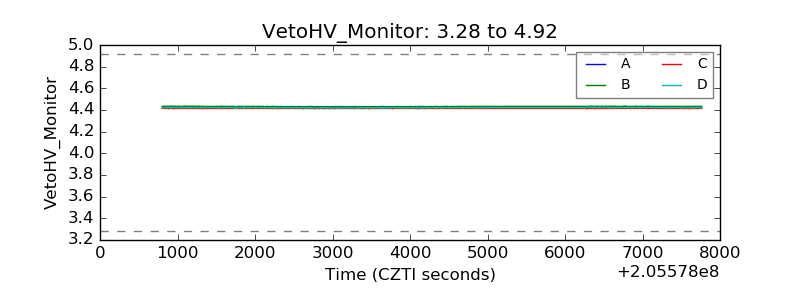 |
| Veto LLD | 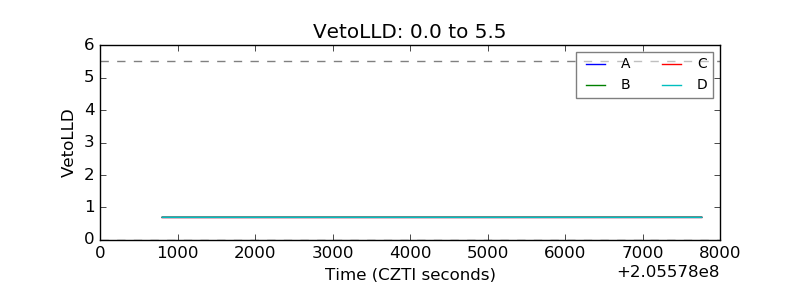 |
| Alpha Counter | 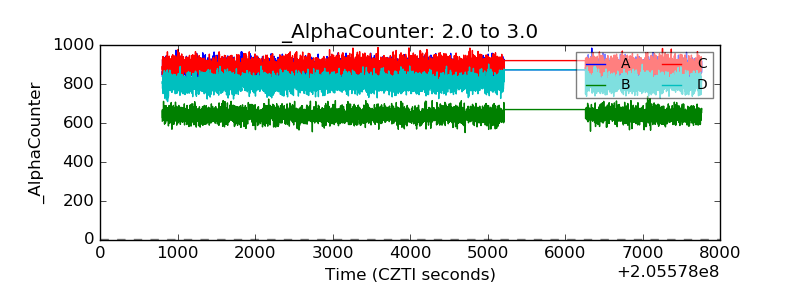 |
| _CPM_Rate | 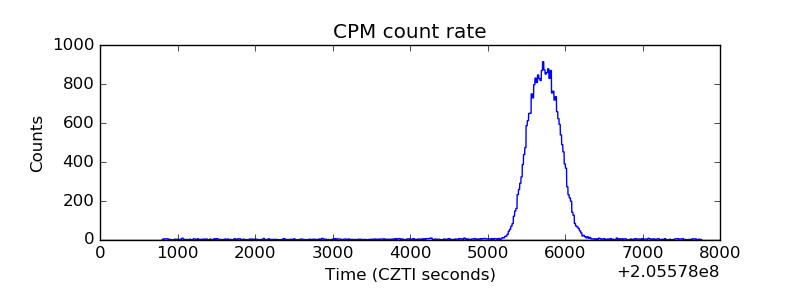 |
| CZT Counter | 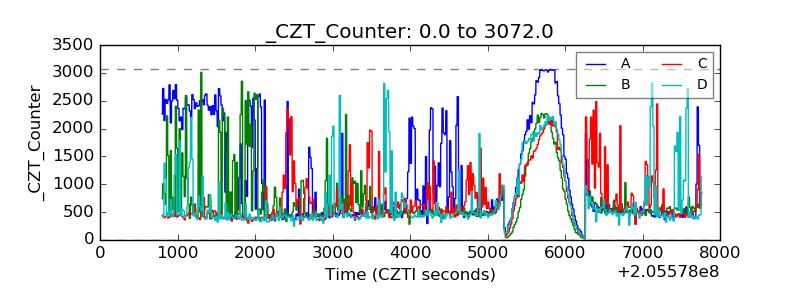 |
| +2.5 Volts monitor | 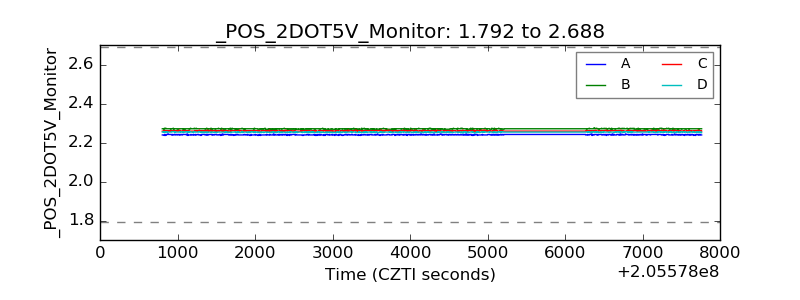 |
| +5 Volts monitor | 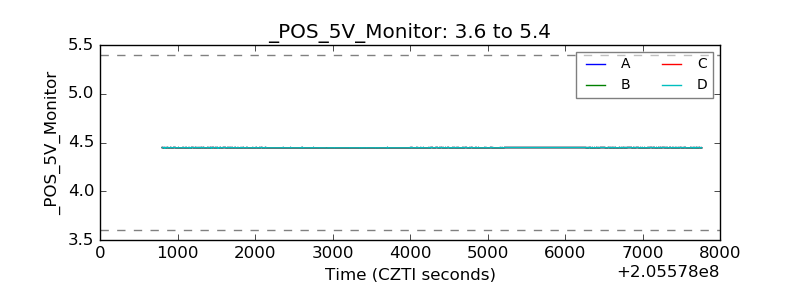 |
| _ROLL_ROT | 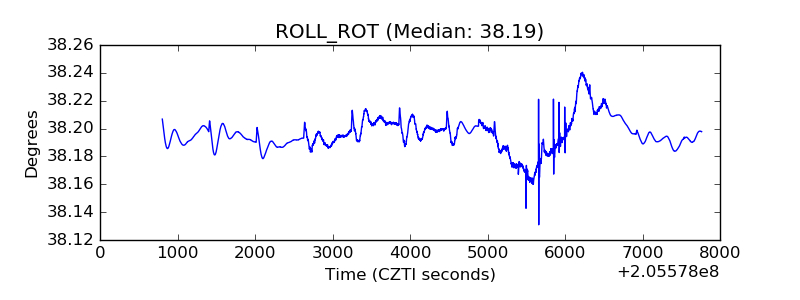 |
| _Roll_DEC | 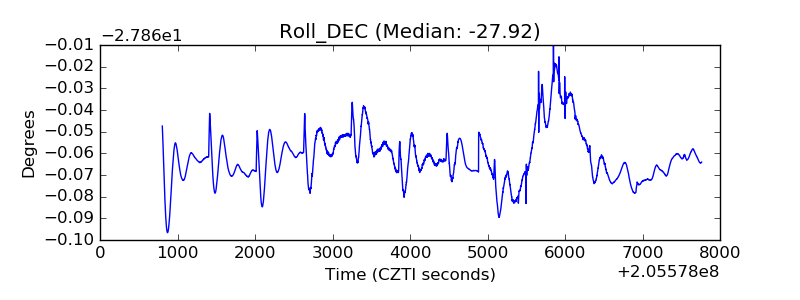 |
| _Roll_RA | 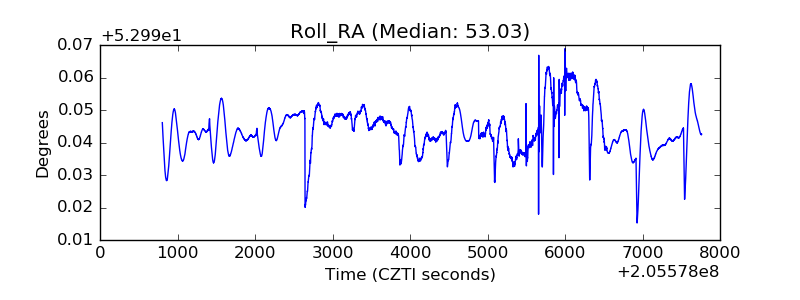 |
| Veto Counter | 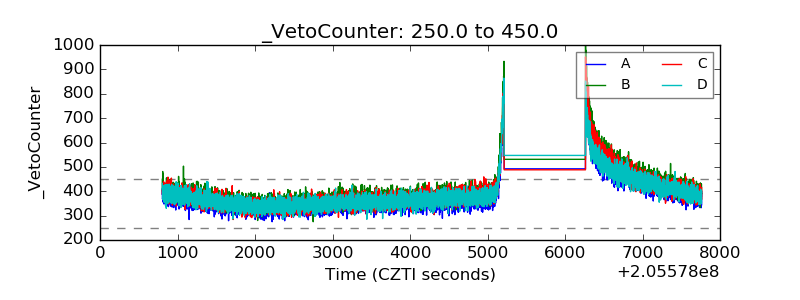 |