| Param | Original file | Final file |
|---|---|---|
| Filename | modeM0/AS1G05_240T01_9000000536_04195cztM0_level2.evt | modeM0/AS1G05_240T01_9000000536_04195cztM0_level2_quad_clean.evt |
| Size (bytes) | 648,423,360 | 63,858,240 |
| Size | 618.4 MB | 60.9 MB |
| Events in quadrant A | 5,616,939 | 377,222 |
| Events in quadrant B | 3,593,468 | 403,592 |
| Events in quadrant C | 6,734,527 | 353,419 |
| Events in quadrant D | 3,285,595 | 378,282 |
| Mode SS | |||
|---|---|---|---|
| Quadrant | BADHDUFLAG | Total packets | Discarded packets |
| A | 0 | 122 | 0 |
| B | 0 | 122 | 0 |
| C | 0 | 122 | 0 |
| D | 0 | 122 | 0 |
| Mode M9 | |||
|---|---|---|---|
| Quadrant | BADHDUFLAG | Total packets | Discarded packets |
| A | 0 | 12 | 0 |
| B | 0 | 12 | 0 |
| C | 0 | 12 | 0 |
| D | 0 | 12 | 0 |
| Mode M0 | |||
|---|---|---|---|
| Quadrant | BADHDUFLAG | Total packets | Discarded packets |
| A | 0 | 20615 | 2 |
| B | 0 | 14311 | 1 |
| C | 0 | 24030 | 1 |
| D | 0 | 13909 | 1 |
| Quadrant | Total seconds | Saturated seconds | Saturation percentage |
|---|---|---|---|
| A | 6018 | 1062 | 17.647059% |
| B | 6018 | 115 | 1.910934% |
| C | 6018 | 1112 | 18.477900% |
| D | 6018 | 140 | 2.326354% |
Noise dominated data is calculated using 1-second bins in cleaned event files. If a bin has >2000 counts, and if more than 50% of those come from <1% of pixels, then it is considered to be noise-dominated and hence unusable.
| Quadrant | # 1 sec bins | Bins with >0 counts | Bins with >2000 counts | High rate bins dominated by noise | Noise dominated (total time) | Noise dominated (detector-on time) | Marked lightcurve |
|---|---|---|---|---|---|---|---|
| A | 7203 | 6019 | 727 | 727 | 10.09% | 12.08% | 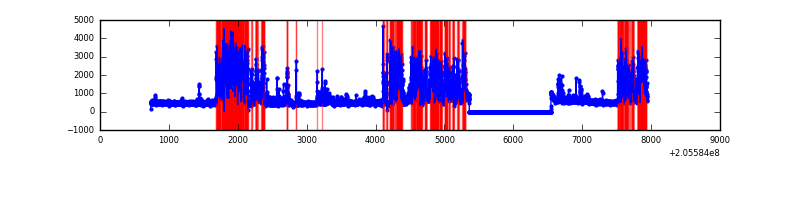 |
| B | 7203 | 6019 | 38 | 38 | 0.53% | 0.63% | 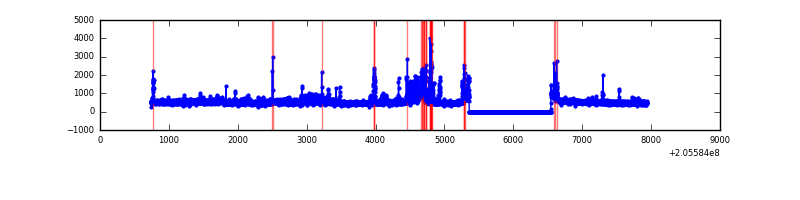 |
| C | 7203 | 6019 | 1090 | 1090 | 15.13% | 18.11% | 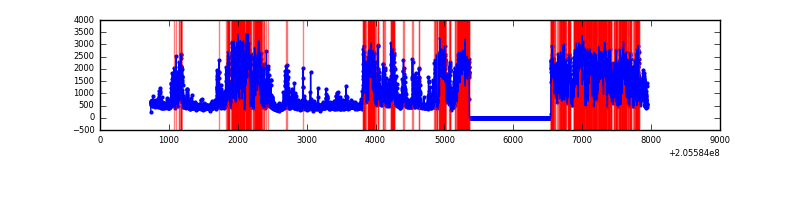 |
| D | 7203 | 6019 | 101 | 101 | 1.40% | 1.68% | 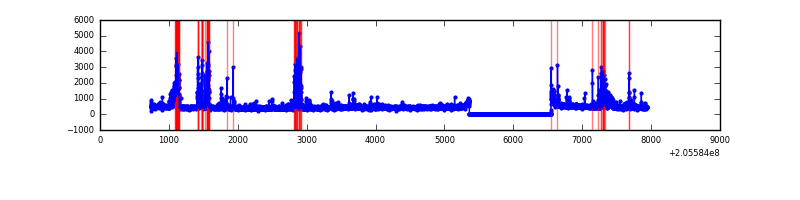 |
Top three noisy pixels from each quadrant. If the there are fewer than three noisy pixels in the level2.evt file, extra rows are filled as -1
| Pixel properties | Quadrant properties | ||||||
|---|---|---|---|---|---|---|---|
| Quadrant | DetID | PixID | Counts | Sigma | Mean | Median | Sigma |
| A | 0 | 50 | 2253971 | 16273.54 | 680 | 665 | 138.5 |
| A | 0 | 199 | 422506 | 3046.57 | 680 | 665 | 138.5 |
| A | 12 | 247 | 202012 | 1454.14 | 680 | 665 | 138.5 |
| B | 3 | 0 | 315029 | 2241.04 | 730 | 714 | 140.3 |
| B | 10 | 16 | 301494 | 2144.53 | 730 | 714 | 140.3 |
| B | 8 | 3 | 70614 | 498.38 | 730 | 714 | 140.3 |
| C | 9 | 144 | 4171418 | 27508.57 | 653 | 656 | 151.6 |
| C | 10 | 65 | 6324 | 37.38 | 653 | 656 | 151.6 |
| C | 13 | 61 | 5324 | 30.79 | 653 | 656 | 151.6 |
| D | 13 | 239 | 410125 | 2433.91 | 701 | 683 | 168.2 |
| D | 13 | 61 | 62358 | 366.62 | 701 | 683 | 168.2 |
| D | 4 | 95 | 37070 | 216.3 | 701 | 683 | 168.2 |
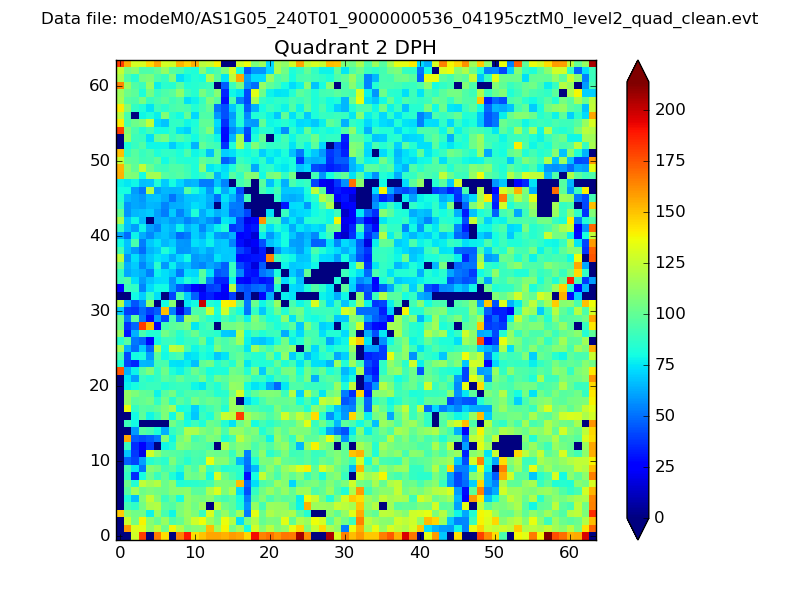
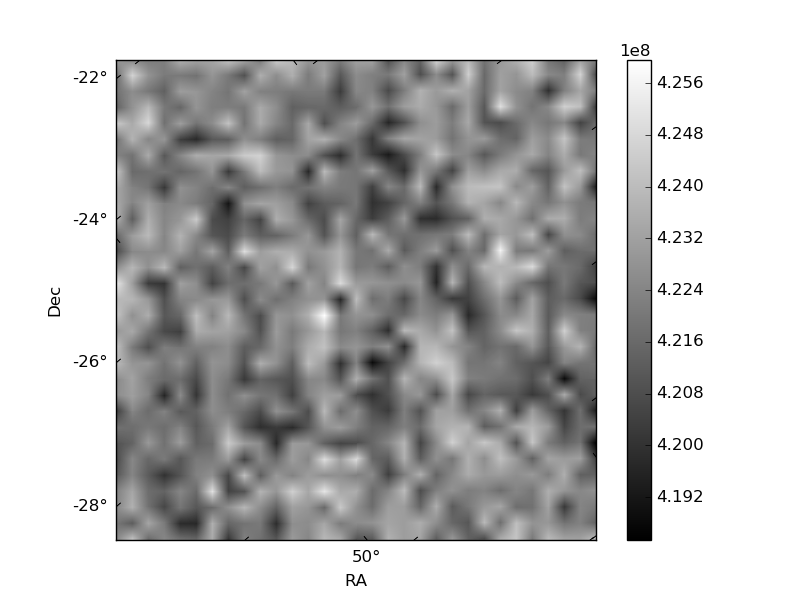
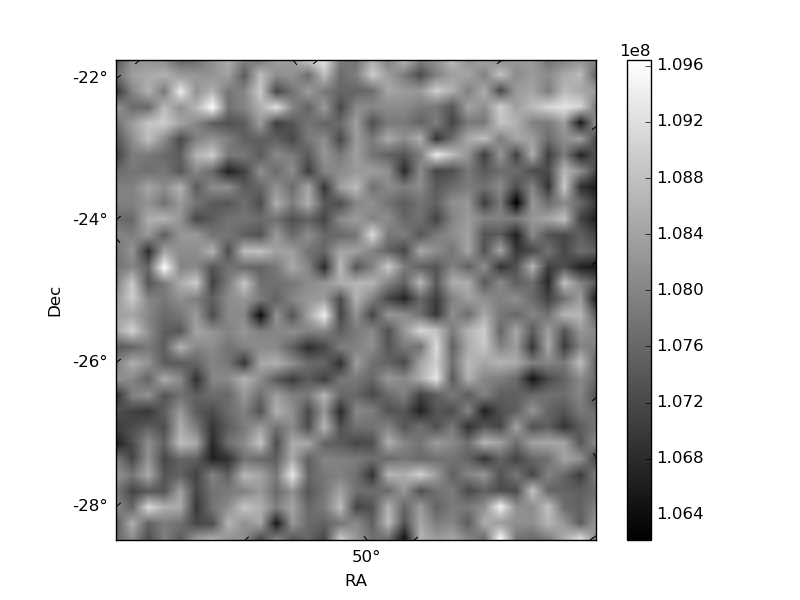
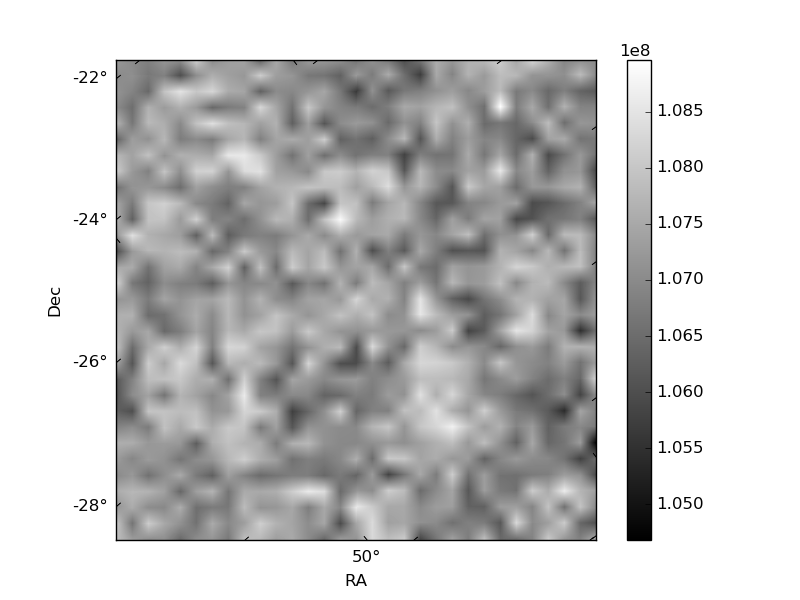
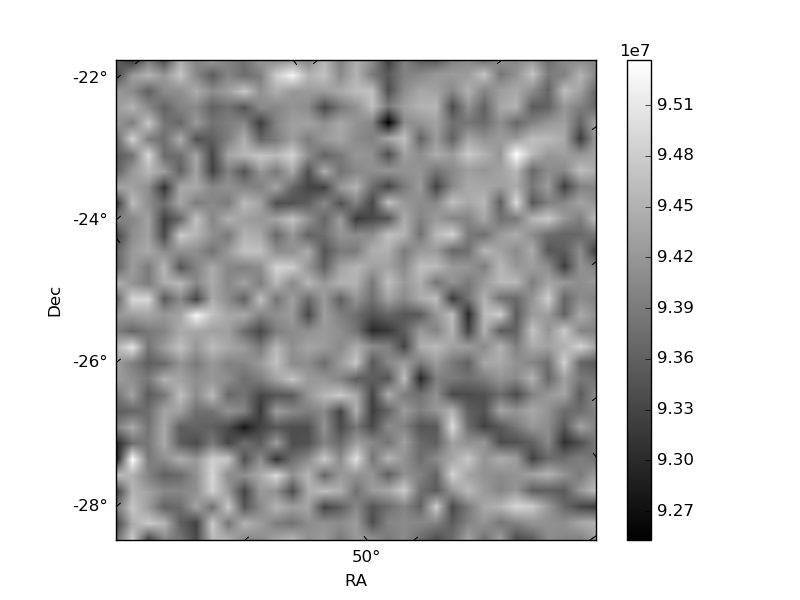
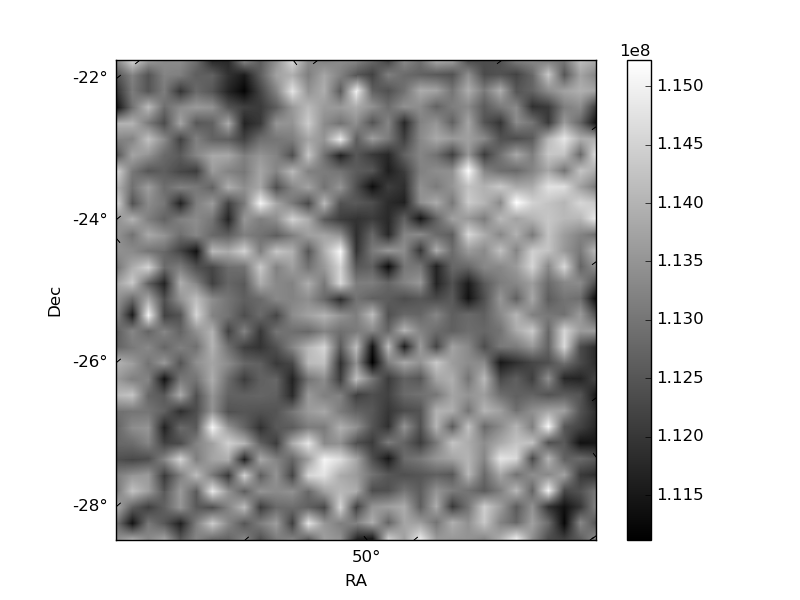
Histogram calculated using DETX and DETY for each event in the final _common_clean file
| Quadrant A | 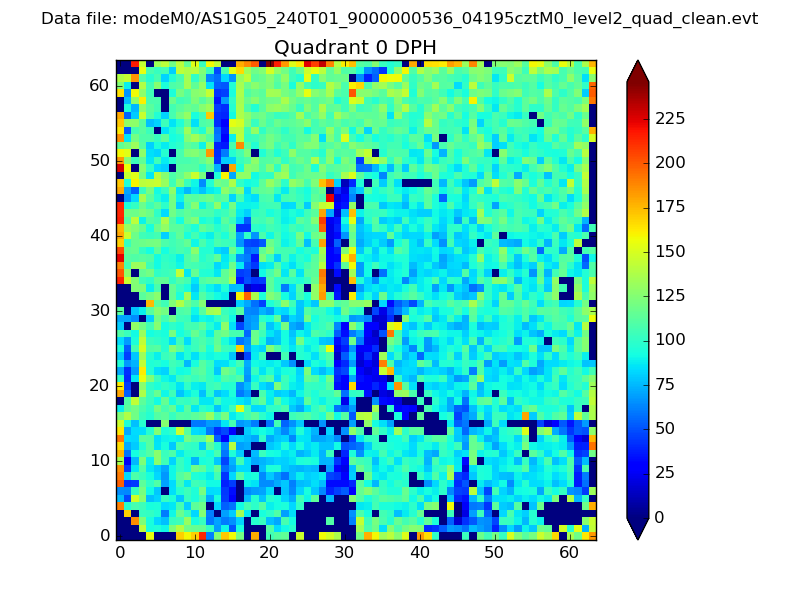 |
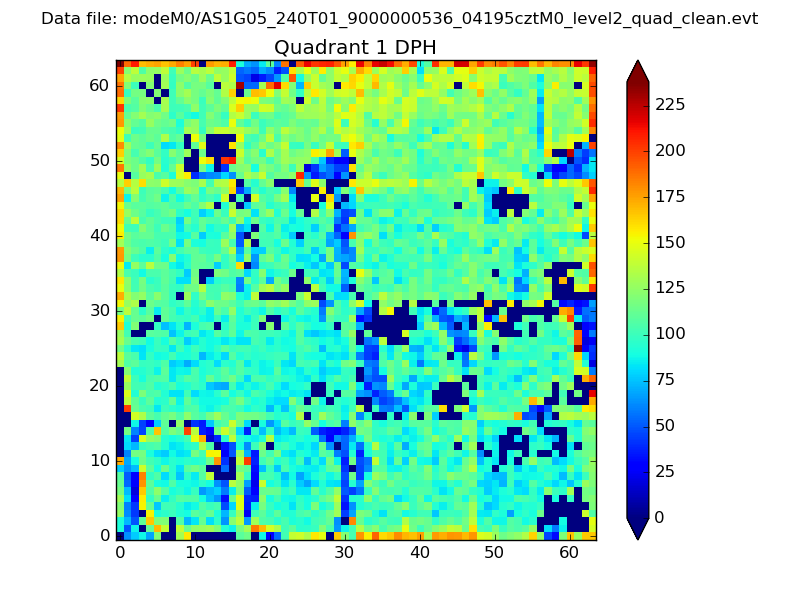 |
Quadrant B |
|---|---|---|---|
| Quadrant D | 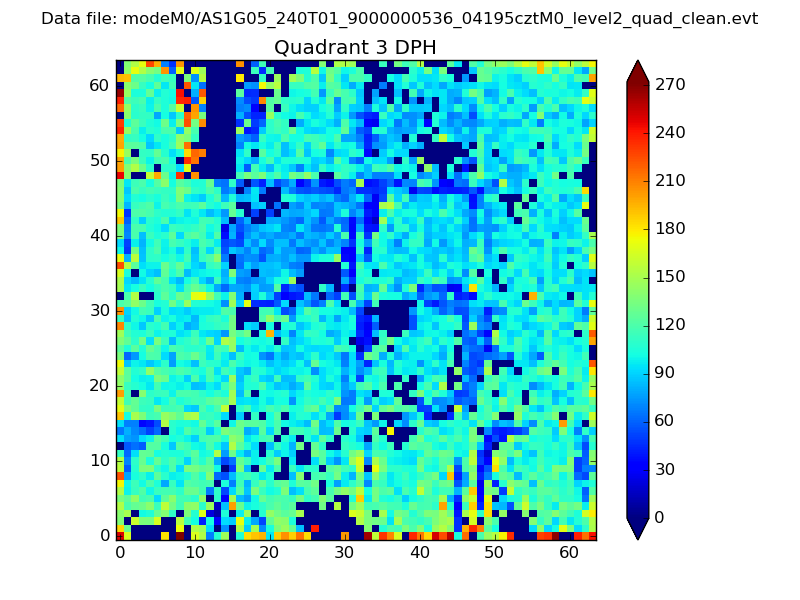 |
 |
Quadrant C |
| Plot type | Count rate plots | Images |
|---|---|---|
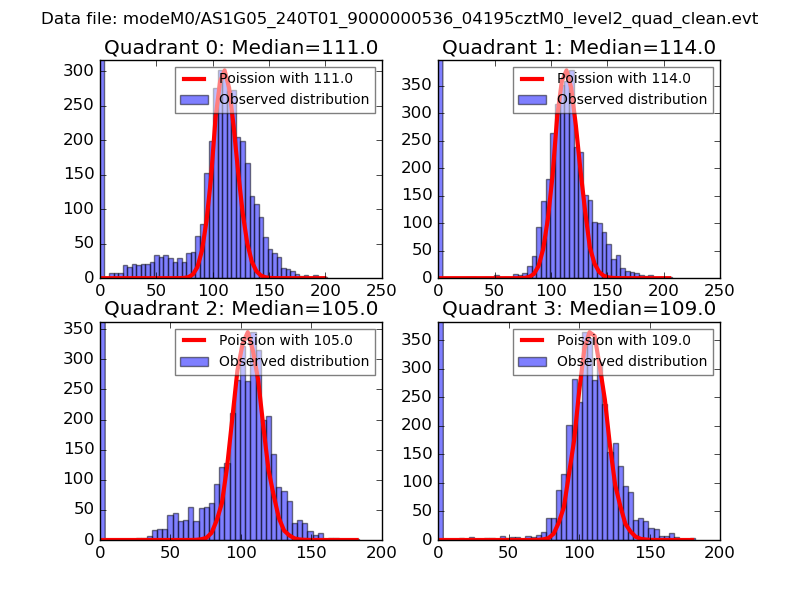
| Comparison with Poisson distribution Blue bars denote a histogram of data divided into 1 sec bins. Red curve is a Poisson curve with rate = median count rate of data. |
 |
 |
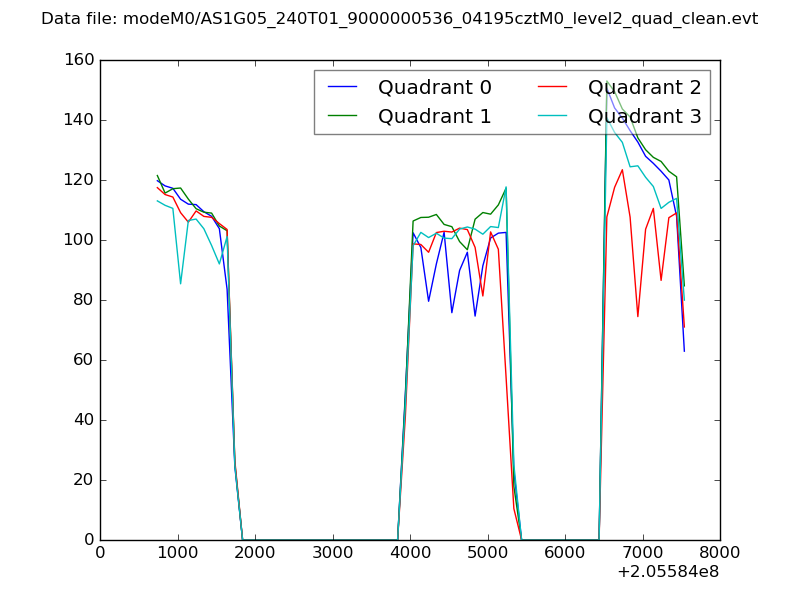
| Quadrant-wise count rates Data is divided into 100 sec bins |
 |
|
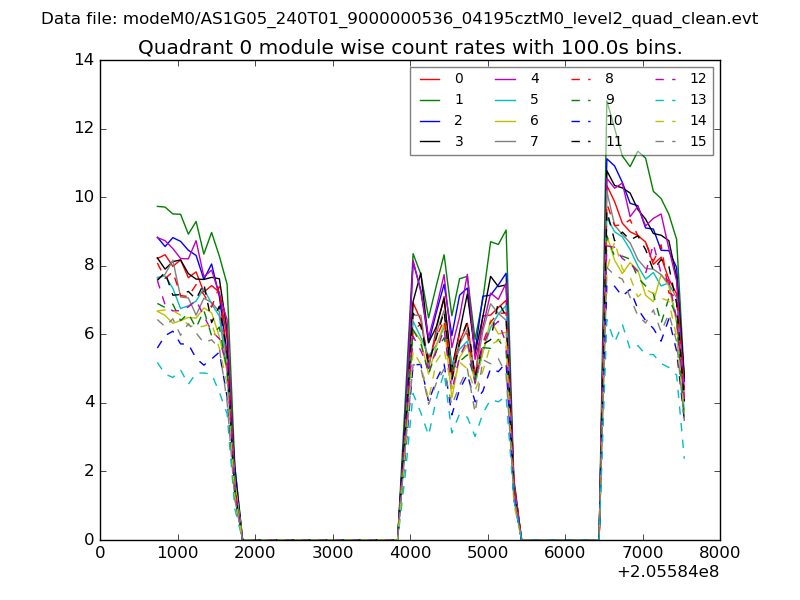
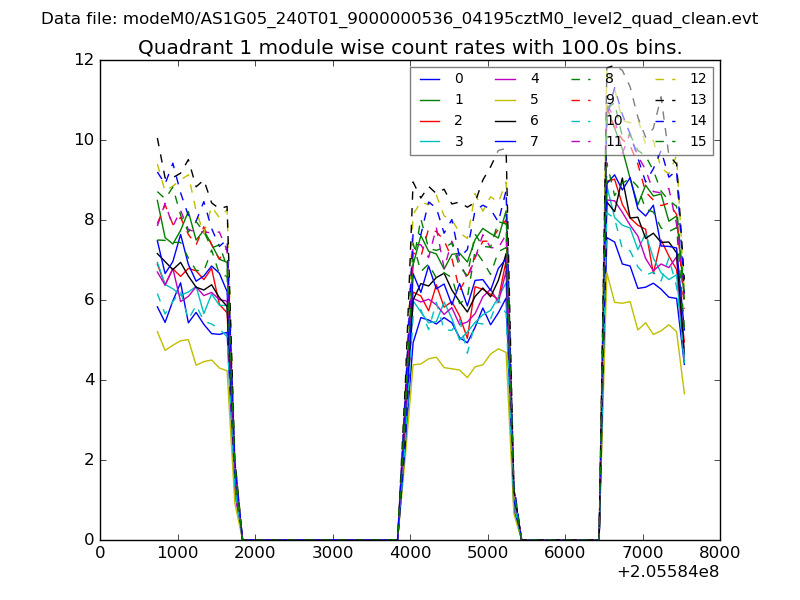
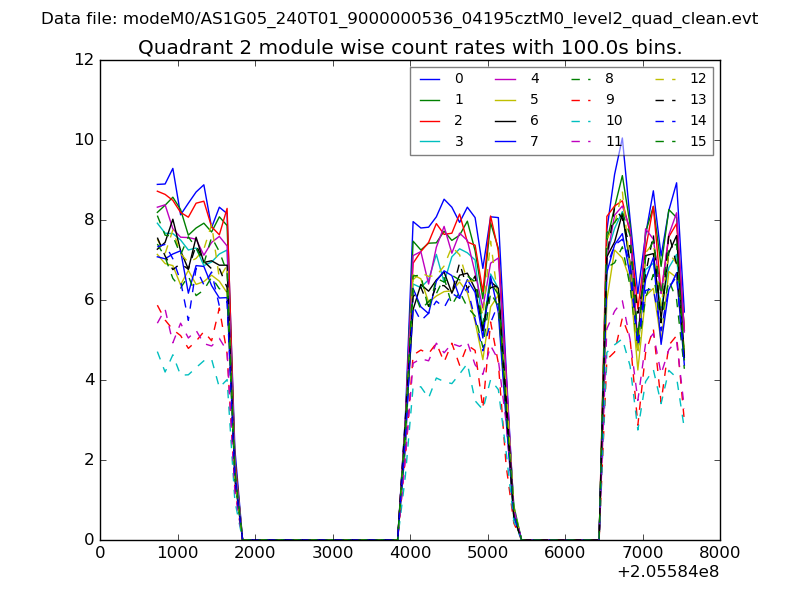
| Module-wise count rates for Quadrant A Data is divided into 100 sec bins |
 |
 |
| Module-wise count rates for Quadrant B Data is divided into 100 sec bins |
 |
 |
| Module-wise count rates for Quadrant C Data is divided into 100 sec bins |
 |
 |
| Module-wise count rates for Quadrant D Data is divided into 100 sec bins |
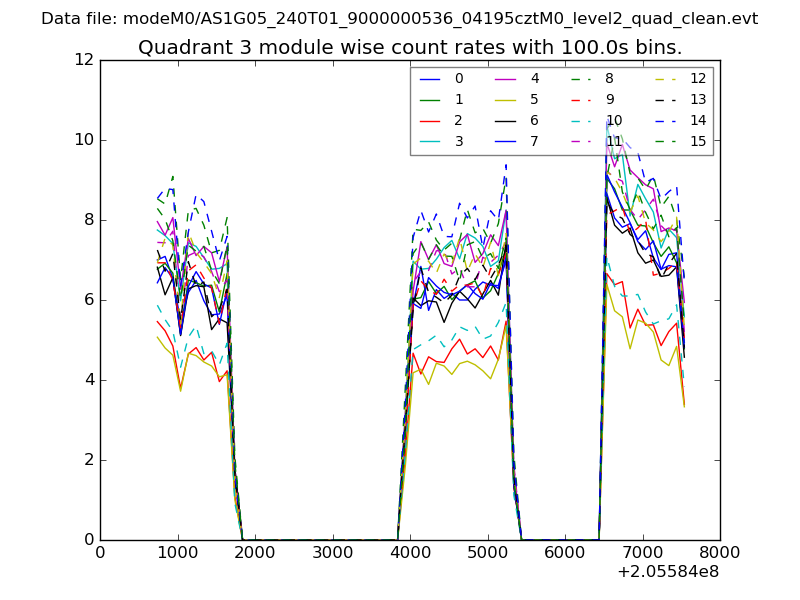 |
 |
| Parameter | Plot |
|---|---|
| CZT HV Monitor | 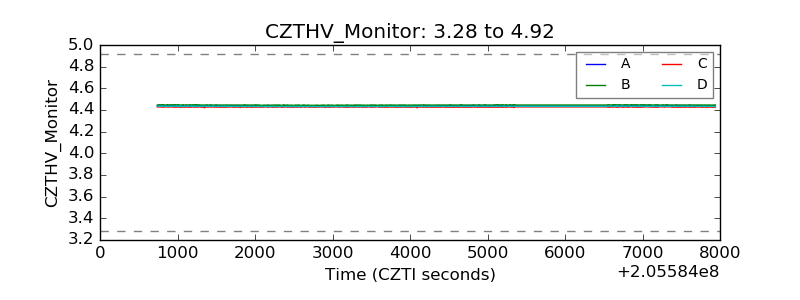 |
| D_VDD | 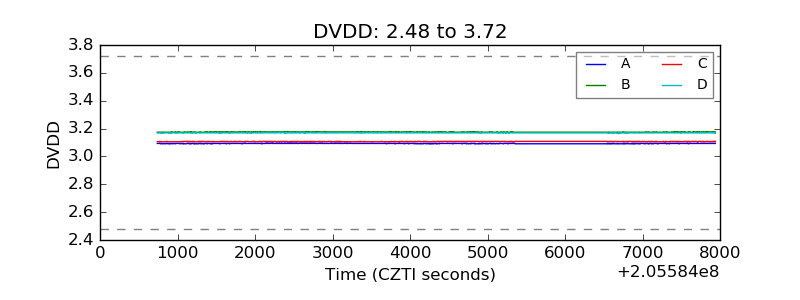 |
| Temperature 1 | 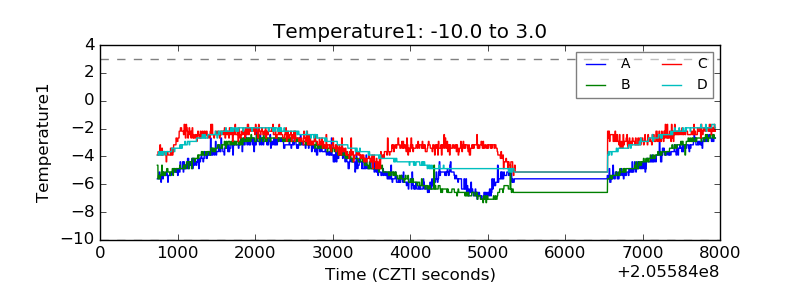 |
| Veto HV Monitor |  |
| Veto LLD | 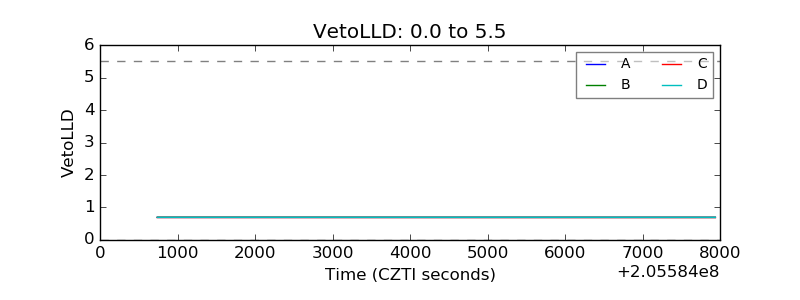 |
| Alpha Counter | 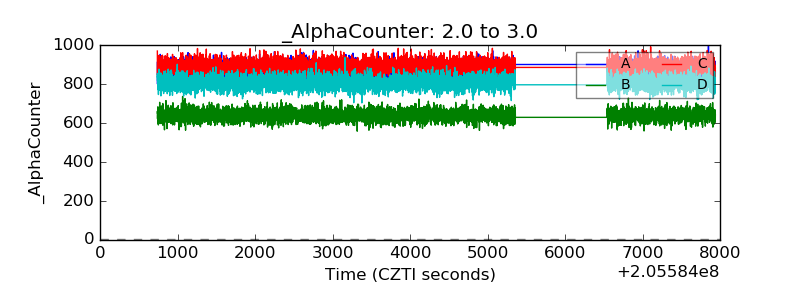 |
| _CPM_Rate | 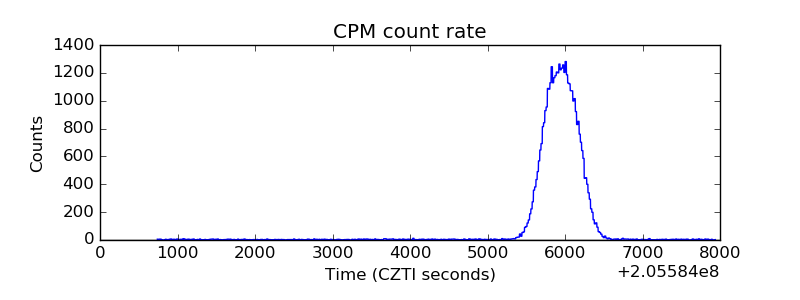 |
| CZT Counter | 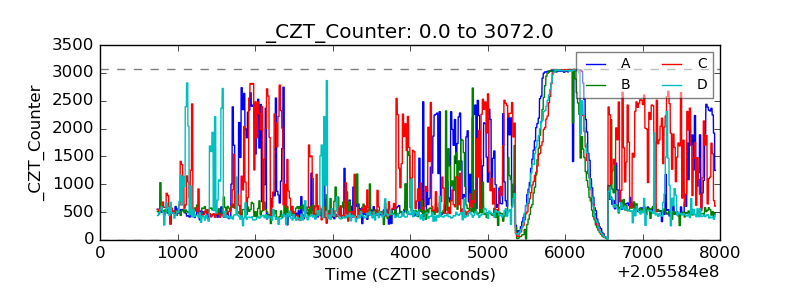 |
| +2.5 Volts monitor |  |
| +5 Volts monitor |  |
| _ROLL_ROT | 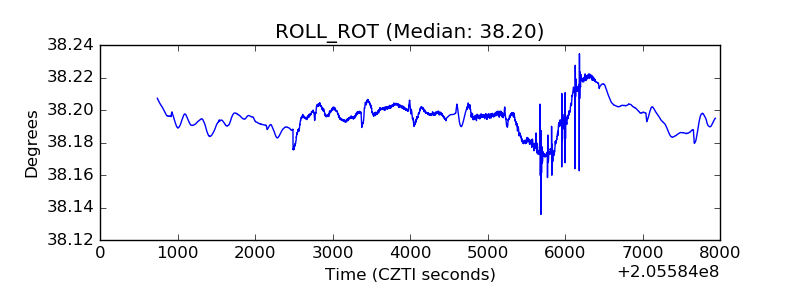 |
| _Roll_DEC | 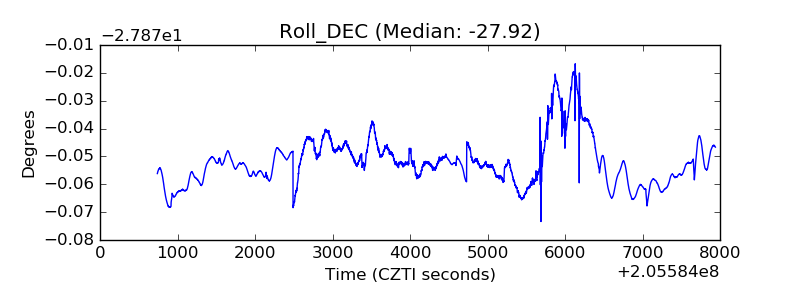 |
| _Roll_RA | 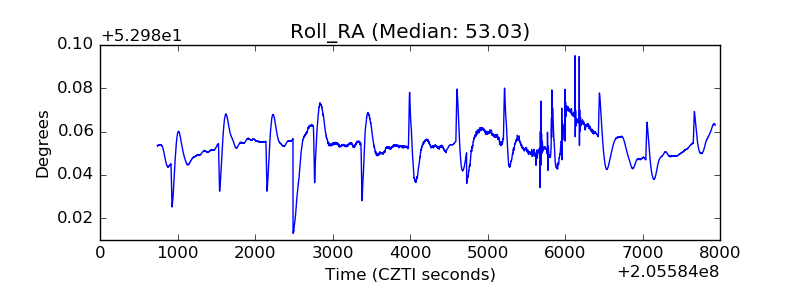 |
| Veto Counter | 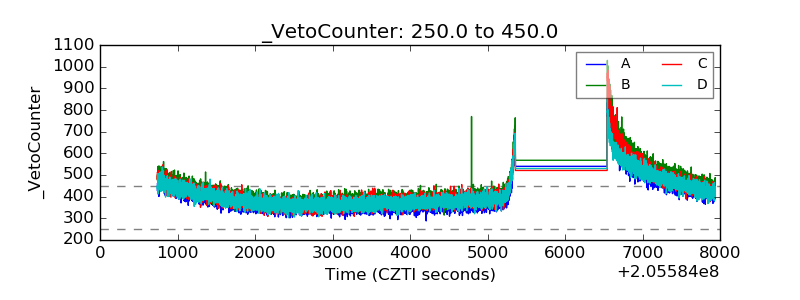 |