| Param | Original file | Final file |
|---|---|---|
| Filename | modeM0/AS1G05_240T01_9000000536_04196cztM0_level2.evt | modeM0/AS1G05_240T01_9000000536_04196cztM0_level2_quad_clean.evt |
| Size (bytes) | 670,628,160 | 64,310,400 |
| Size | 639.6 MB | 61.3 MB |
| Events in quadrant A | 6,469,653 | 349,865 |
| Events in quadrant B | 3,872,272 | 399,898 |
| Events in quadrant C | 6,358,899 | 370,359 |
| Events in quadrant D | 3,178,182 | 381,807 |
| Mode SS | |||
|---|---|---|---|
| Quadrant | BADHDUFLAG | Total packets | Discarded packets |
| A | 0 | 130 | 0 |
| B | 0 | 130 | 0 |
| C | 0 | 130 | 0 |
| D | 0 | 130 | 0 |
| Mode M9 | |||
|---|---|---|---|
| Quadrant | BADHDUFLAG | Total packets | Discarded packets |
| A | 0 | 12 | 0 |
| B | 0 | 12 | 0 |
| C | 0 | 12 | 0 |
| D | 0 | 12 | 0 |
| Mode M0 | |||
|---|---|---|---|
| Quadrant | BADHDUFLAG | Total packets | Discarded packets |
| A | 0 | 23462 | 2 |
| B | 0 | 15469 | 1 |
| C | 0 | 23139 | 1 |
| D | 0 | 13707 | 1 |
| Quadrant | Total seconds | Saturated seconds | Saturation percentage |
|---|---|---|---|
| A | 6366 | 1265 | 19.871191% |
| B | 6366 | 211 | 3.314483% |
| C | 6366 | 1080 | 16.965127% |
| D | 6366 | 69 | 1.083883% |
Noise dominated data is calculated using 1-second bins in cleaned event files. If a bin has >2000 counts, and if more than 50% of those come from <1% of pixels, then it is considered to be noise-dominated and hence unusable.
| Quadrant | # 1 sec bins | Bins with >0 counts | Bins with >2000 counts | High rate bins dominated by noise | Noise dominated (total time) | Noise dominated (detector-on time) | Marked lightcurve |
|---|---|---|---|---|---|---|---|
| A | 7606 | 6366 | 819 | 819 | 10.77% | 12.87% | 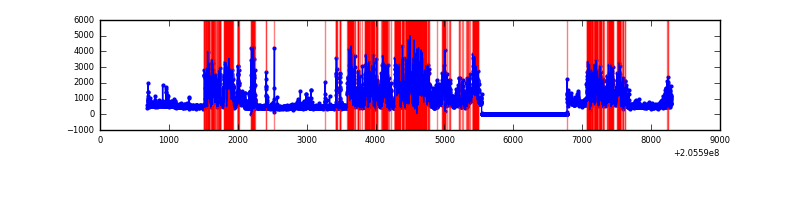 |
| B | 7606 | 6367 | 112 | 112 | 1.47% | 1.76% | 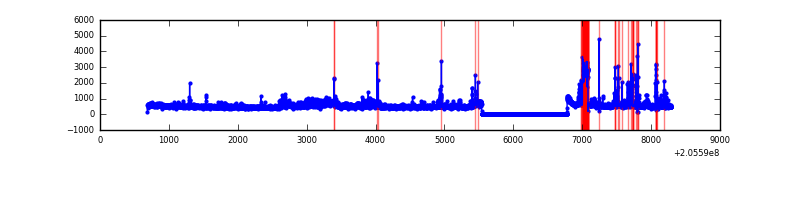 |
| C | 7606 | 6367 | 1057 | 1057 | 13.90% | 16.60% | 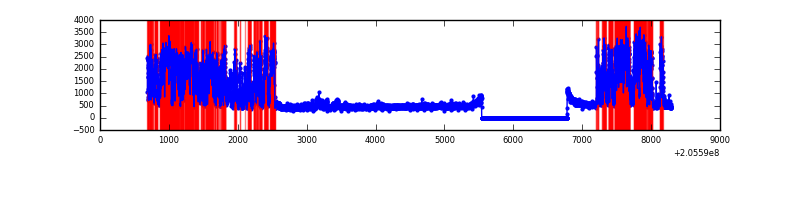 |
| D | 7606 | 6367 | 20 | 20 | 0.26% | 0.31% | 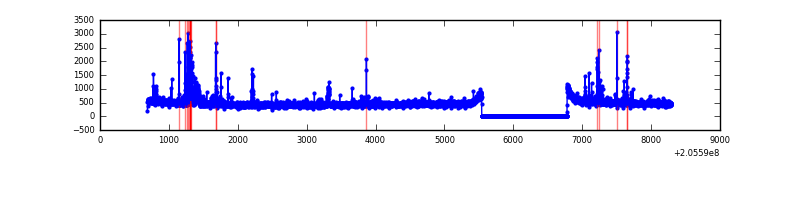 |
Top three noisy pixels from each quadrant. If the there are fewer than three noisy pixels in the level2.evt file, extra rows are filled as -1
| Pixel properties | Quadrant properties | ||||||
|---|---|---|---|---|---|---|---|
| Quadrant | DetID | PixID | Counts | Sigma | Mean | Median | Sigma |
| A | 0 | 50 | 2608005 | 17425.35 | 740 | 725 | 149.6 |
| A | 12 | 247 | 484341 | 3232.17 | 740 | 725 | 149.6 |
| A | 0 | 199 | 250727 | 1670.85 | 740 | 725 | 149.6 |
| B | 3 | 0 | 602035 | 3950.61 | 800 | 783 | 152.2 |
| B | 14 | 167 | 60046 | 389.4 | 800 | 783 | 152.2 |
| B | 10 | 16 | 59235 | 384.07 | 800 | 783 | 152.2 |
| C | 9 | 144 | 3503811 | 20854.6 | 726 | 730 | 168.0 |
| C | 14 | 67 | 16094 | 91.47 | 726 | 730 | 168.0 |
| C | 13 | 61 | 5871 | 30.61 | 726 | 730 | 168.0 |
| D | 13 | 239 | 72498 | 383.31 | 776 | 756 | 187.2 |
| D | 10 | 172 | 42096 | 220.87 | 776 | 756 | 187.2 |
| D | 13 | 61 | 32630 | 170.3 | 776 | 756 | 187.2 |
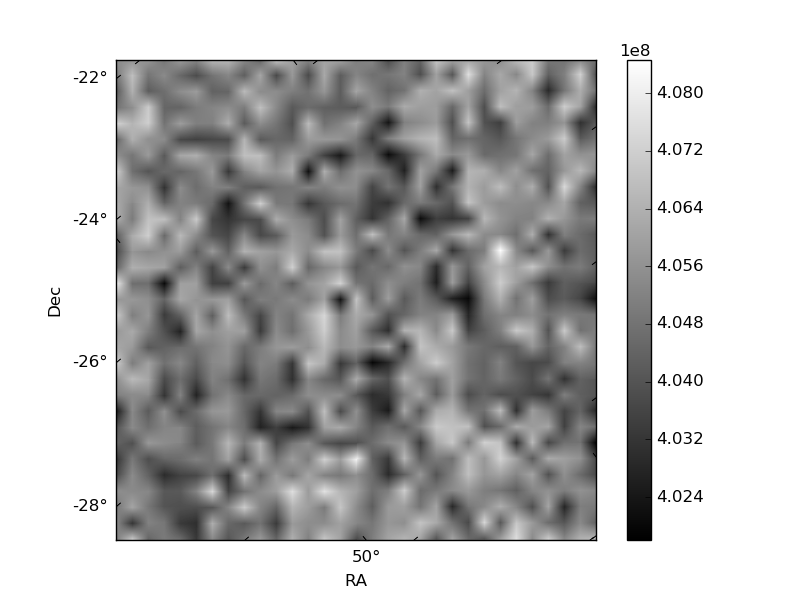
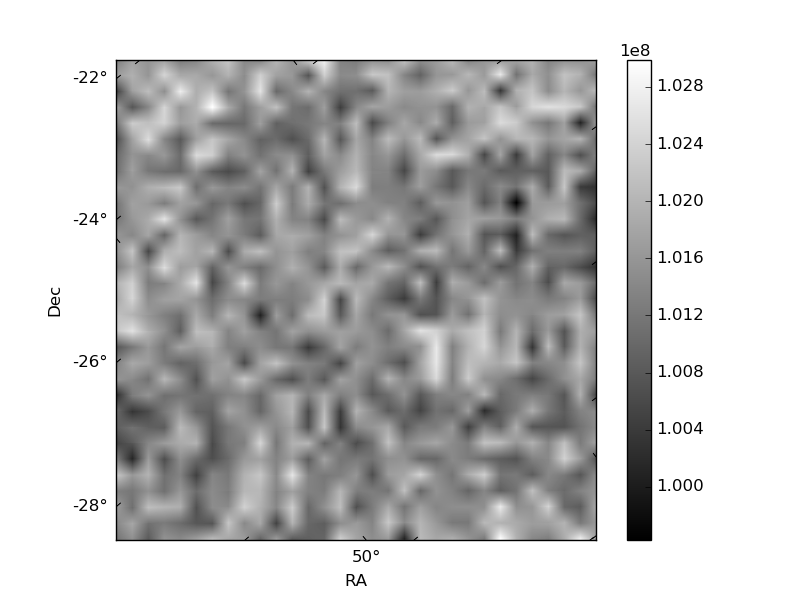
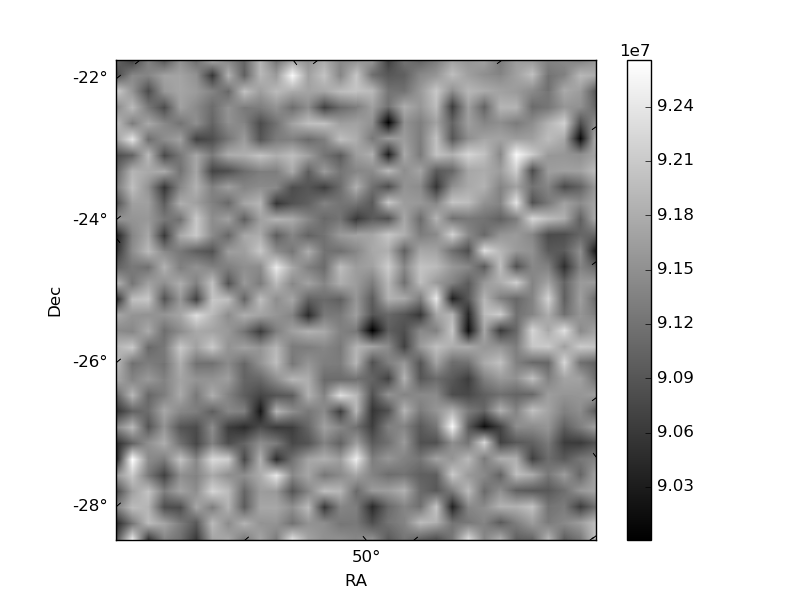
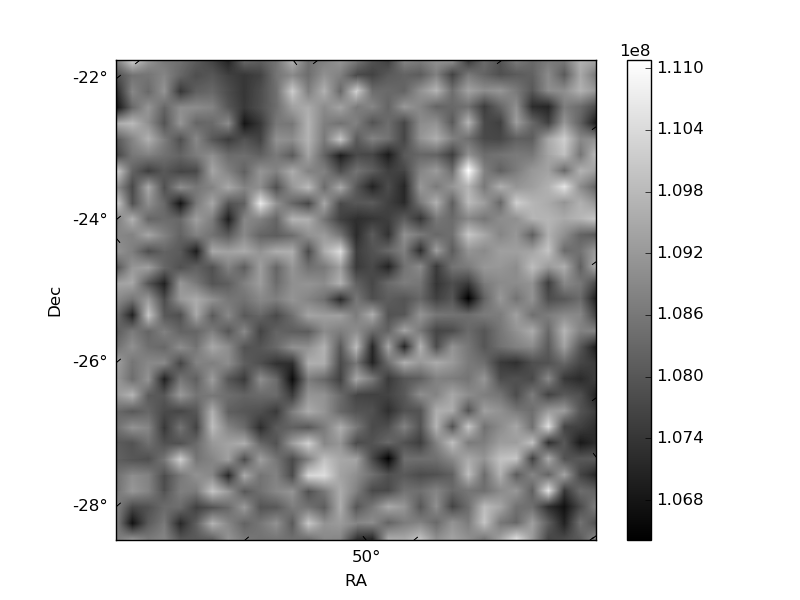
Histogram calculated using DETX and DETY for each event in the final _common_clean file
| Quadrant A | 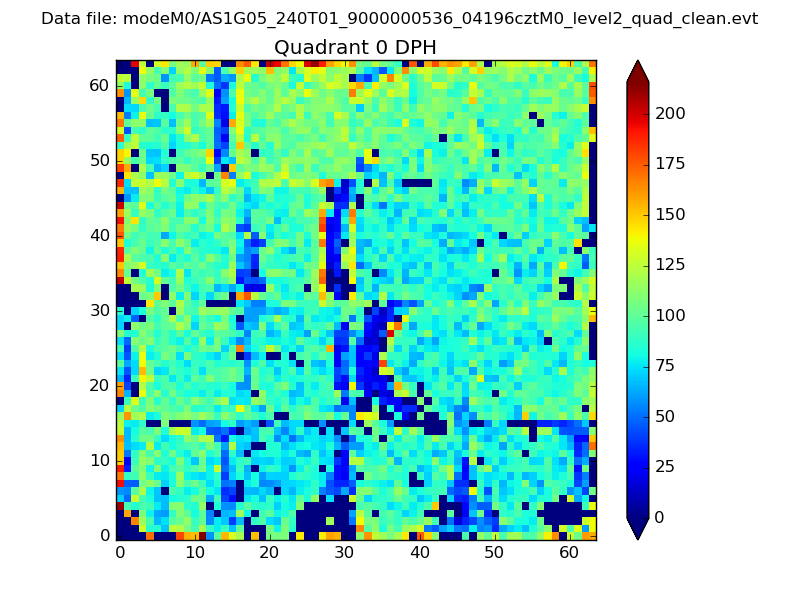 |
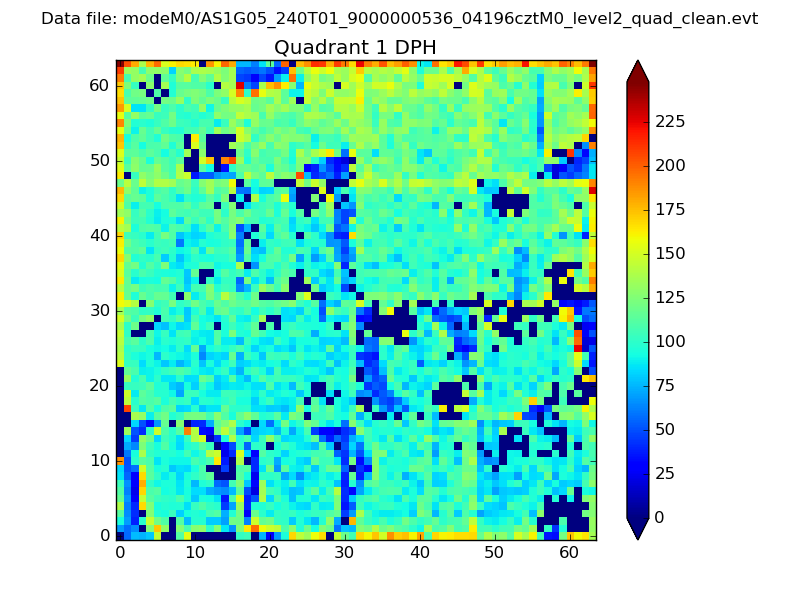 |
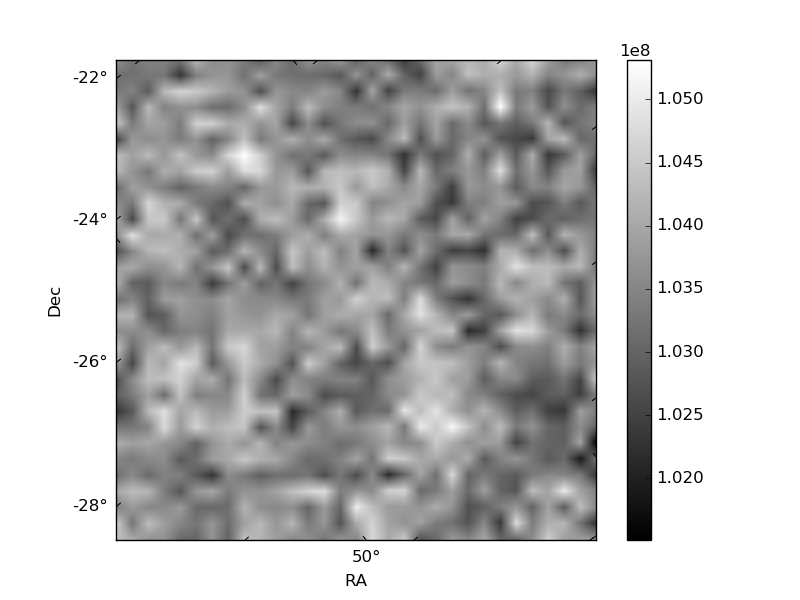
Quadrant B |
|---|---|---|---|
| Quadrant D | 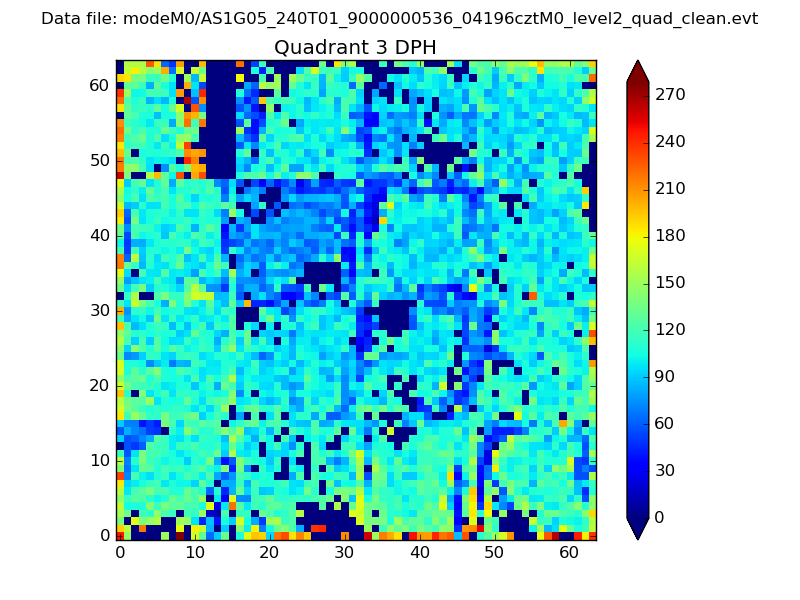 |
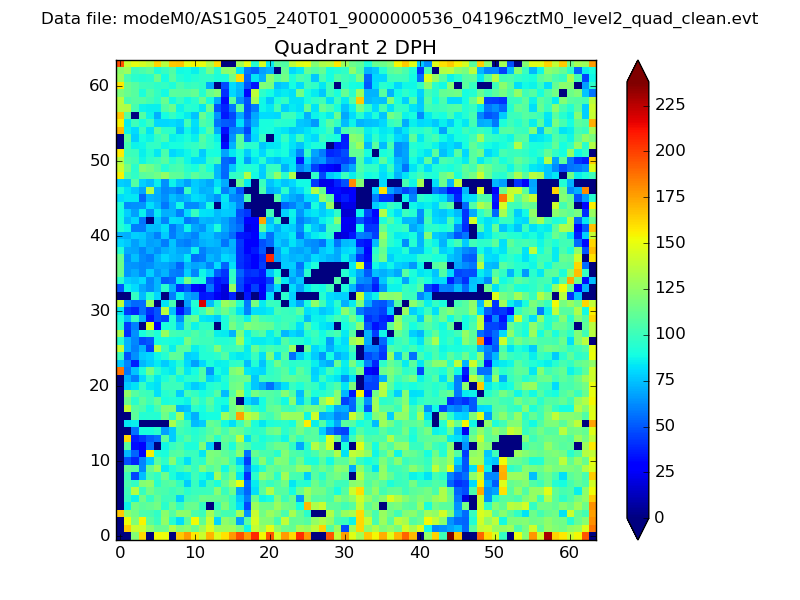 |
Quadrant C |
| Plot type | Count rate plots | Images |
|---|---|---|
| Comparison with Poisson distribution Blue bars denote a histogram of data divided into 1 sec bins. Red curve is a Poisson curve with rate = median count rate of data. |
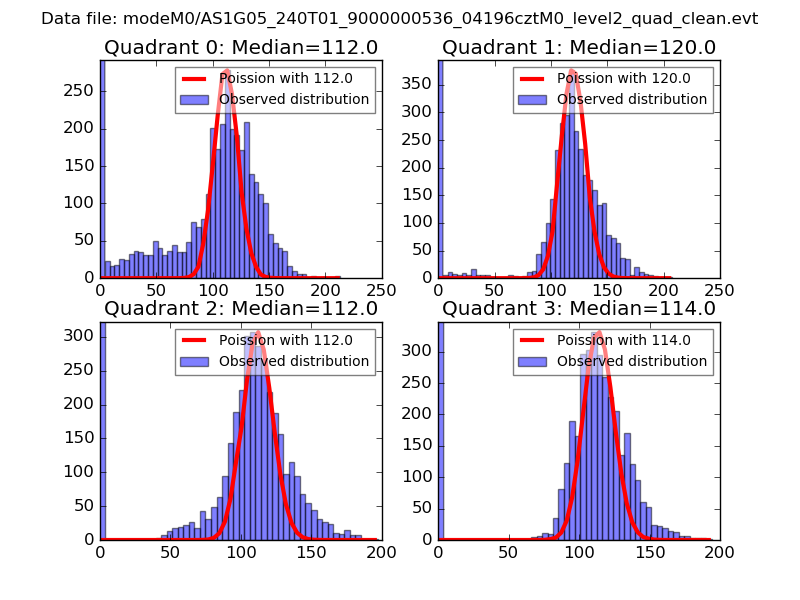 |
 |
| Quadrant-wise count rates Data is divided into 100 sec bins |
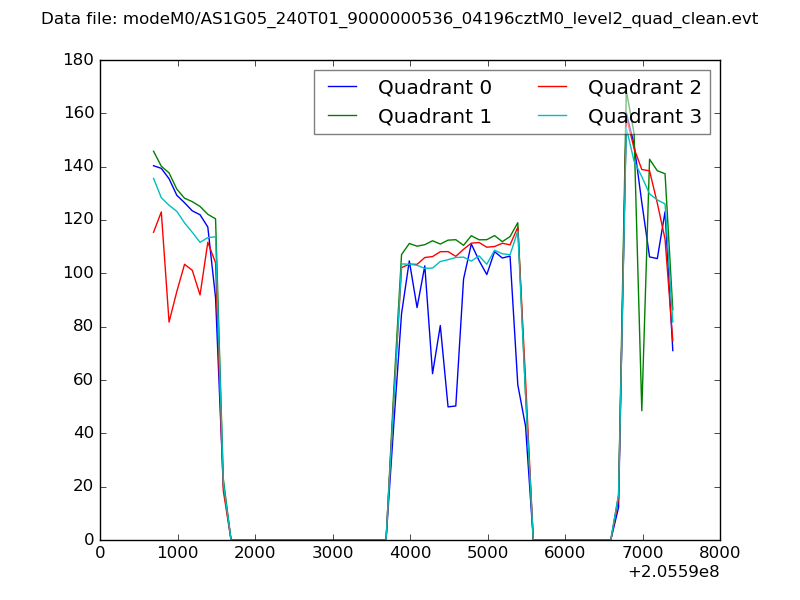 |
|
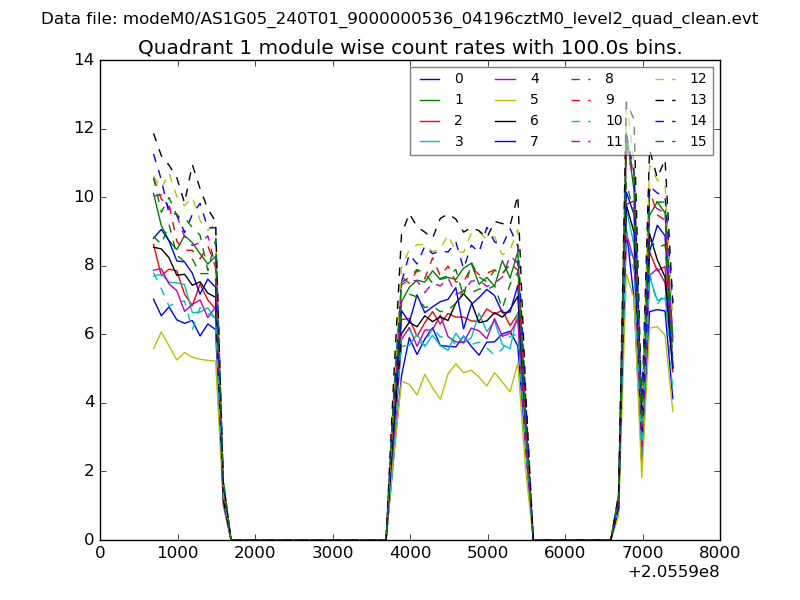
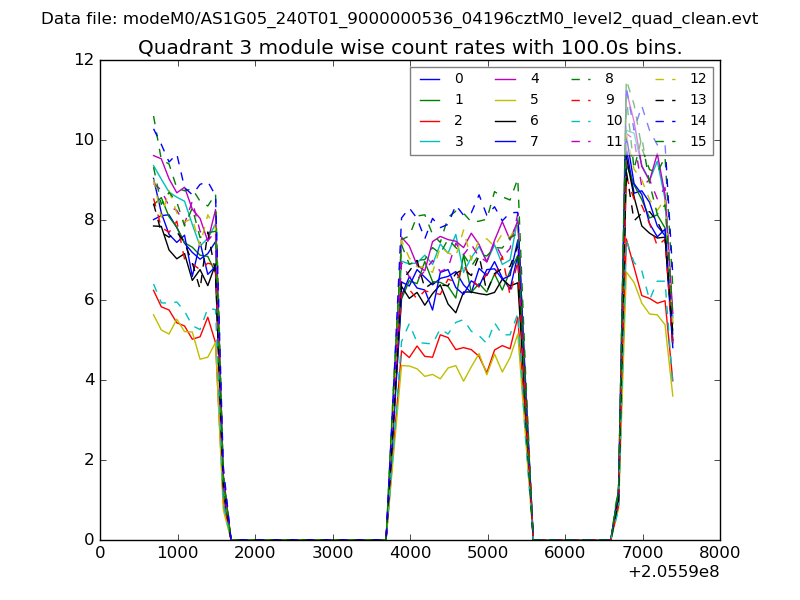
| Module-wise count rates for Quadrant A Data is divided into 100 sec bins |
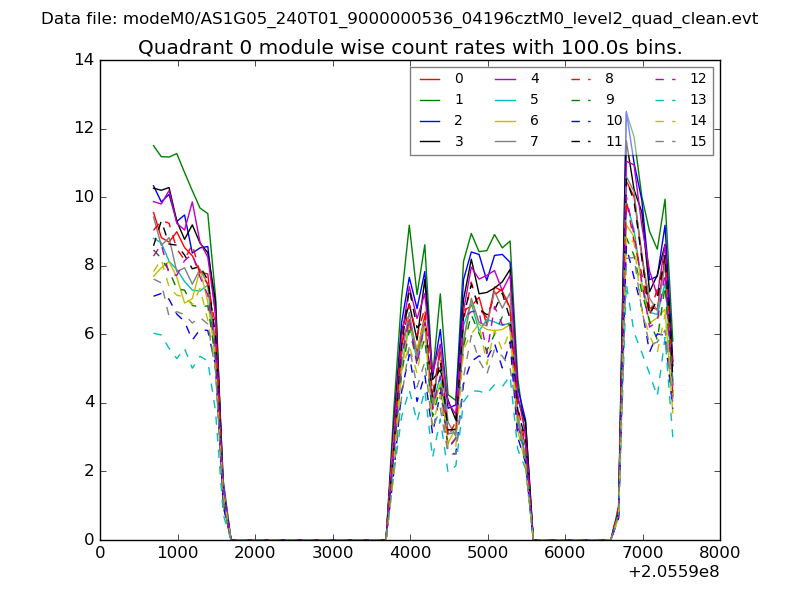 |
 |
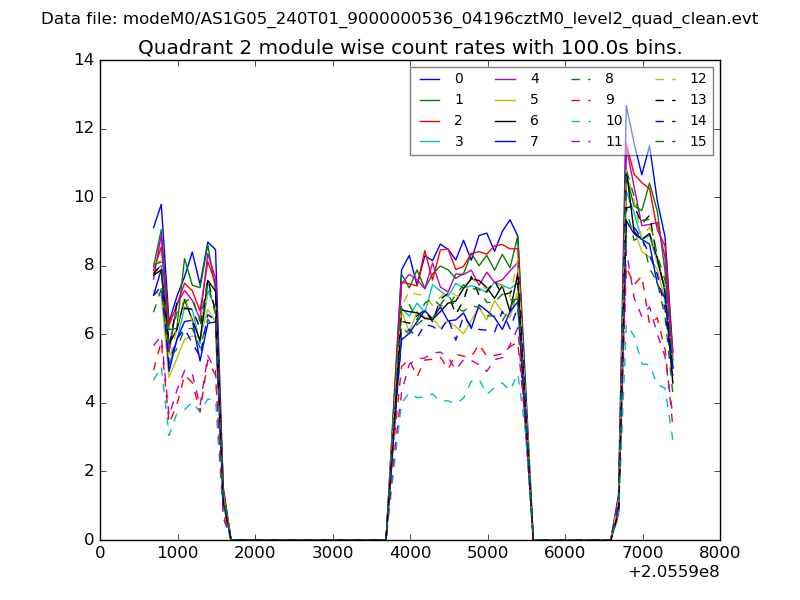
| Module-wise count rates for Quadrant B Data is divided into 100 sec bins |
 |
 |
| Module-wise count rates for Quadrant C Data is divided into 100 sec bins |
 |
 |
| Module-wise count rates for Quadrant D Data is divided into 100 sec bins |
 |
 |
| Parameter | Plot |
|---|---|
| CZT HV Monitor | 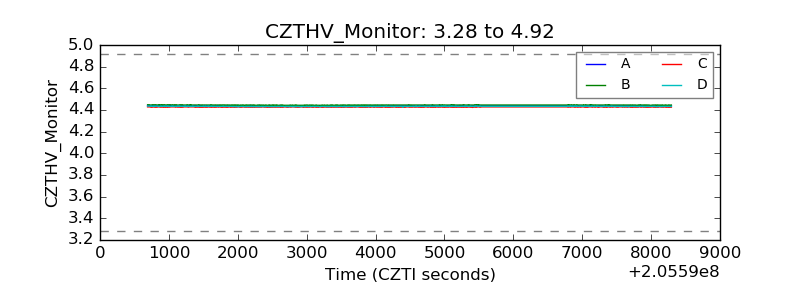 |
| D_VDD | 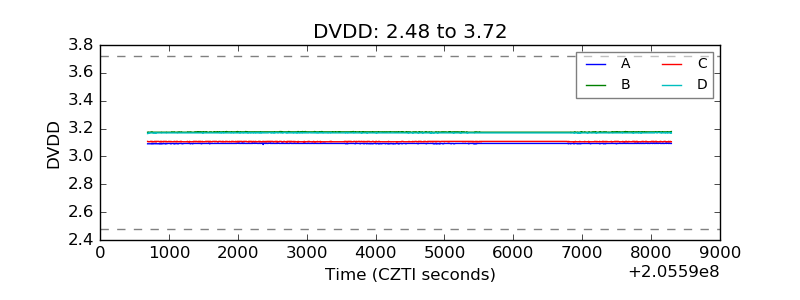 |
| Temperature 1 | 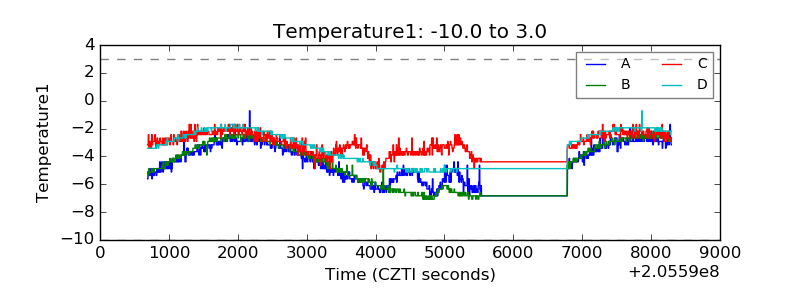 |
| Veto HV Monitor | 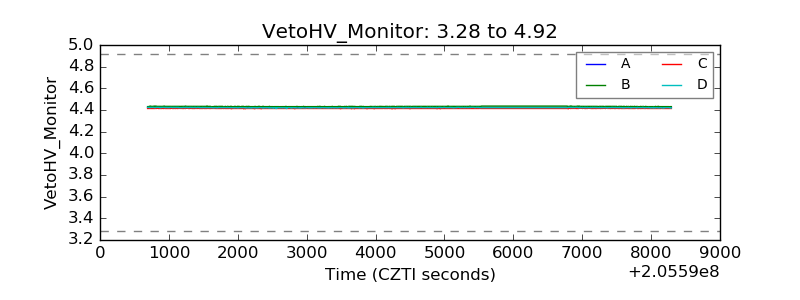 |
| Veto LLD | 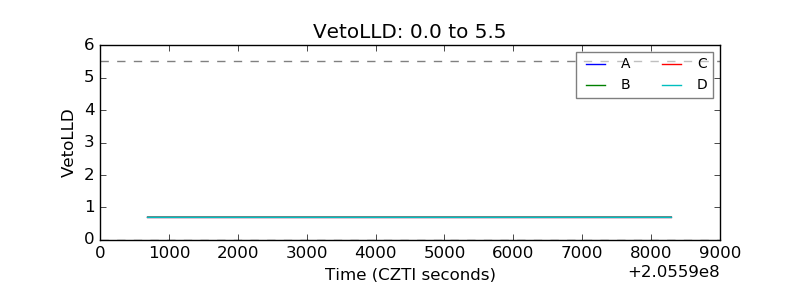 |
| Alpha Counter | 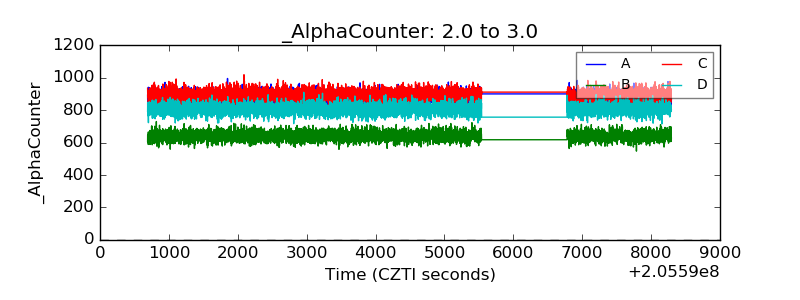 |
| _CPM_Rate | 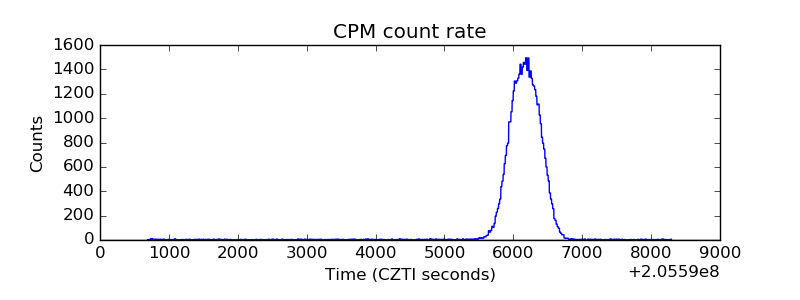 |
| CZT Counter | 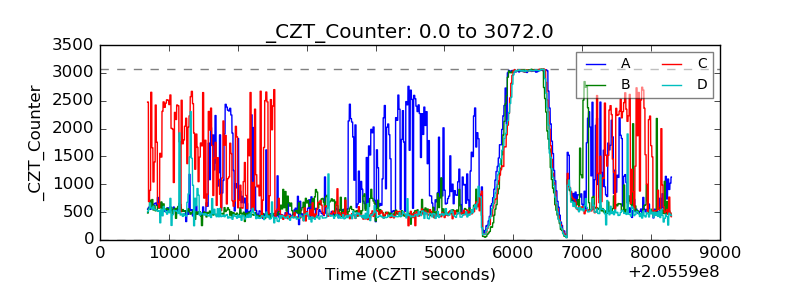 |
| +2.5 Volts monitor |  |
| +5 Volts monitor |  |
| _ROLL_ROT | 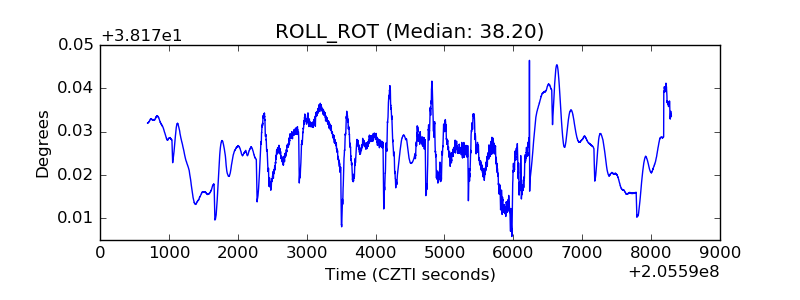 |
| _Roll_DEC | 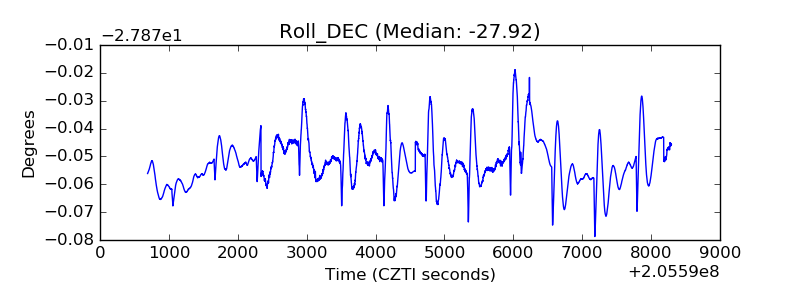 |
| _Roll_RA | 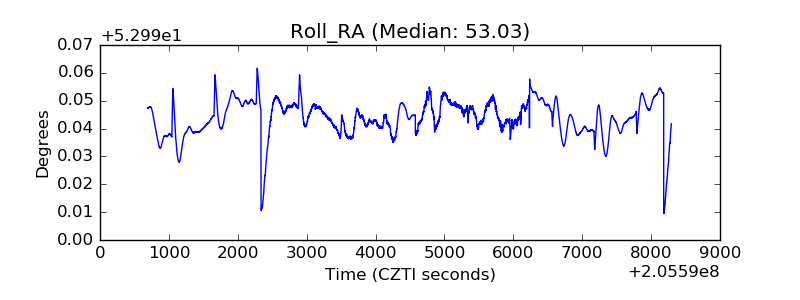 |
| Veto Counter |  |