| Param | Original file | Final file |
|---|---|---|
| Filename | modeM0/AS1G05_240T01_9000000536_04197cztM0_level2.evt | modeM0/AS1G05_240T01_9000000536_04197cztM0_level2_quad_clean.evt |
| Size (bytes) | 597,867,840 | 48,548,160 |
| Size | 570.2 MB | 46.3 MB |
| Events in quadrant A | 6,337,546 | 244,080 |
| Events in quadrant B | 3,486,226 | 288,398 |
| Events in quadrant C | 5,039,564 | 255,617 |
| Events in quadrant D | 2,845,107 | 270,560 |
| Mode SS | |||
|---|---|---|---|
| Quadrant | BADHDUFLAG | Total packets | Discarded packets |
| A | 0 | 120 | 0 |
| B | 0 | 120 | 0 |
| C | 0 | 120 | 0 |
| D | 0 | 120 | 0 |
| Mode M9 | |||
|---|---|---|---|
| Quadrant | BADHDUFLAG | Total packets | Discarded packets |
| A | 0 | 13 | 0 |
| B | 0 | 13 | 0 |
| C | 0 | 13 | 0 |
| D | 0 | 13 | 0 |
| Mode M0 | |||
|---|---|---|---|
| Quadrant | BADHDUFLAG | Total packets | Discarded packets |
| A | 0 | 22661 | 2 |
| B | 0 | 14005 | 1 |
| C | 0 | 18793 | 1 |
| D | 0 | 12317 | 1 |
| Quadrant | Total seconds | Saturated seconds | Saturation percentage |
|---|---|---|---|
| A | 5870 | 1445 | 24.616695% |
| B | 5870 | 207 | 3.526405% |
| C | 5870 | 809 | 13.781942% |
| D | 5870 | 85 | 1.448041% |
Noise dominated data is calculated using 1-second bins in cleaned event files. If a bin has >2000 counts, and if more than 50% of those come from <1% of pixels, then it is considered to be noise-dominated and hence unusable.
| Quadrant | # 1 sec bins | Bins with >0 counts | Bins with >2000 counts | High rate bins dominated by noise | Noise dominated (total time) | Noise dominated (detector-on time) | Marked lightcurve |
|---|---|---|---|---|---|---|---|
| A | 7145 | 5870 | 944 | 944 | 13.21% | 16.08% | 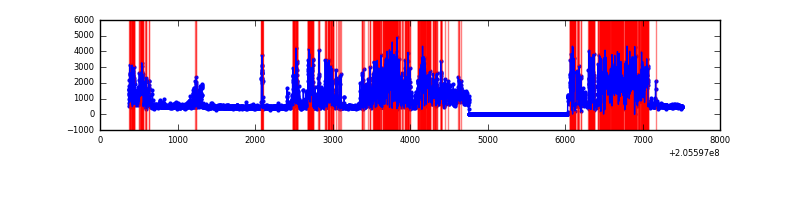 |
| B | 7145 | 5871 | 66 | 66 | 0.92% | 1.12% | 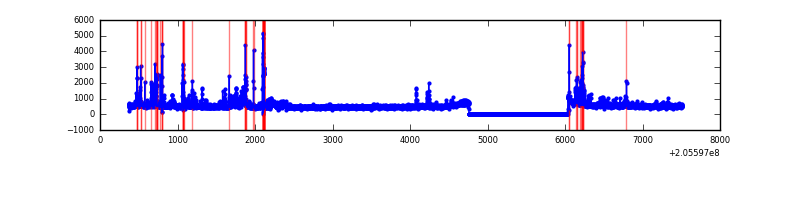 |
| C | 7145 | 5871 | 657 | 657 | 9.20% | 11.19% | 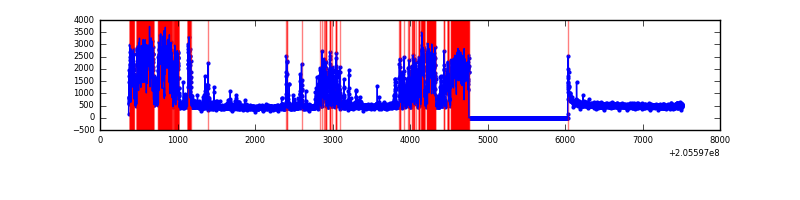 |
| D | 7145 | 5871 | 6 | 6 | 0.08% | 0.10% | 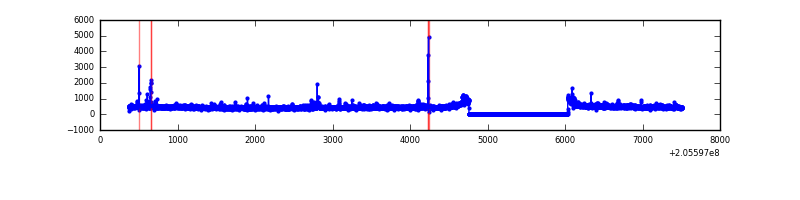 |
Top three noisy pixels from each quadrant. If the there are fewer than three noisy pixels in the level2.evt file, extra rows are filled as -1
| Pixel properties | Quadrant properties | ||||||
|---|---|---|---|---|---|---|---|
| Quadrant | DetID | PixID | Counts | Sigma | Mean | Median | Sigma |
| A | 0 | 50 | 2028182 | 15428.3 | 650 | 637 | 131.4 |
| A | 12 | 247 | 1485908 | 11301.95 | 650 | 637 | 131.4 |
| A | 15 | 234 | 214068 | 1624.07 | 650 | 637 | 131.4 |
| B | 3 | 0 | 373799 | 2619.82 | 749 | 732 | 142.4 |
| B | 10 | 16 | 109047 | 760.63 | 749 | 732 | 142.4 |
| B | 14 | 167 | 68082 | 472.96 | 749 | 732 | 142.4 |
| C | 9 | 144 | 2397794 | 15424.5 | 671 | 674 | 155.4 |
| C | 14 | 67 | 14665 | 90.03 | 671 | 674 | 155.4 |
| C | 10 | 65 | 6511 | 37.56 | 671 | 674 | 155.4 |
| D | 1 | 20 | 35858 | 205.12 | 716 | 695 | 171.4 |
| D | 13 | 239 | 30029 | 171.12 | 716 | 695 | 171.4 |
| D | 10 | 172 | 22573 | 127.62 | 716 | 695 | 171.4 |
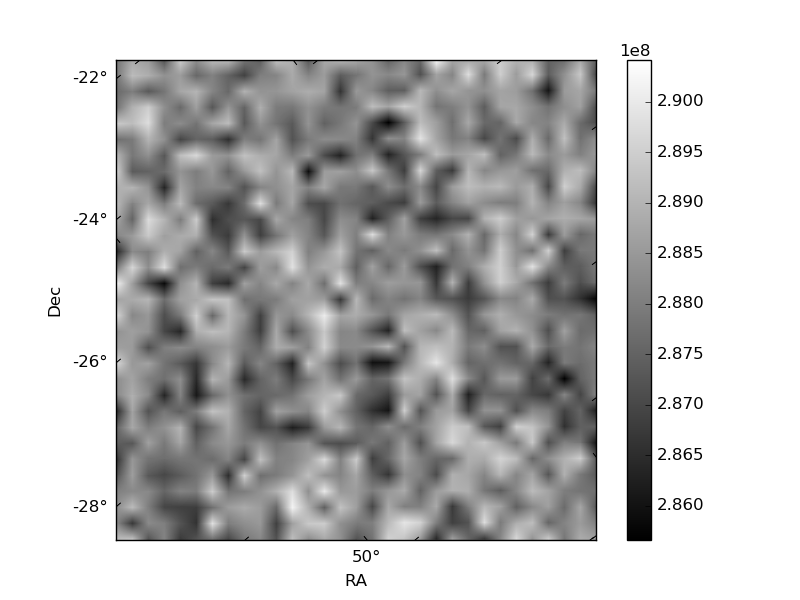
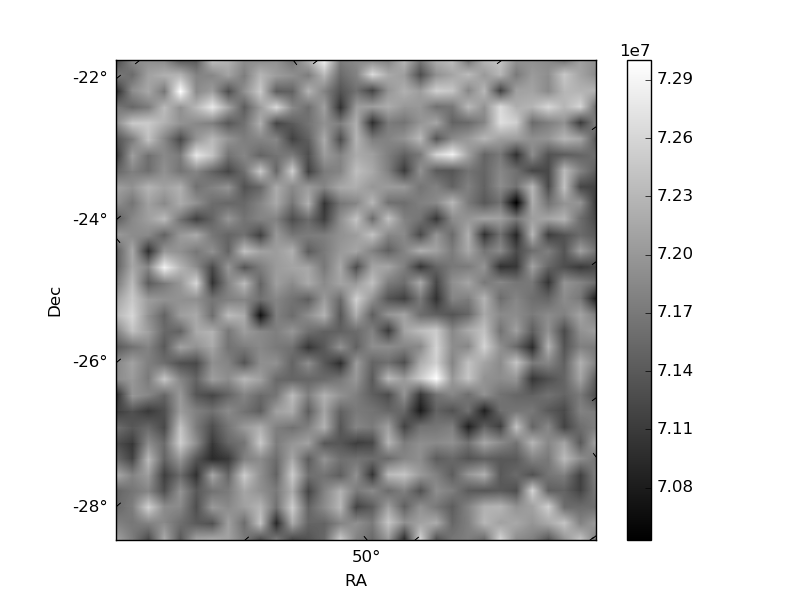
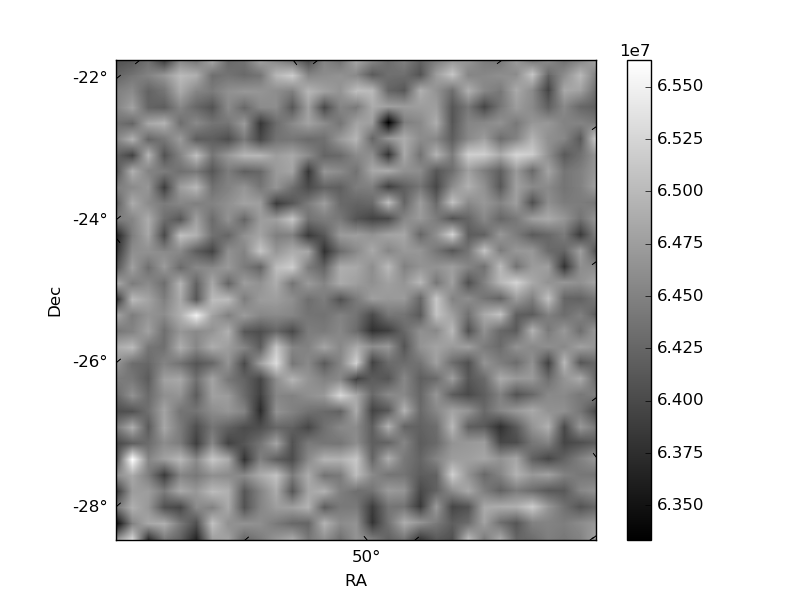
Histogram calculated using DETX and DETY for each event in the final _common_clean file
| Quadrant A | 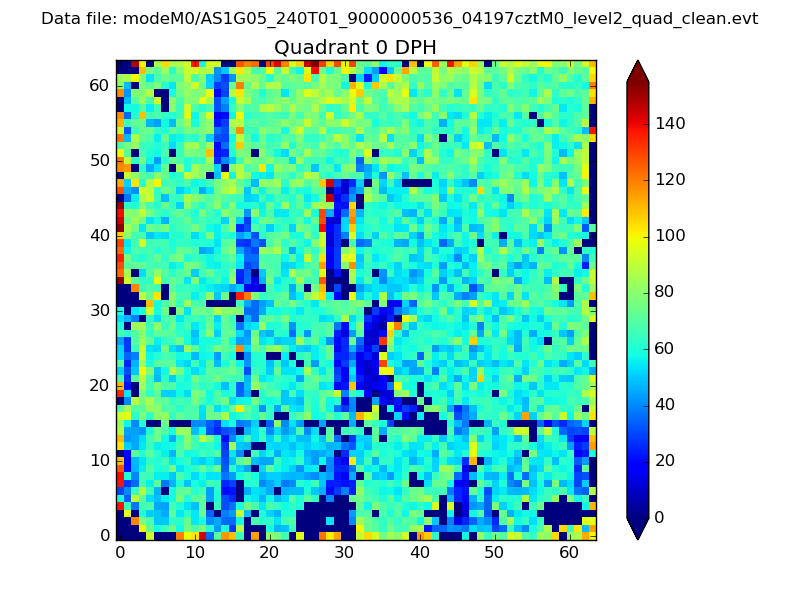 |
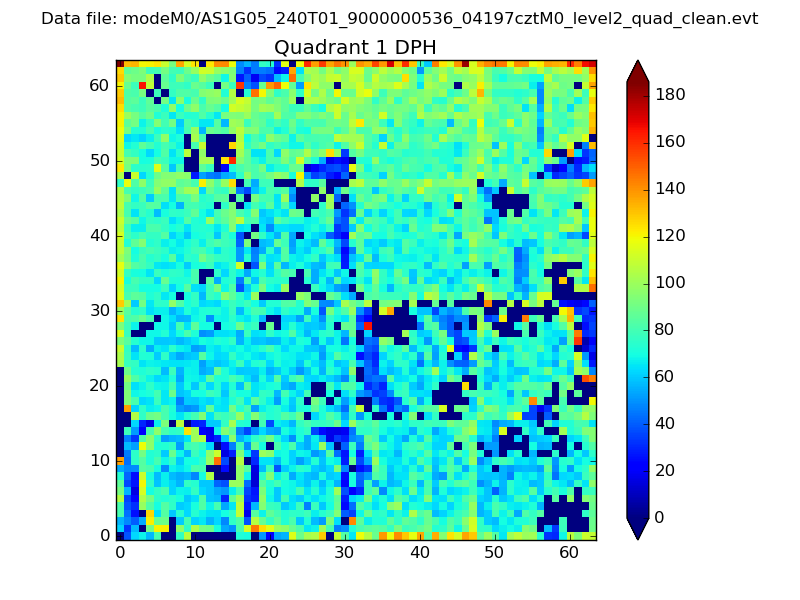 |
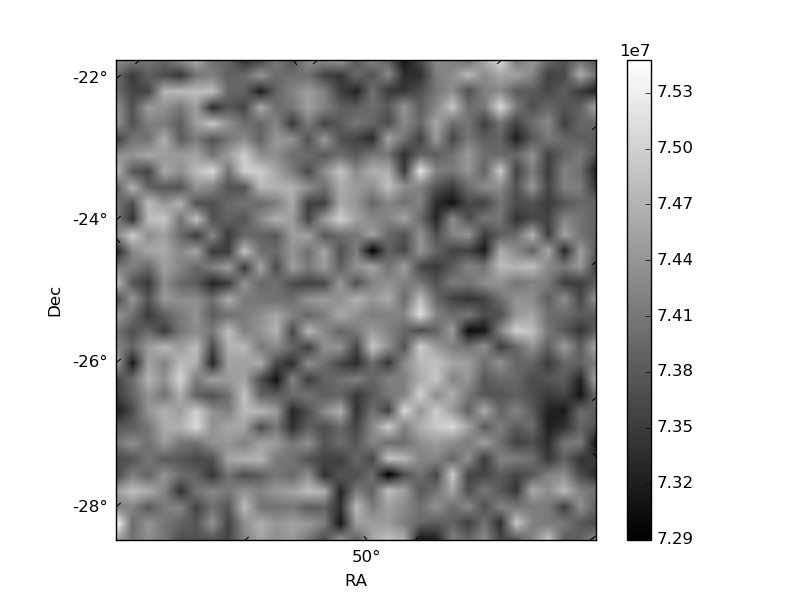
Quadrant B |
|---|---|---|---|
| Quadrant D | 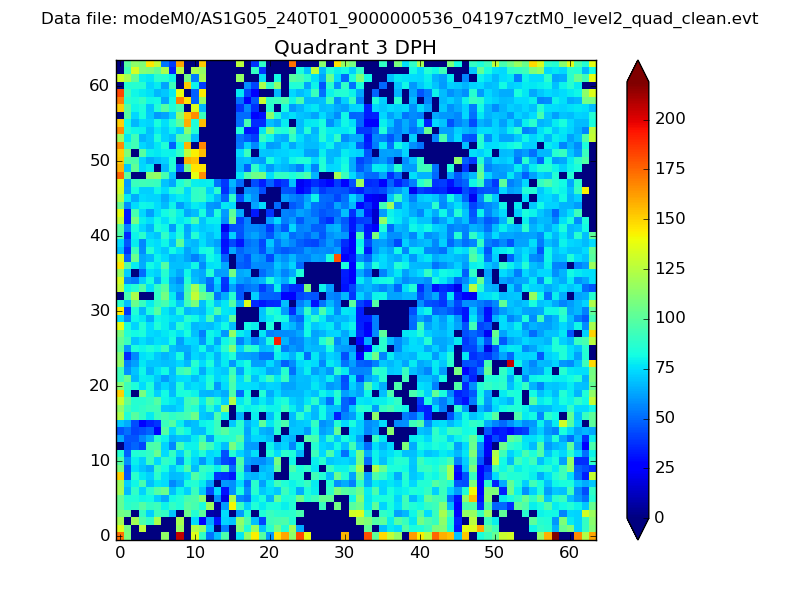 |
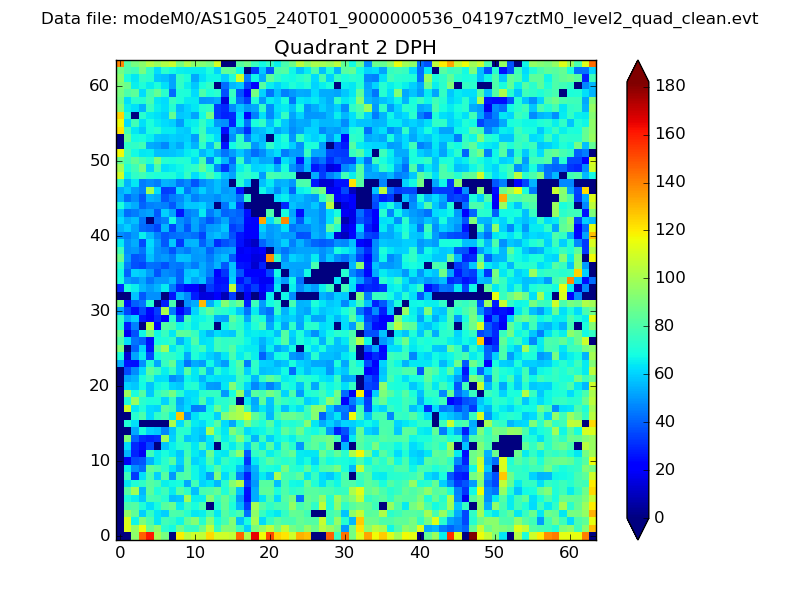 |
Quadrant C |
| Plot type | Count rate plots | Images |
|---|---|---|
| Comparison with Poisson distribution Blue bars denote a histogram of data divided into 1 sec bins. Red curve is a Poisson curve with rate = median count rate of data. |
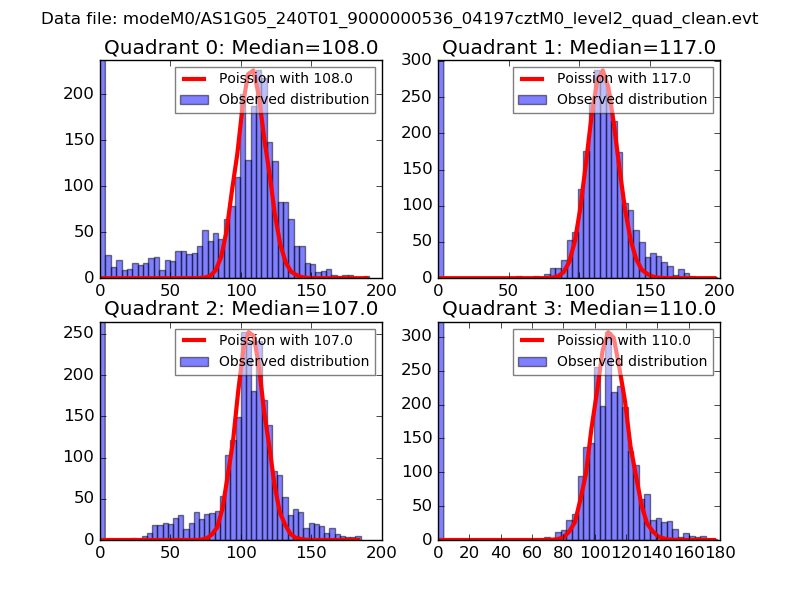 |
 |
| Quadrant-wise count rates Data is divided into 100 sec bins |
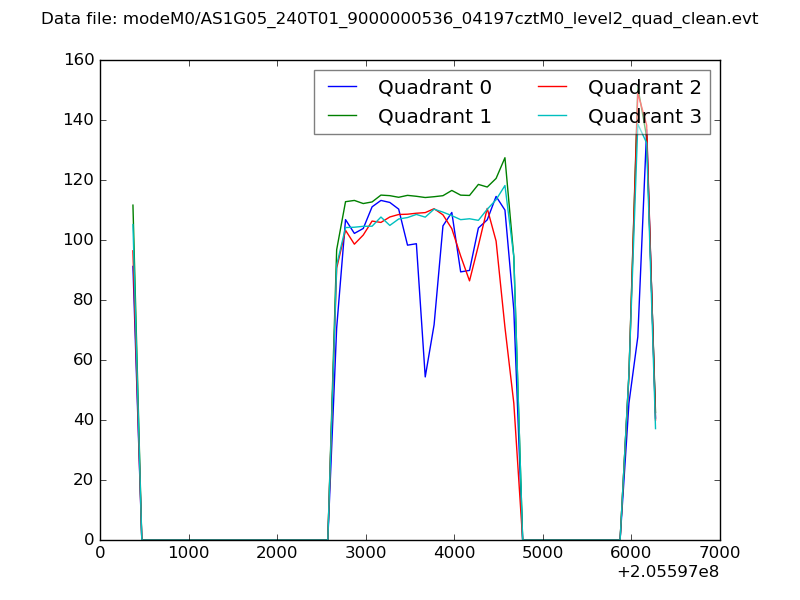 |
|
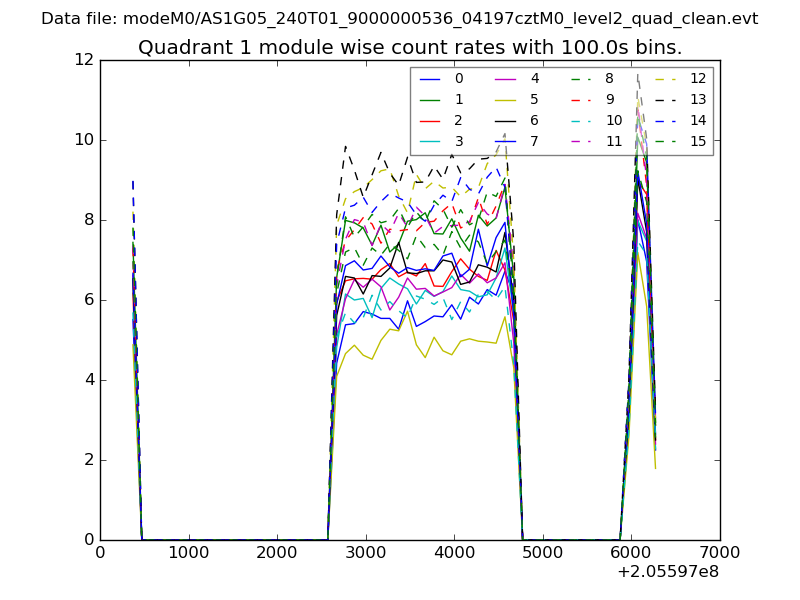
| Module-wise count rates for Quadrant A Data is divided into 100 sec bins |
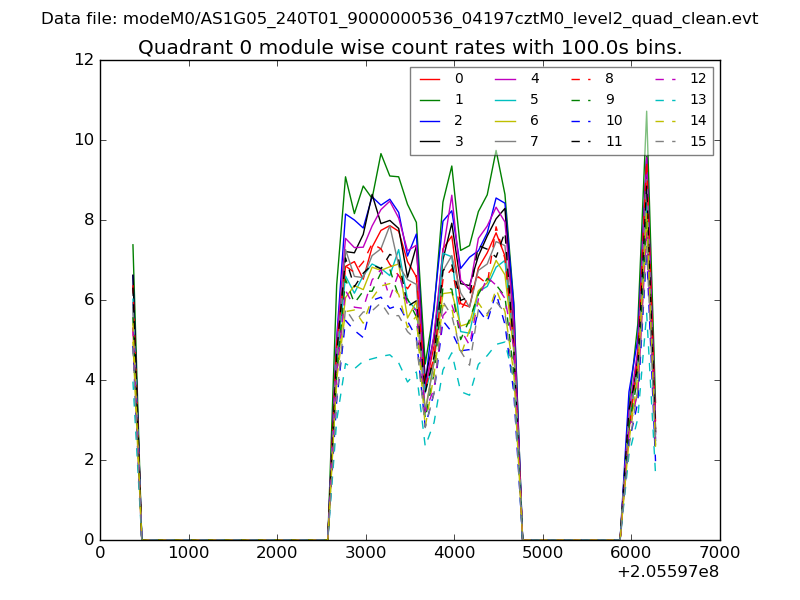 |
 |
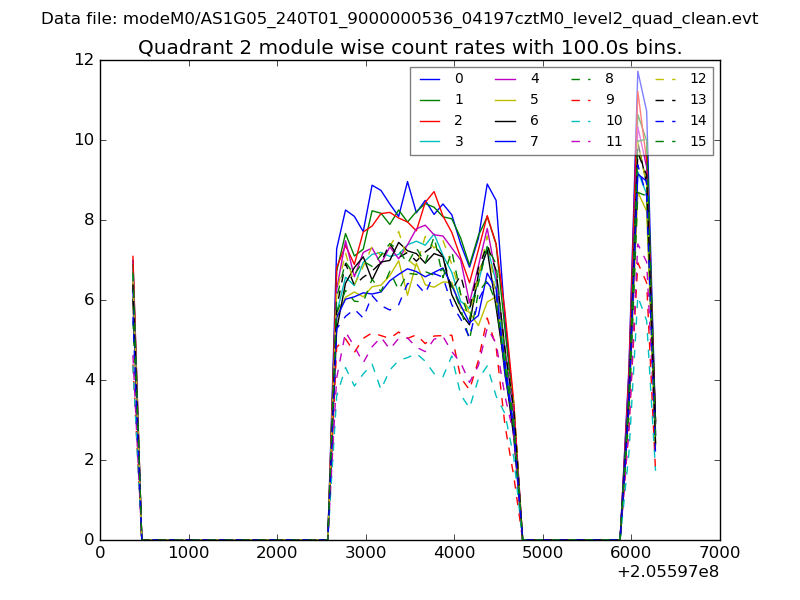
| Module-wise count rates for Quadrant B Data is divided into 100 sec bins |
 |
 |
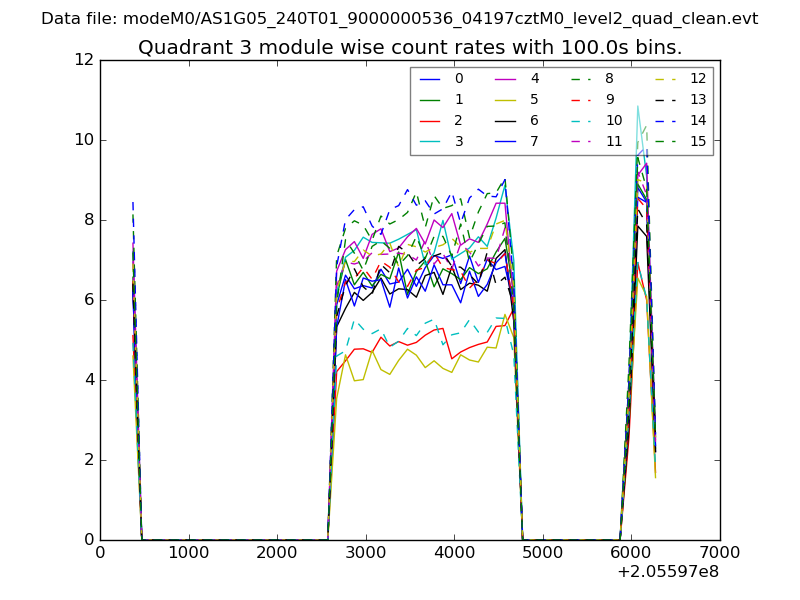
| Module-wise count rates for Quadrant C Data is divided into 100 sec bins |
 |
 |
| Module-wise count rates for Quadrant D Data is divided into 100 sec bins |
 |
 |
| Parameter | Plot |
|---|---|
| CZT HV Monitor | 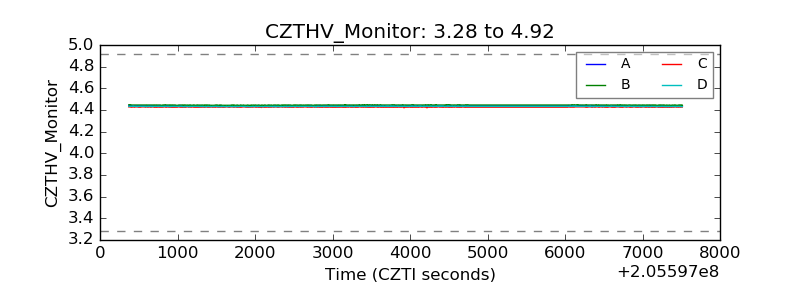 |
| D_VDD | 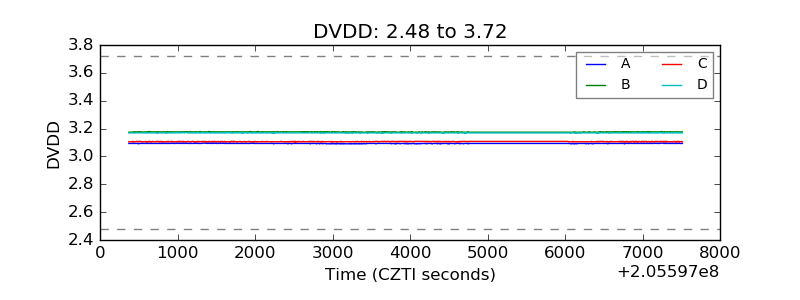 |
| Temperature 1 | 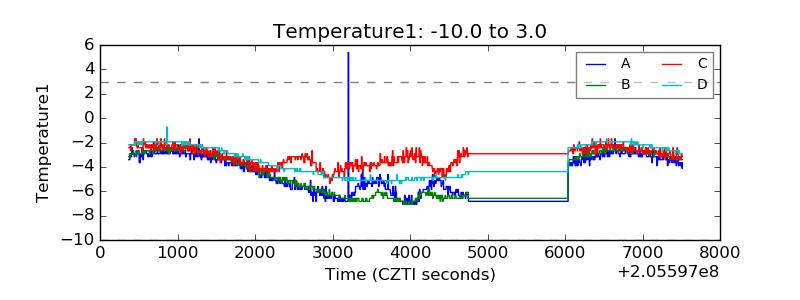 |
| Veto HV Monitor | 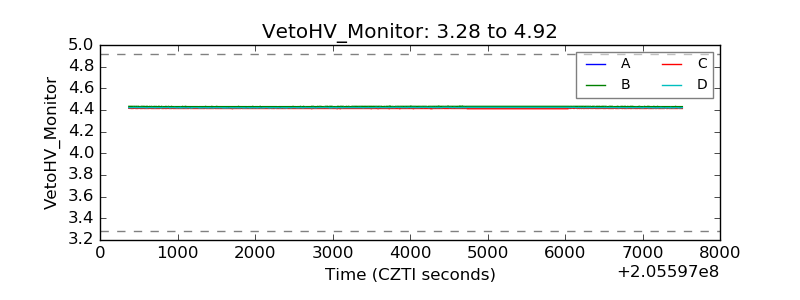 |
| Veto LLD | 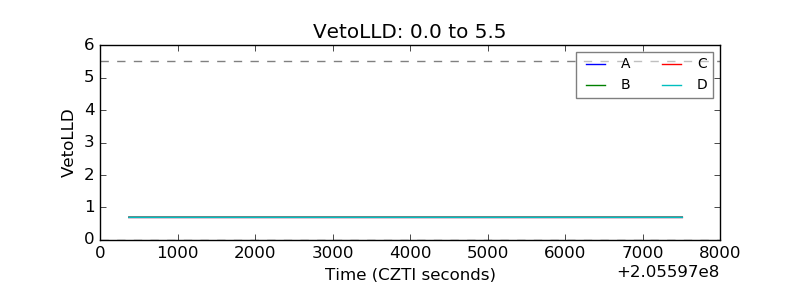 |
| Alpha Counter | 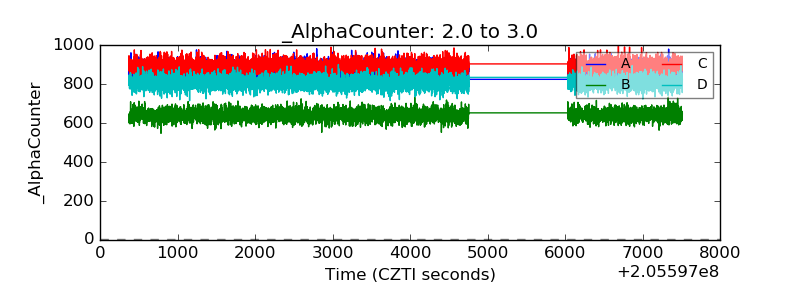 |
| _CPM_Rate | 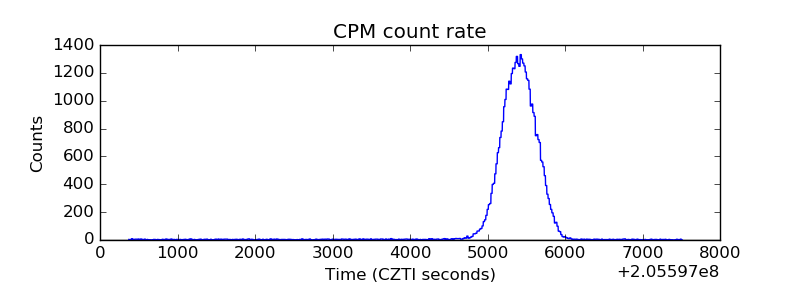 |
| CZT Counter | 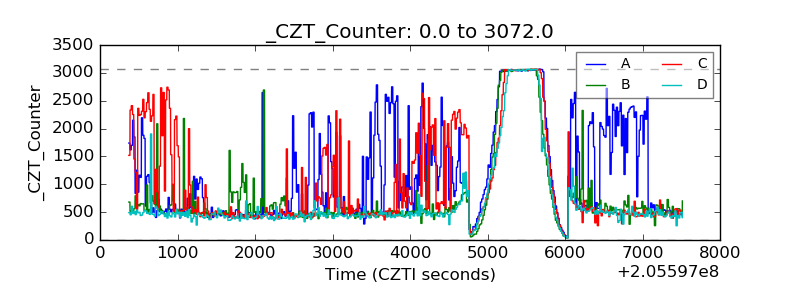 |
| +2.5 Volts monitor | 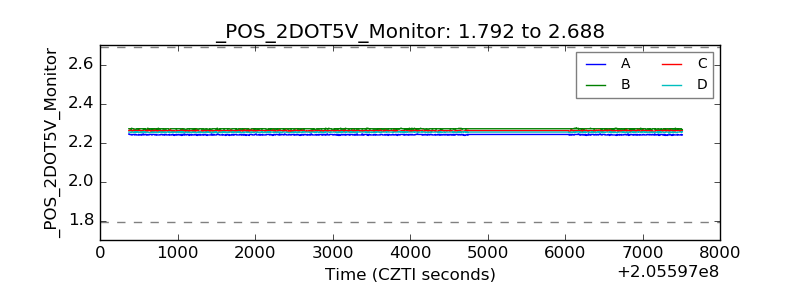 |
| +5 Volts monitor | 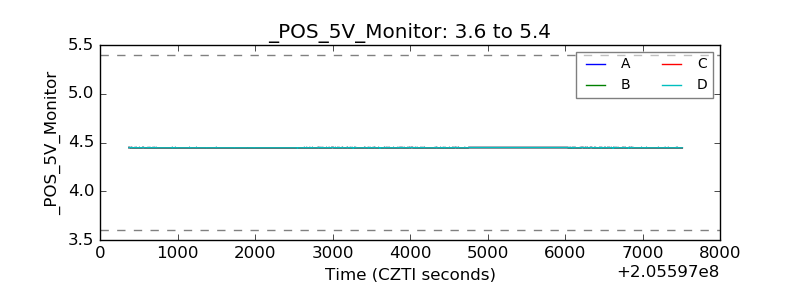 |
| _ROLL_ROT |  |
| _Roll_DEC | 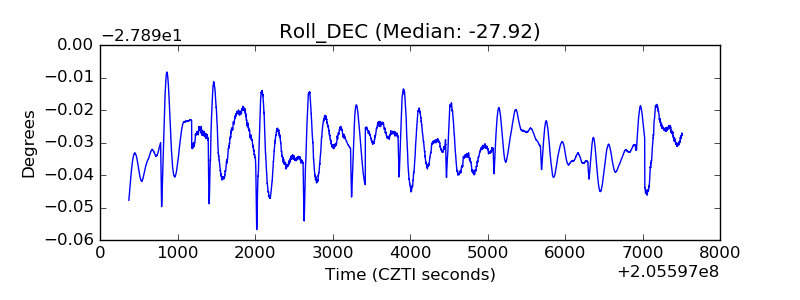 |
| _Roll_RA | 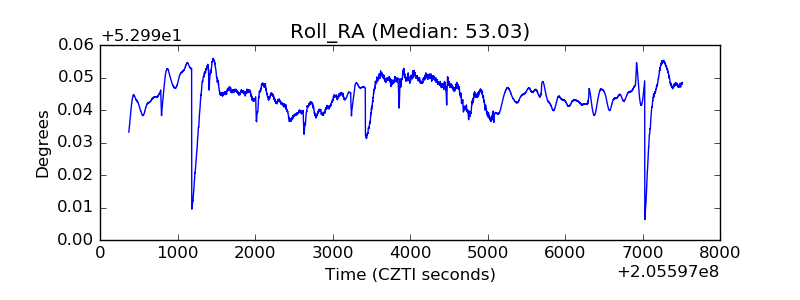 |
| Veto Counter | 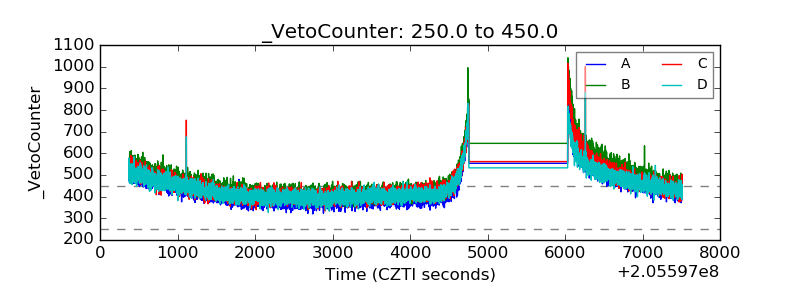 |