| Param | Original file | Final file |
|---|---|---|
| Filename | modeM0/AS1G05_240T01_9000000536_04199cztM0_level2.evt | modeM0/AS1G05_240T01_9000000536_04199cztM0_level2_quad_clean.evt |
| Size (bytes) | 653,011,200 | 54,112,320 |
| Size | 622.8 MB | 51.6 MB |
| Events in quadrant A | 9,057,098 | 193,029 |
| Events in quadrant B | 3,724,396 | 339,367 |
| Events in quadrant C | 3,226,785 | 328,819 |
| Events in quadrant D | 3,325,523 | 320,394 |
| Mode SS | |||
|---|---|---|---|
| Quadrant | BADHDUFLAG | Total packets | Discarded packets |
| A | 0 | 134 | 0 |
| B | 0 | 134 | 0 |
| C | 0 | 134 | 0 |
| D | 0 | 134 | 0 |
| Mode M9 | |||
|---|---|---|---|
| Quadrant | BADHDUFLAG | Total packets | Discarded packets |
| A | 0 | 11 | 0 |
| B | 0 | 11 | 0 |
| C | 0 | 11 | 0 |
| D | 0 | 11 | 0 |
| Mode M0 | |||
|---|---|---|---|
| Quadrant | BADHDUFLAG | Total packets | Discarded packets |
| A | 0 | 31224 | 3 |
| B | 0 | 15207 | 2 |
| C | 0 | 13839 | 2 |
| D | 0 | 14423 | 2 |
| Quadrant | Total seconds | Saturated seconds | Saturation percentage |
|---|---|---|---|
| A | 6526 | 2507 | 38.415568% |
| B | 6526 | 150 | 2.298498% |
| C | 6526 | 60 | 0.919399% |
| D | 6526 | 137 | 2.099295% |
Noise dominated data is calculated using 1-second bins in cleaned event files. If a bin has >2000 counts, and if more than 50% of those come from <1% of pixels, then it is considered to be noise-dominated and hence unusable.
| Quadrant | # 1 sec bins | Bins with >0 counts | Bins with >2000 counts | High rate bins dominated by noise | Noise dominated (total time) | Noise dominated (detector-on time) | Marked lightcurve |
|---|---|---|---|---|---|---|---|
| A | 7631 | 6527 | 1993 | 1993 | 26.12% | 30.53% | 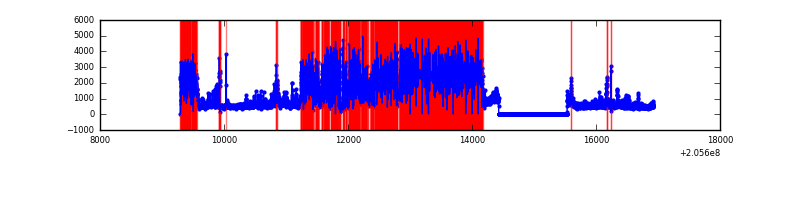 |
| B | 7631 | 6527 | 15 | 15 | 0.20% | 0.23% | 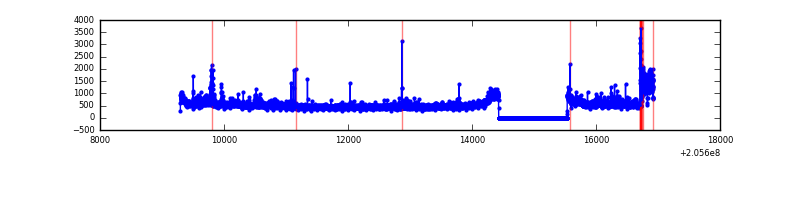 |
| C | 7631 | 6527 | 0 | 0 | 0.00% | 0.00% | 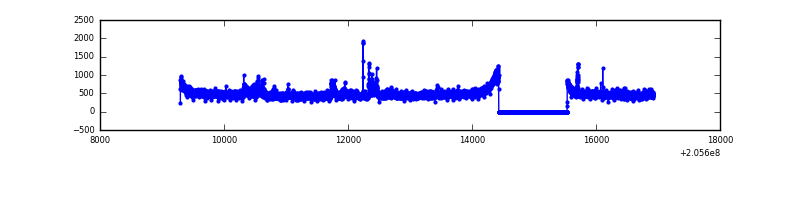 |
| D | 7631 | 6527 | 58 | 58 | 0.76% | 0.89% | 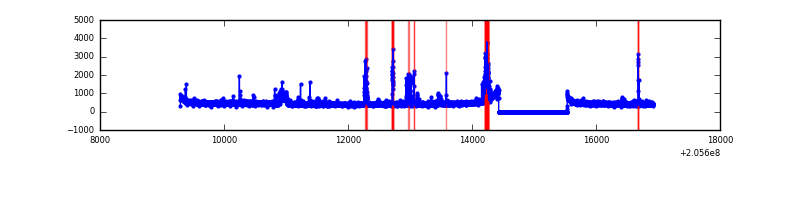 |
Top three noisy pixels from each quadrant. If the there are fewer than three noisy pixels in the level2.evt file, extra rows are filled as -1
| Pixel properties | Quadrant properties | ||||||
|---|---|---|---|---|---|---|---|
| Quadrant | DetID | PixID | Counts | Sigma | Mean | Median | Sigma |
| A | 15 | 234 | 5214653 | 39127.57 | 651 | 637 | 133.3 |
| A | 0 | 50 | 930820 | 6980.38 | 651 | 637 | 133.3 |
| A | 3 | 1 | 232250 | 1738.09 | 651 | 637 | 133.3 |
| B | 8 | 3 | 303153 | 1906.19 | 817 | 797 | 158.6 |
| B | 3 | 0 | 113256 | 708.99 | 817 | 797 | 158.6 |
| B | 14 | 167 | 100069 | 625.85 | 817 | 797 | 158.6 |
| C | 9 | 144 | 156283 | 853.97 | 778 | 780 | 182.1 |
| C | 14 | 67 | 11819 | 60.62 | 778 | 780 | 182.1 |
| C | 10 | 65 | 7355 | 36.11 | 778 | 780 | 182.1 |
| D | 13 | 239 | 159383 | 844.17 | 775 | 754 | 187.9 |
| D | 2 | 232 | 59172 | 310.88 | 775 | 754 | 187.9 |
| D | 13 | 223 | 44643 | 233.56 | 775 | 754 | 187.9 |
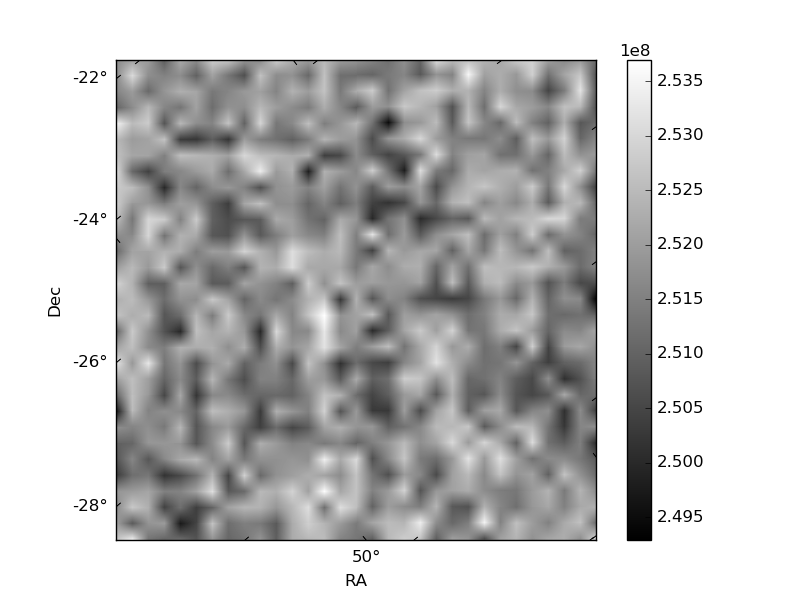
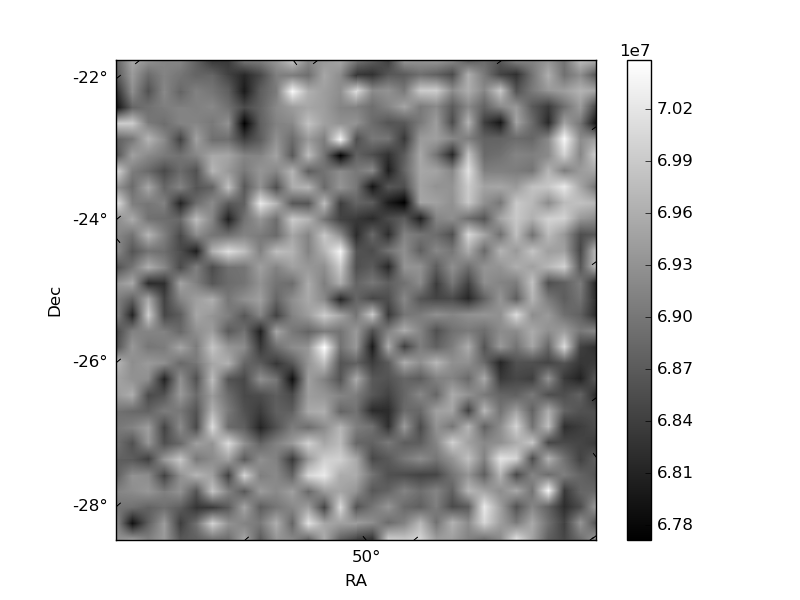
Histogram calculated using DETX and DETY for each event in the final _common_clean file
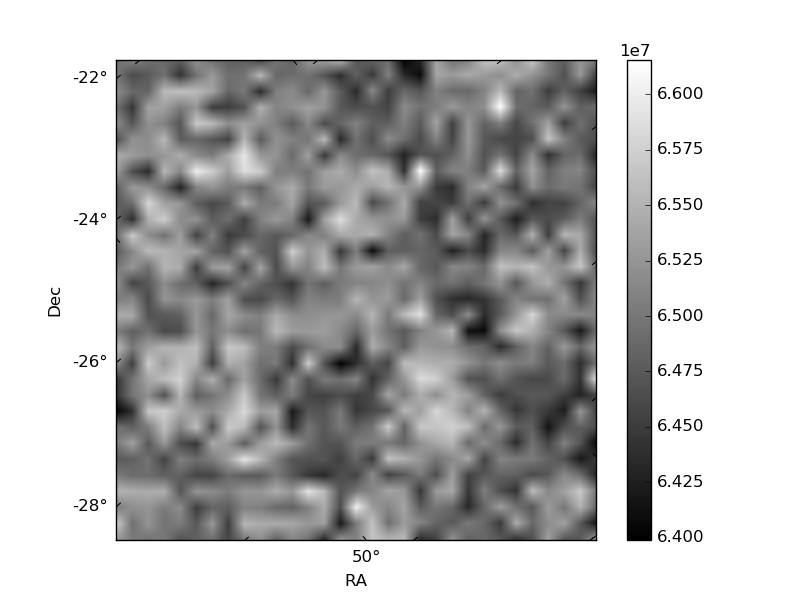
| Quadrant A | 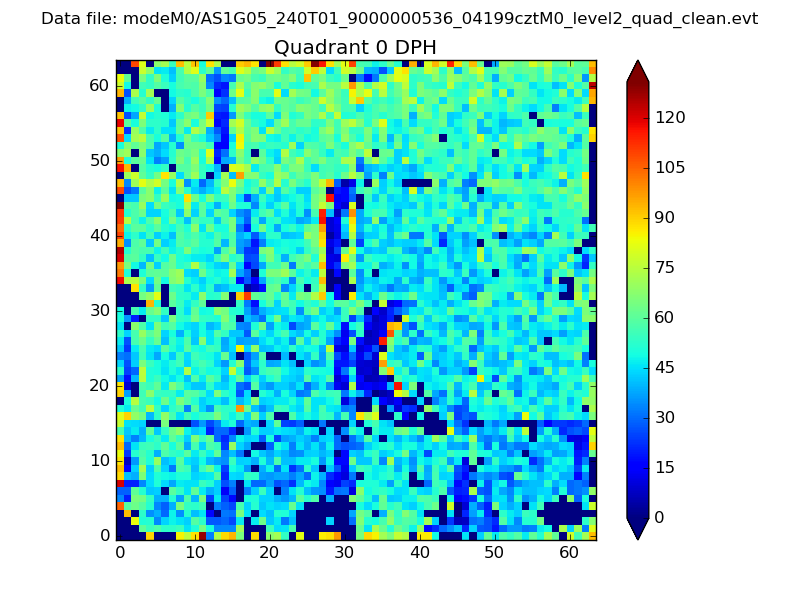 |
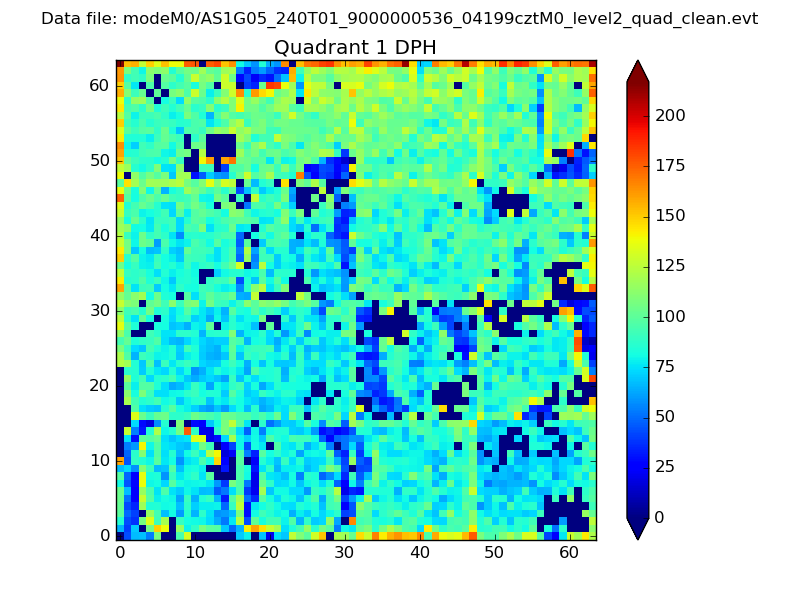 |
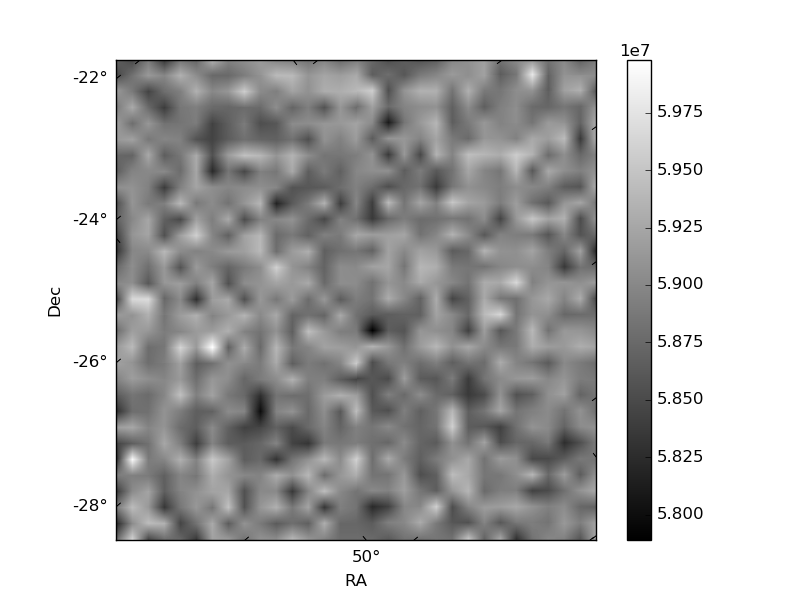
Quadrant B |
|---|---|---|---|
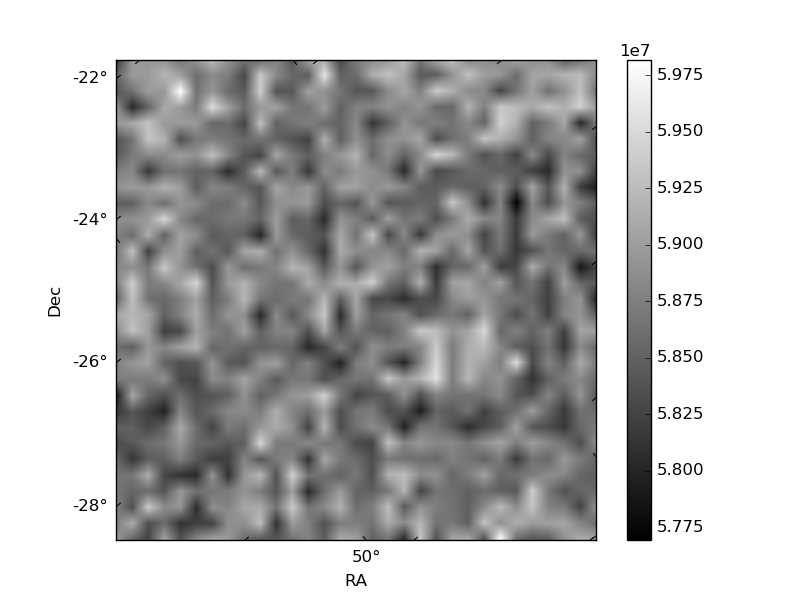
| Quadrant D | 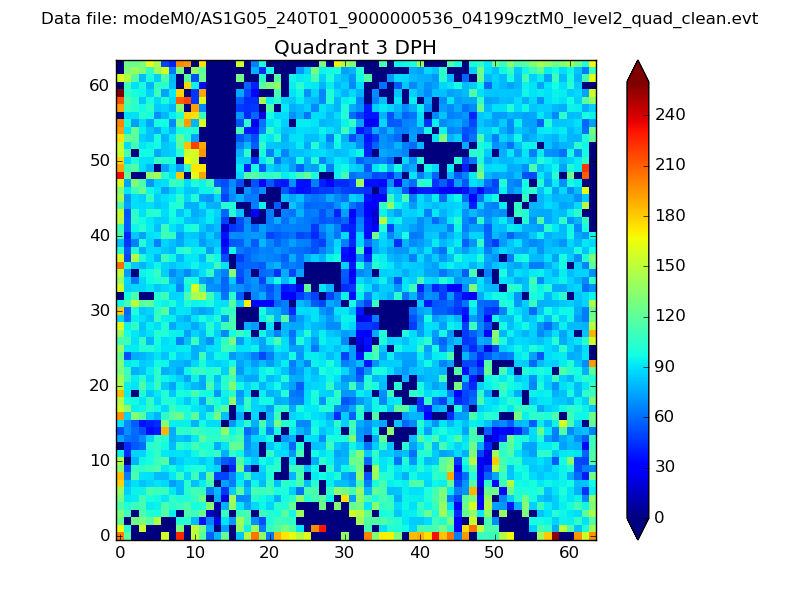 |
 |
Quadrant C |
| Plot type | Count rate plots | Images |
|---|---|---|
| Comparison with Poisson distribution Blue bars denote a histogram of data divided into 1 sec bins. Red curve is a Poisson curve with rate = median count rate of data. |
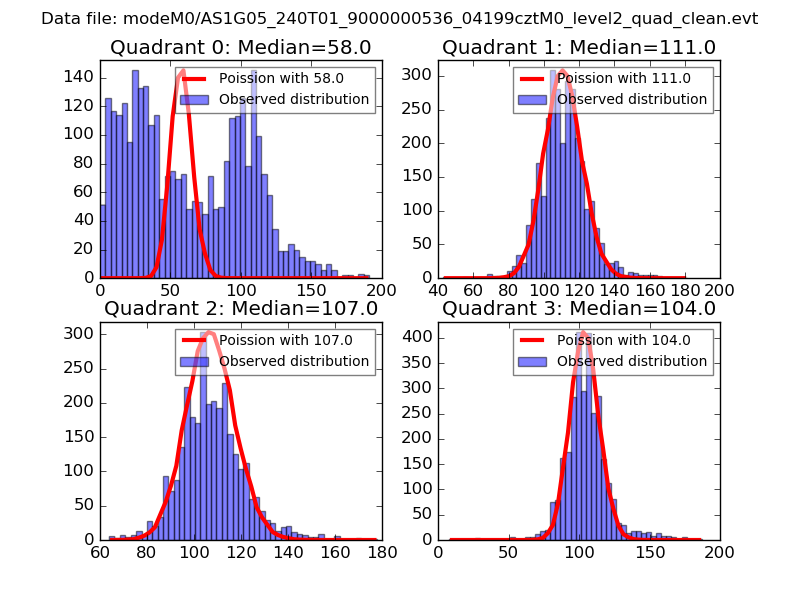 |
 |
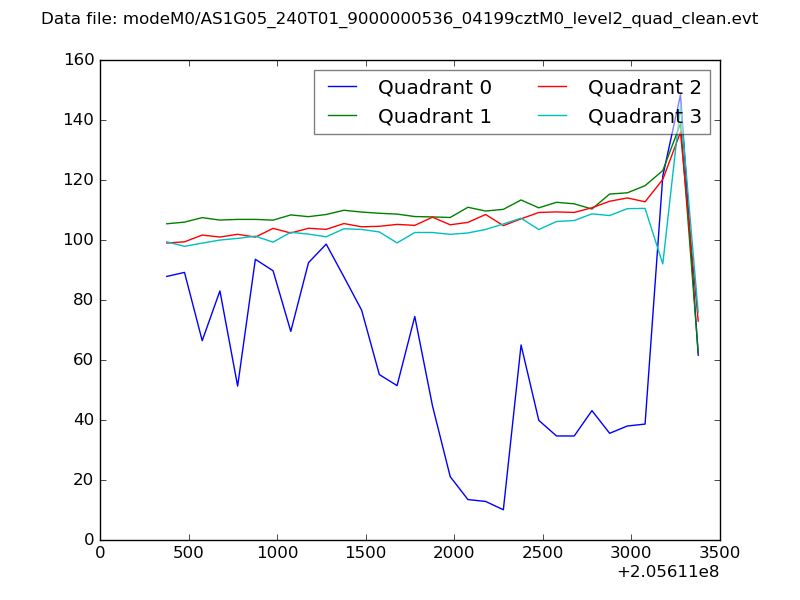
| Quadrant-wise count rates Data is divided into 100 sec bins |
 |
|
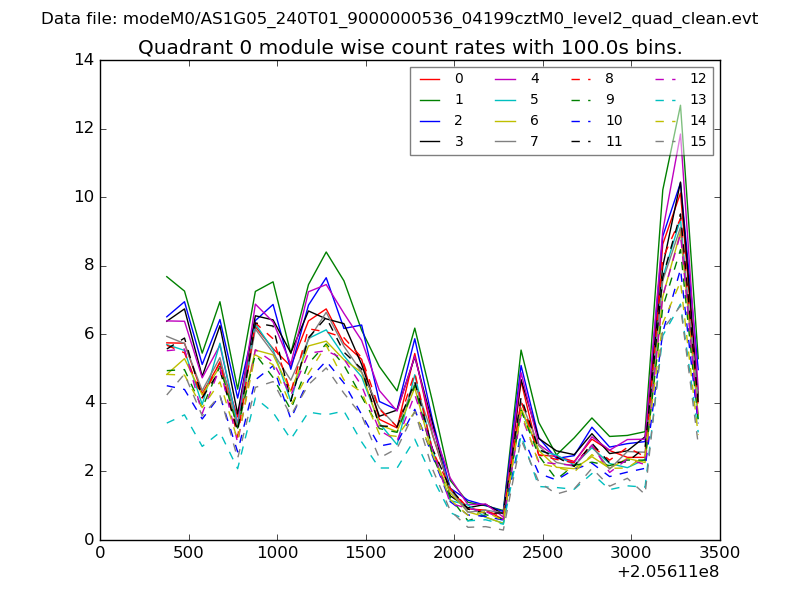
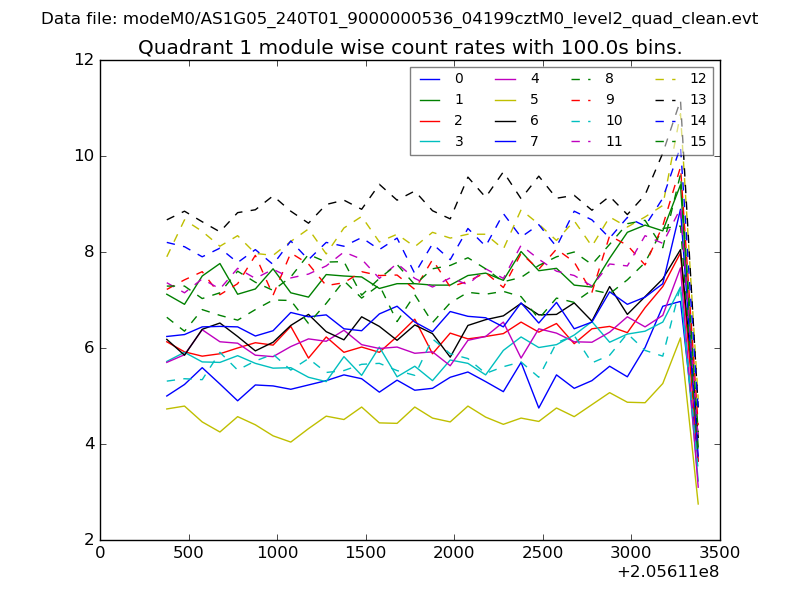
| Module-wise count rates for Quadrant A Data is divided into 100 sec bins |
 |
 |
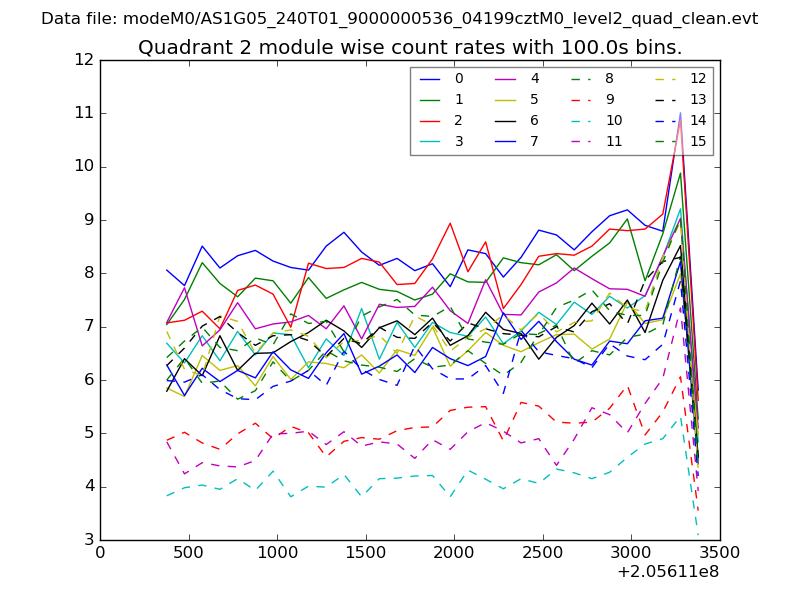
| Module-wise count rates for Quadrant B Data is divided into 100 sec bins |
 |
 |
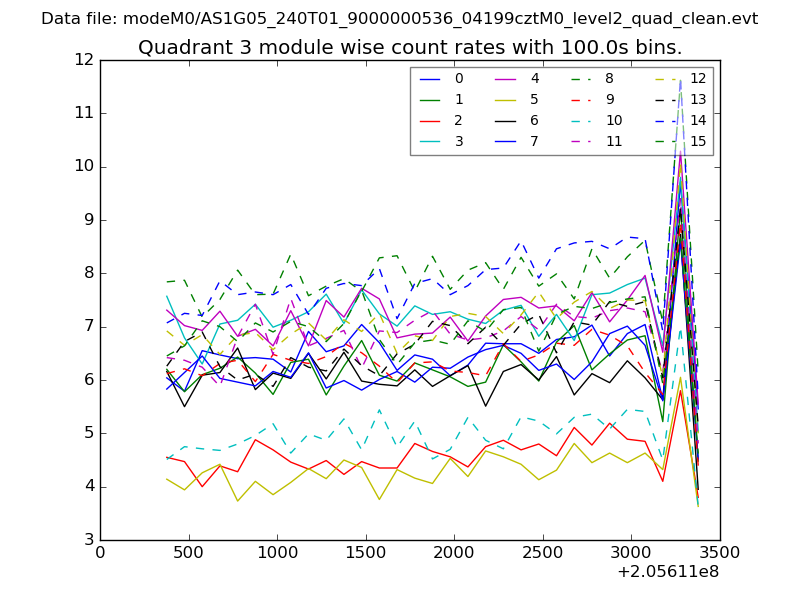
| Module-wise count rates for Quadrant C Data is divided into 100 sec bins |
 |
 |
| Module-wise count rates for Quadrant D Data is divided into 100 sec bins |
 |
 |
| Parameter | Plot |
|---|---|
| CZT HV Monitor | 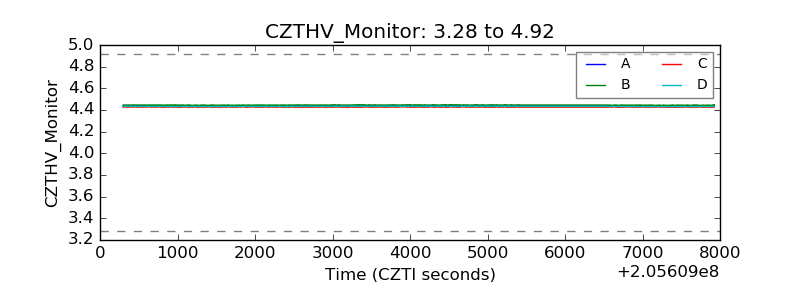 |
| D_VDD | 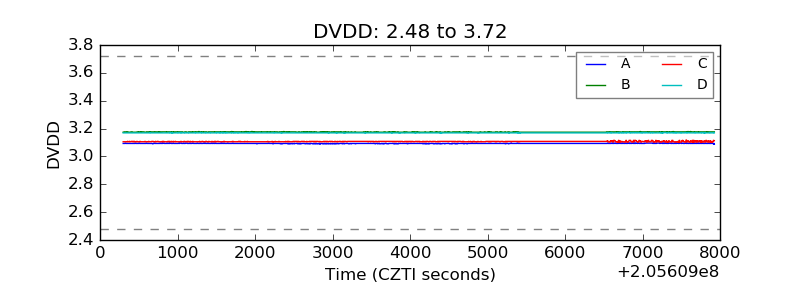 |
| Temperature 1 | 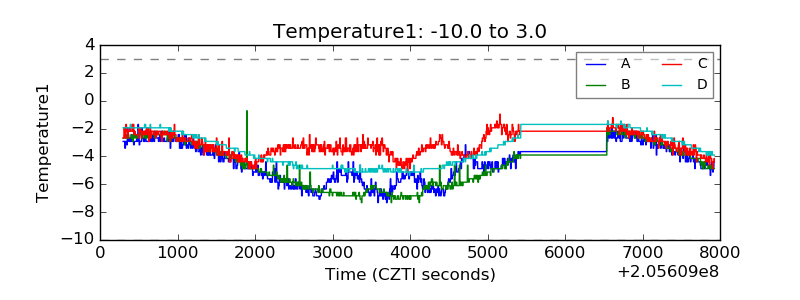 |
| Veto HV Monitor | 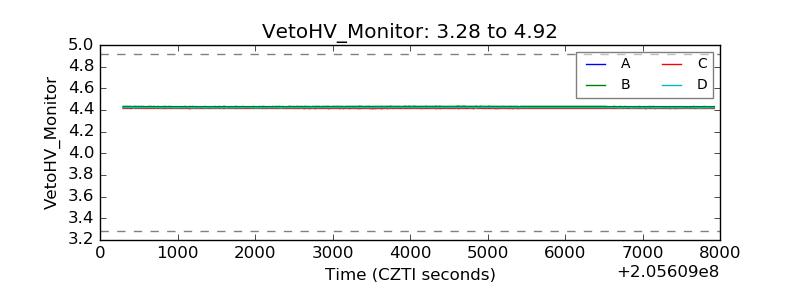 |
| Veto LLD |  |
| Alpha Counter | 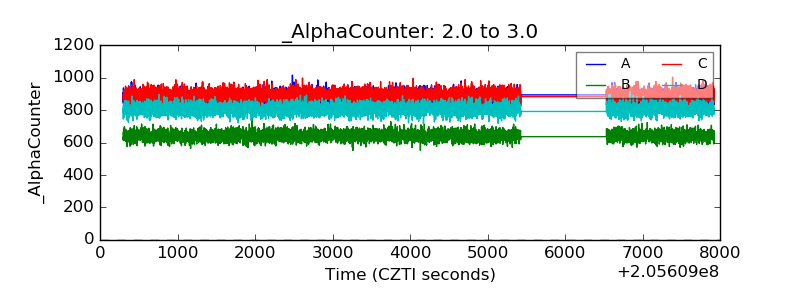 |
| _CPM_Rate | 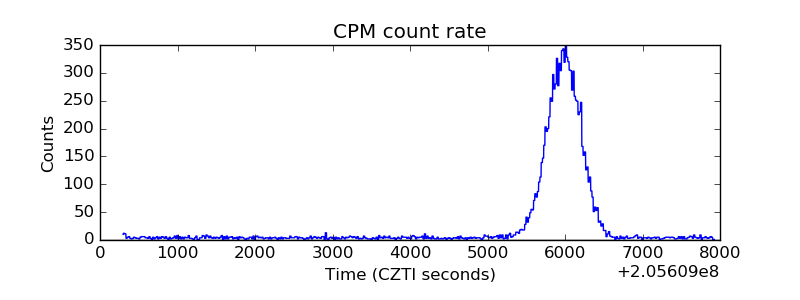 |
| CZT Counter | 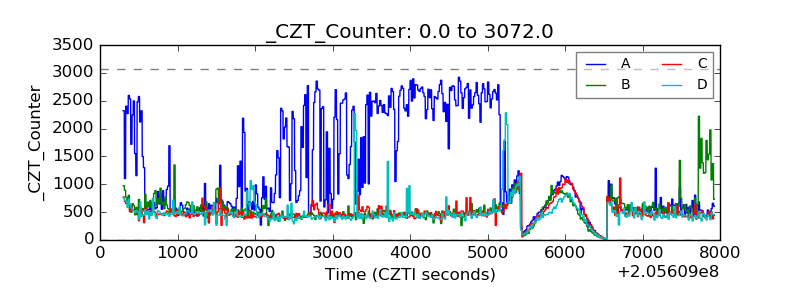 |
| +2.5 Volts monitor | 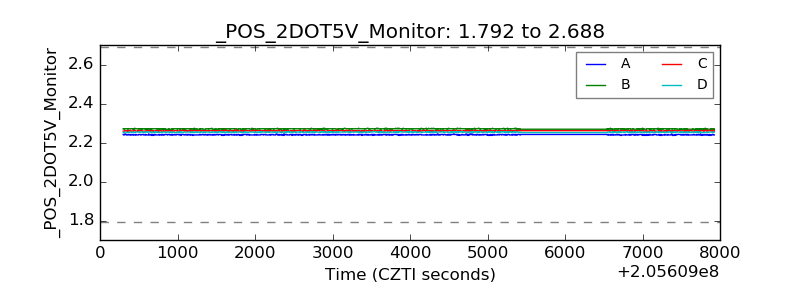 |
| +5 Volts monitor | 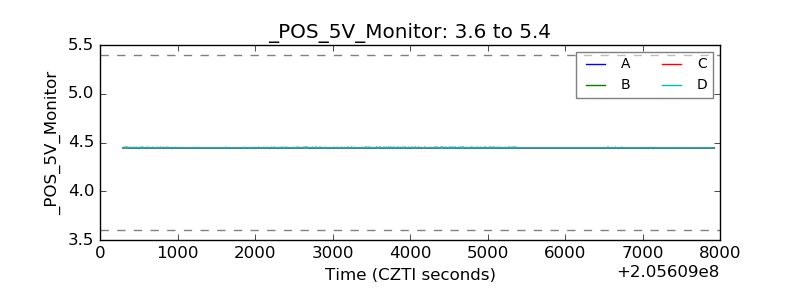 |
| _ROLL_ROT | 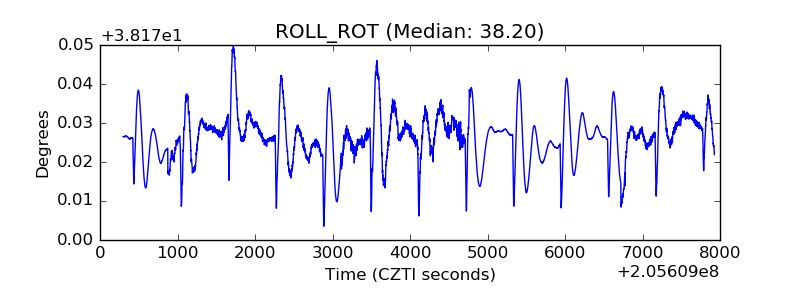 |
| _Roll_DEC | 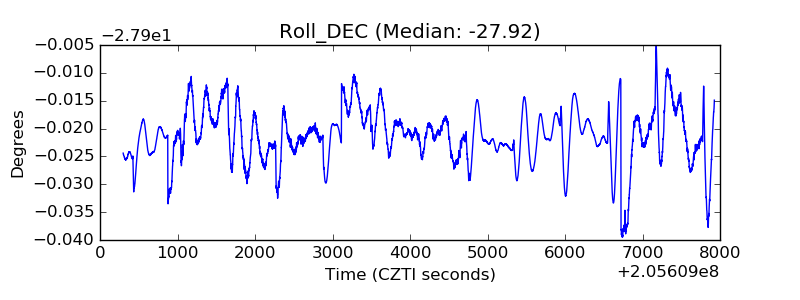 |
| _Roll_RA | 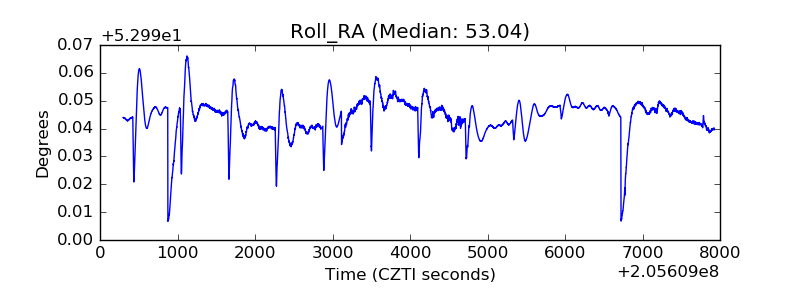 |
| Veto Counter | 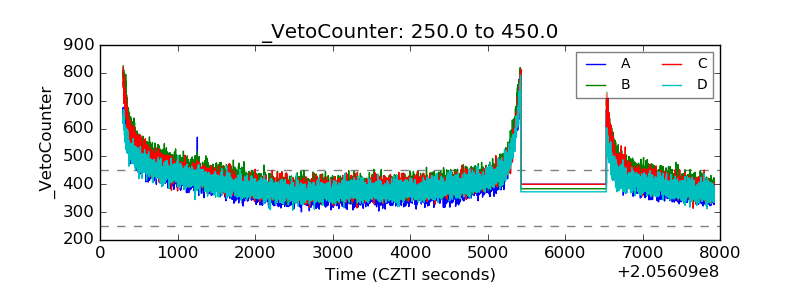 |