| Param | Original file | Final file |
|---|---|---|
| Filename | modeM0/AS1G05_240T01_9000000536_04202cztM0_level2.evt | modeM0/AS1G05_240T01_9000000536_04202cztM0_level2_quad_clean.evt |
| Size (bytes) | 628,015,680 | 78,246,720 |
| Size | 598.9 MB | 74.6 MB |
| Events in quadrant A | 5,639,185 | 446,112 |
| Events in quadrant B | 4,989,172 | 465,465 |
| Events in quadrant C | 3,749,115 | 459,223 |
| Events in quadrant D | 4,098,077 | 440,805 |
| Mode SS | |||
|---|---|---|---|
| Quadrant | BADHDUFLAG | Total packets | Discarded packets |
| A | 0 | 166 | 0 |
| B | 0 | 166 | 0 |
| C | 0 | 166 | 0 |
| D | 0 | 166 | 0 |
| Mode M9 | |||
|---|---|---|---|
| Quadrant | BADHDUFLAG | Total packets | Discarded packets |
| A | 0 | 5 | 0 |
| B | 0 | 5 | 0 |
| C | 0 | 5 | 0 |
| D | 0 | 5 | 0 |
| Mode M0 | |||
|---|---|---|---|
| Quadrant | BADHDUFLAG | Total packets | Discarded packets |
| A | 0 | 22219 | 7 |
| B | 0 | 20376 | 22 |
| C | 0 | 16768 | 14 |
| D | 0 | 18095 | 8 |
| Quadrant | Total seconds | Saturated seconds | Saturation percentage |
|---|---|---|---|
| A | 8018 | 629 | 7.844849% |
| B | 8011 | 518 | 6.466109% |
| C | 8014 | 58 | 0.723733% |
| D | 8017 | 182 | 2.270176% |
Noise dominated data is calculated using 1-second bins in cleaned event files. If a bin has >2000 counts, and if more than 50% of those come from <1% of pixels, then it is considered to be noise-dominated and hence unusable.
| Quadrant | # 1 sec bins | Bins with >0 counts | Bins with >2000 counts | High rate bins dominated by noise | Noise dominated (total time) | Noise dominated (detector-on time) | Marked lightcurve |
|---|---|---|---|---|---|---|---|
| A | 8560 | 8022 | 374 | 374 | 4.37% | 4.66% | 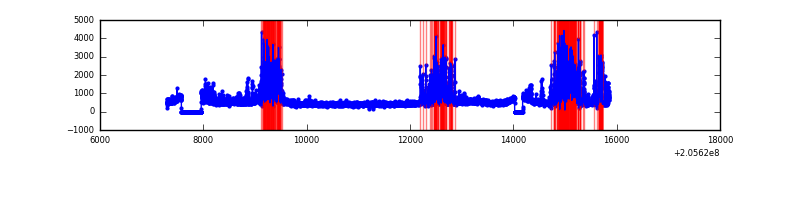 |
| B | 8560 | 8021 | 227 | 227 | 2.65% | 2.83% | 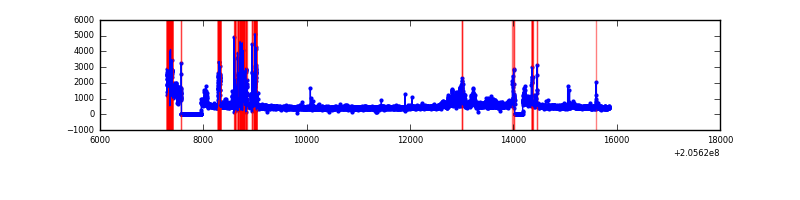 |
| C | 8560 | 8022 | 2 | 2 | 0.02% | 0.02% | 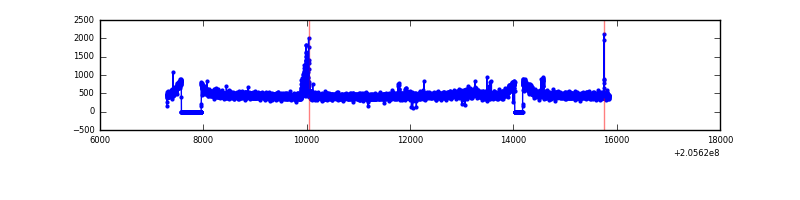 |
| D | 8560 | 8022 | 118 | 118 | 1.38% | 1.47% | 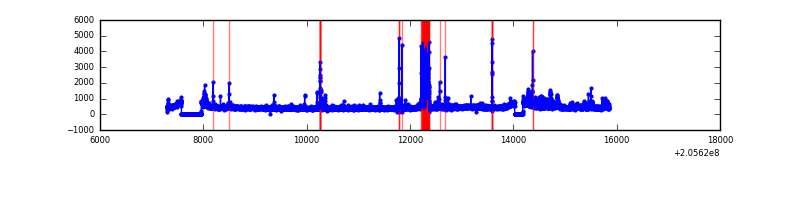 |
Top three noisy pixels from each quadrant. If the there are fewer than three noisy pixels in the level2.evt file, extra rows are filled as -1
| Pixel properties | Quadrant properties | ||||||
|---|---|---|---|---|---|---|---|
| Quadrant | DetID | PixID | Counts | Sigma | Mean | Median | Sigma |
| A | 0 | 50 | 1559136 | 8195.46 | 923 | 900 | 190.1 |
| A | 3 | 1 | 257846 | 1351.39 | 923 | 900 | 190.1 |
| A | 15 | 234 | 197086 | 1031.83 | 923 | 900 | 190.1 |
| B | 3 | 0 | 1006401 | 5551.48 | 932 | 910 | 181.1 |
| B | 8 | 3 | 239433 | 1316.92 | 932 | 910 | 181.1 |
| B | 15 | 204 | 91543 | 500.4 | 932 | 910 | 181.1 |
| C | 9 | 144 | 88506 | 406.79 | 922 | 925 | 215.3 |
| C | 8 | 128 | 19799 | 87.67 | 922 | 925 | 215.3 |
| C | 10 | 65 | 9970 | 42.01 | 922 | 925 | 215.3 |
| D | 13 | 239 | 365874 | 1633.46 | 911 | 884 | 223.4 |
| D | 12 | 110 | 168697 | 751.02 | 911 | 884 | 223.4 |
| D | 13 | 223 | 35819 | 156.35 | 911 | 884 | 223.4 |
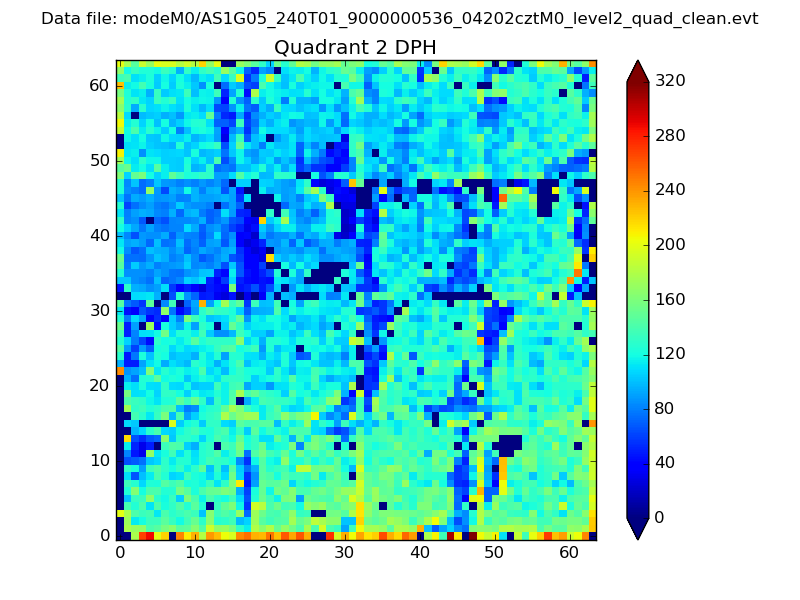
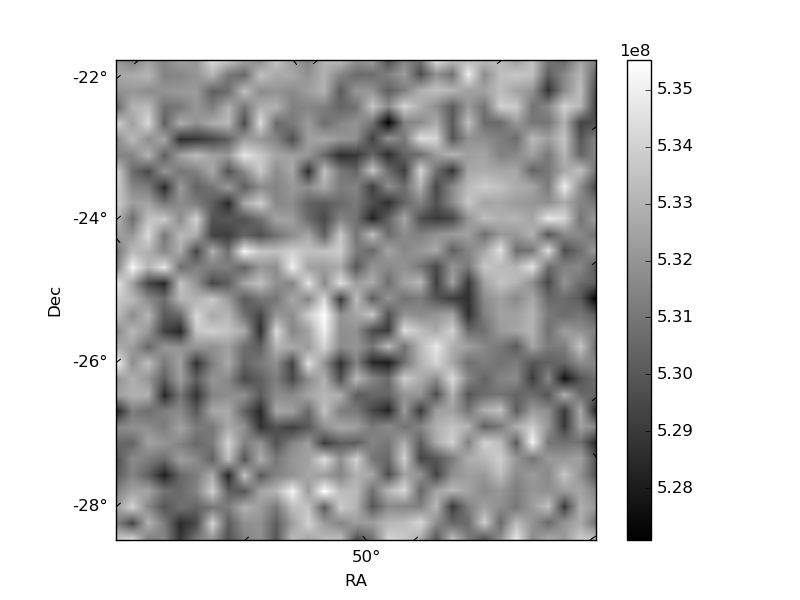
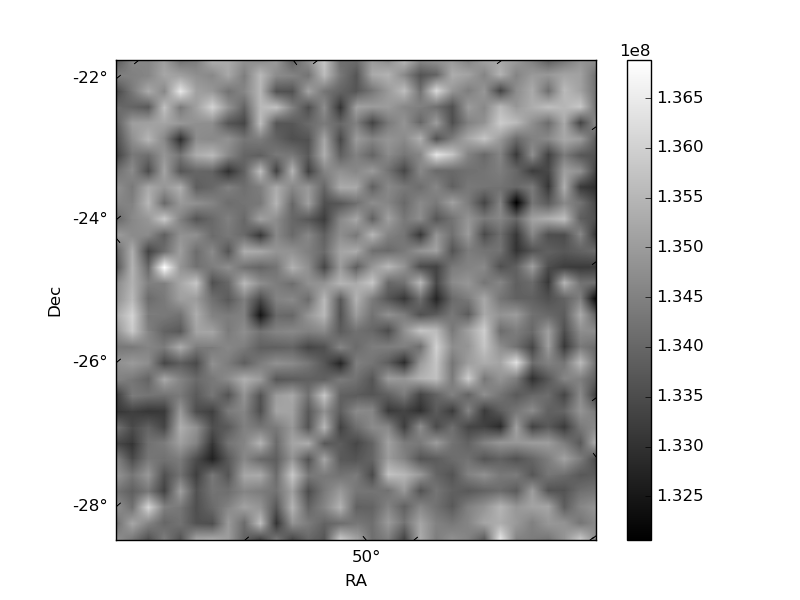
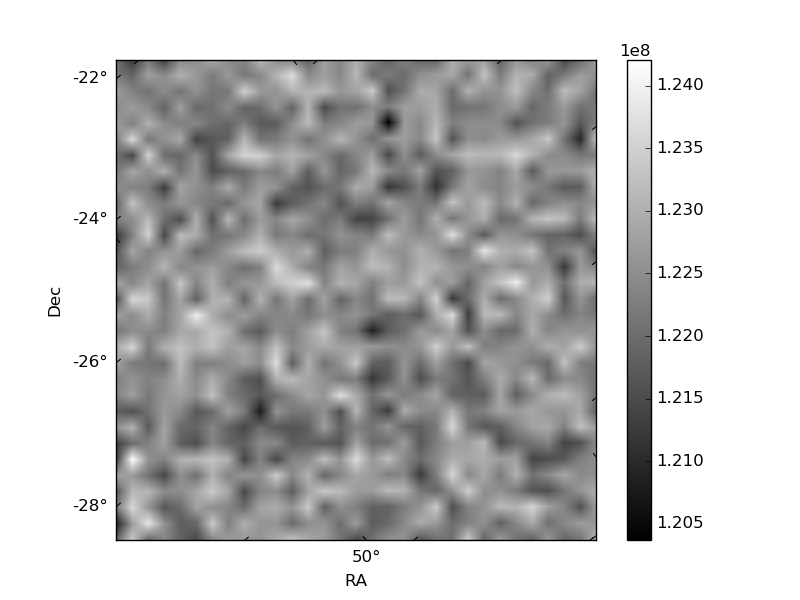
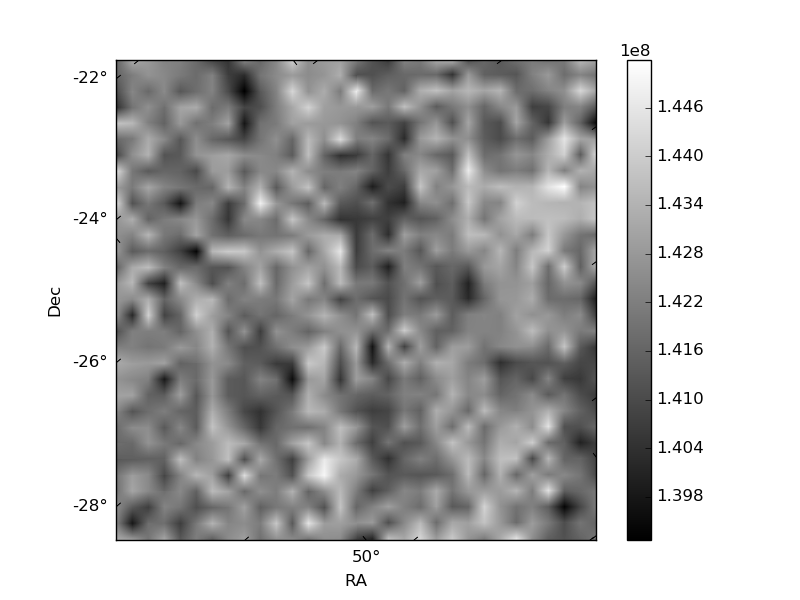
Histogram calculated using DETX and DETY for each event in the final _common_clean file
| Quadrant A | 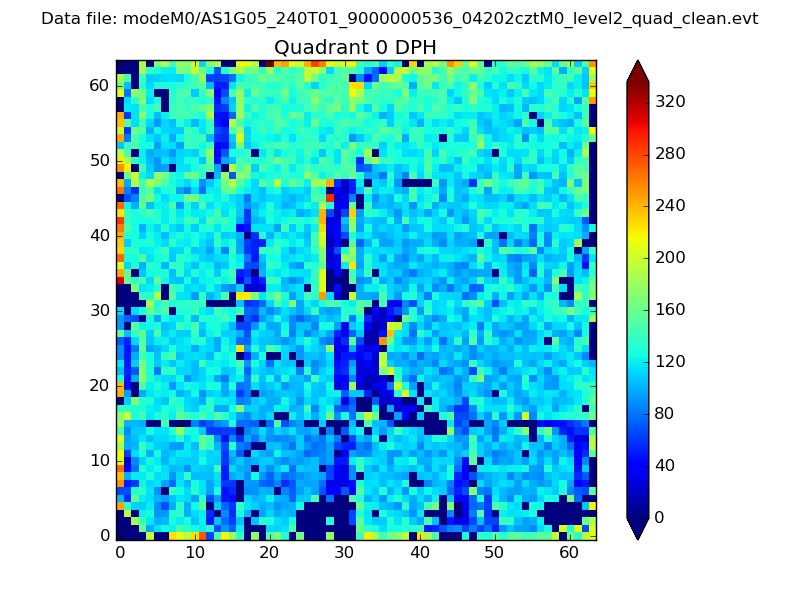 |
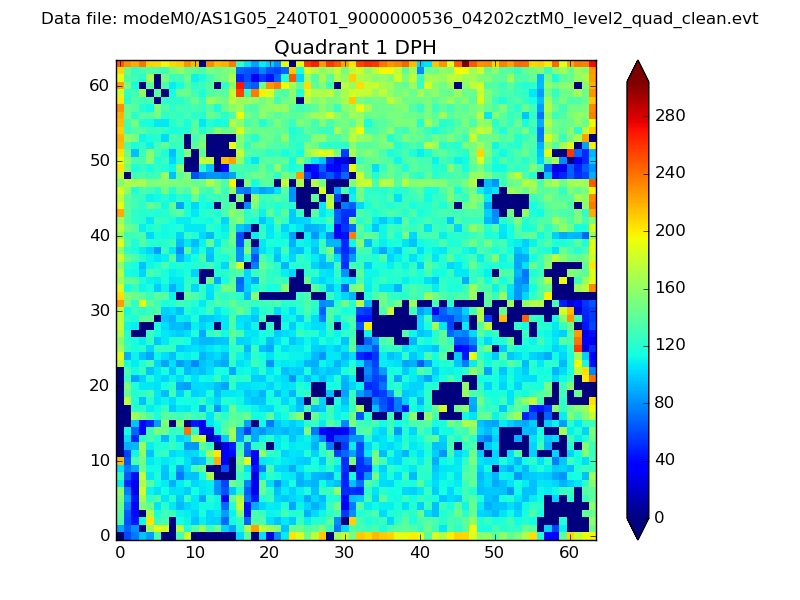 |
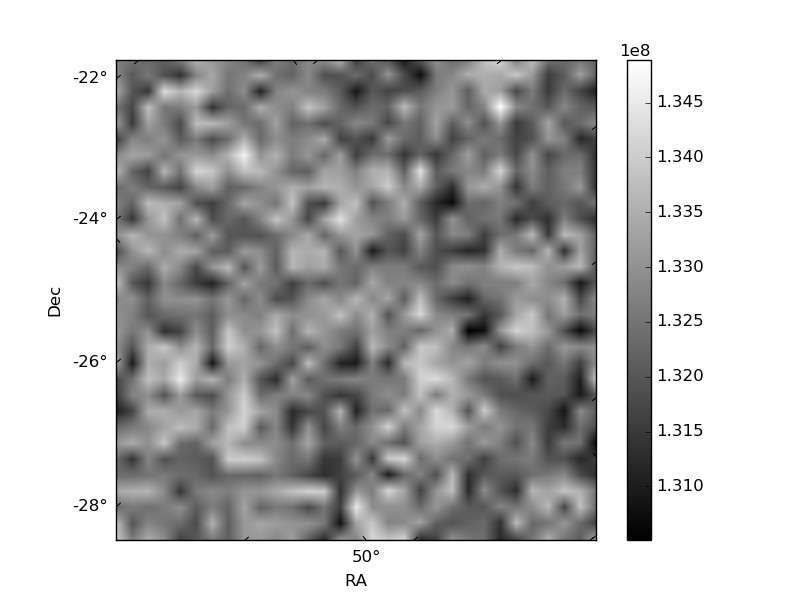
Quadrant B |
|---|---|---|---|
| Quadrant D | 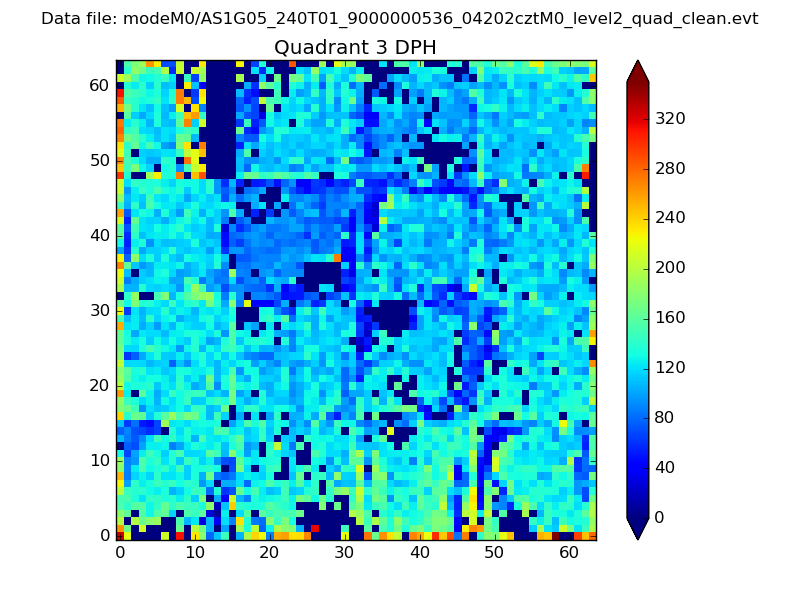 |
 |
Quadrant C |
| Plot type | Count rate plots | Images |
|---|---|---|
| Comparison with Poisson distribution Blue bars denote a histogram of data divided into 1 sec bins. Red curve is a Poisson curve with rate = median count rate of data. |
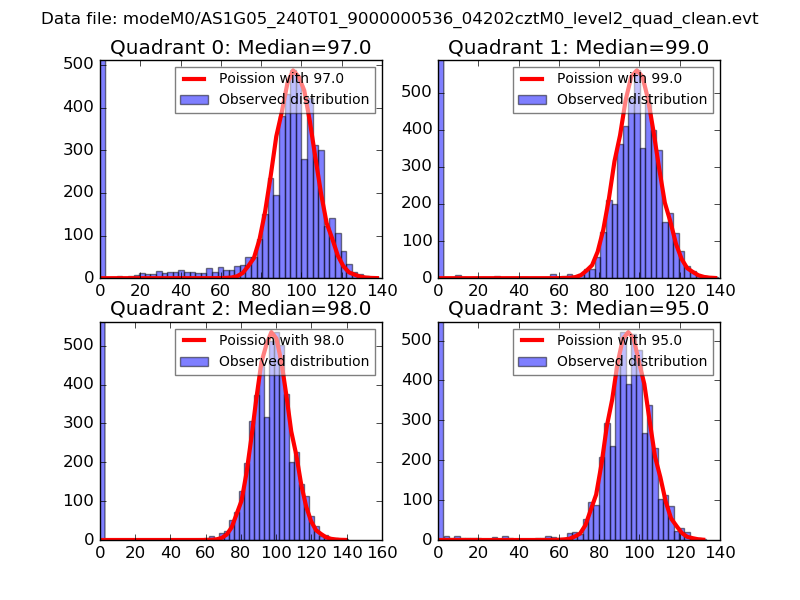 |
 |
| Quadrant-wise count rates Data is divided into 100 sec bins |
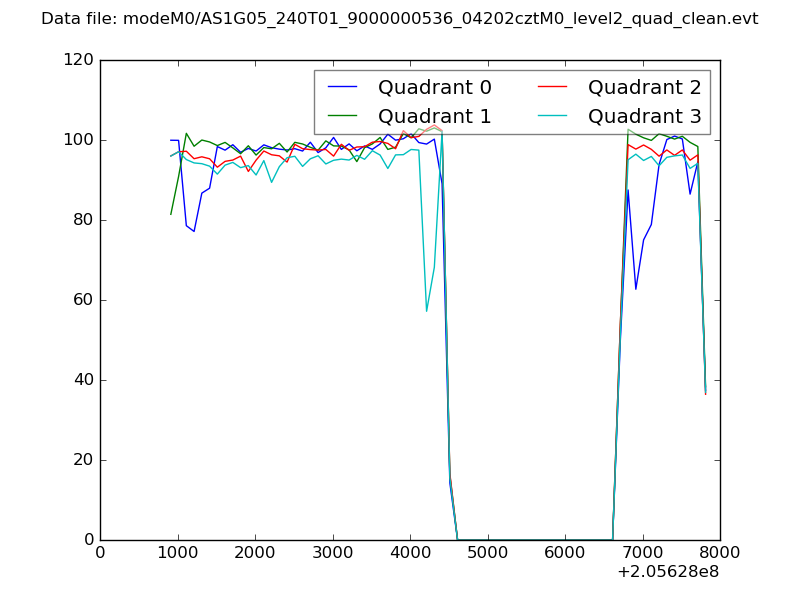 |
|
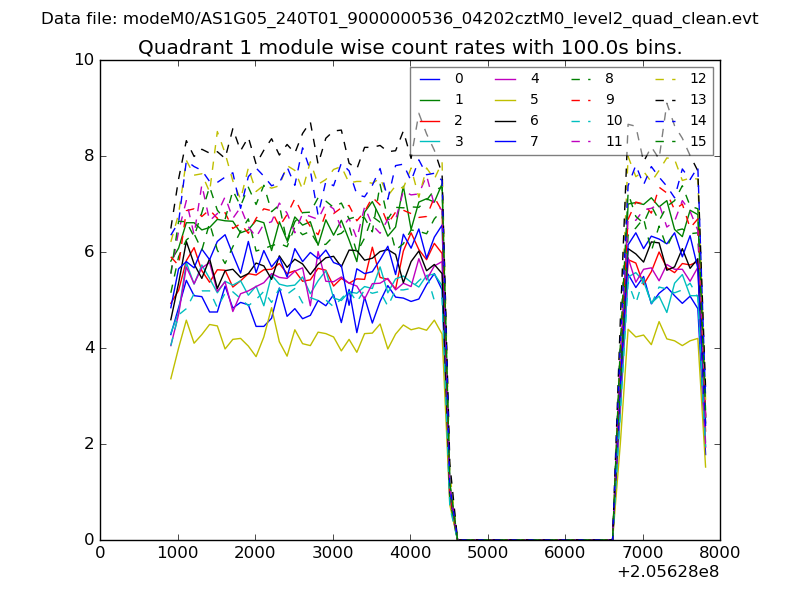
| Module-wise count rates for Quadrant A Data is divided into 100 sec bins |
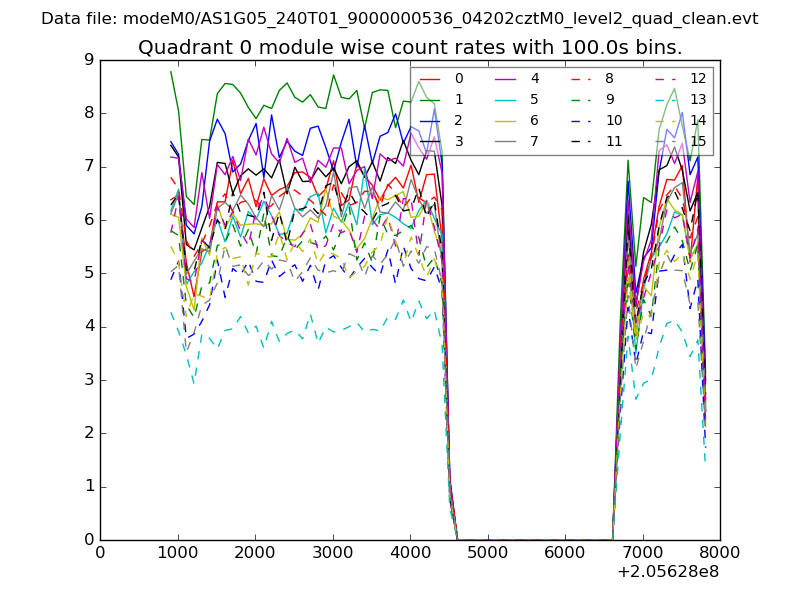 |
 |
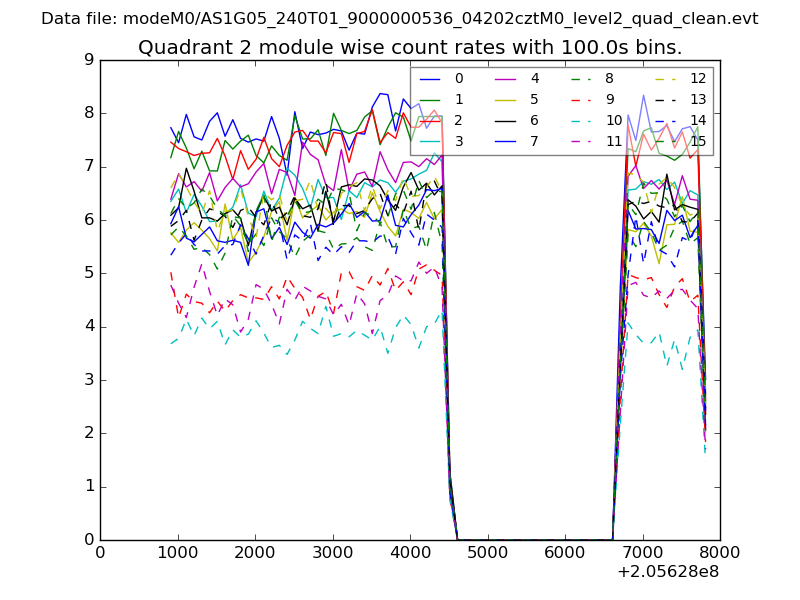
| Module-wise count rates for Quadrant B Data is divided into 100 sec bins |
 |
 |
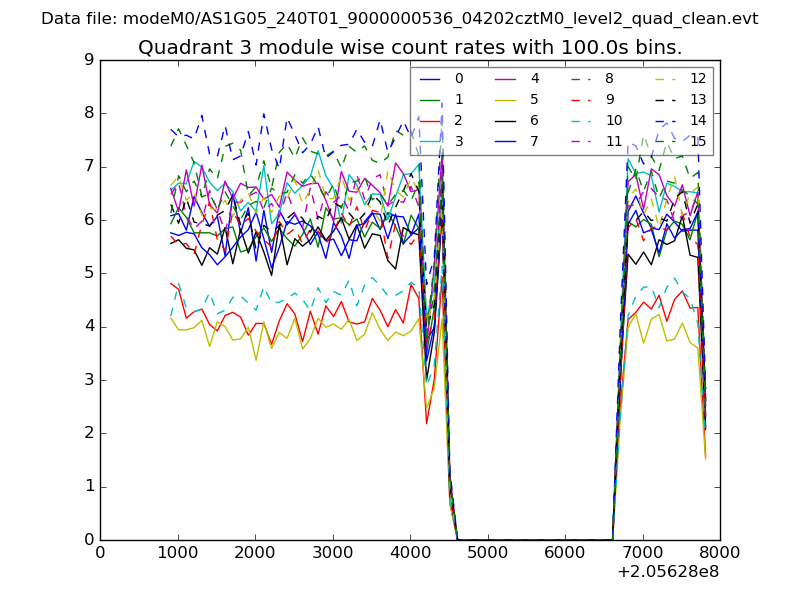
| Module-wise count rates for Quadrant C Data is divided into 100 sec bins |
 |
 |
| Module-wise count rates for Quadrant D Data is divided into 100 sec bins |
 |
 |
| Parameter | Plot |
|---|---|
| CZT HV Monitor | 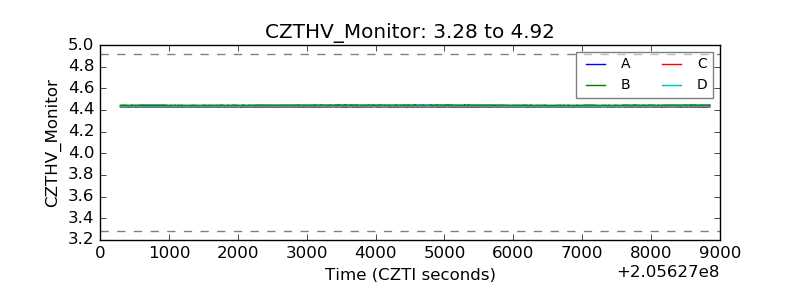 |
| D_VDD | 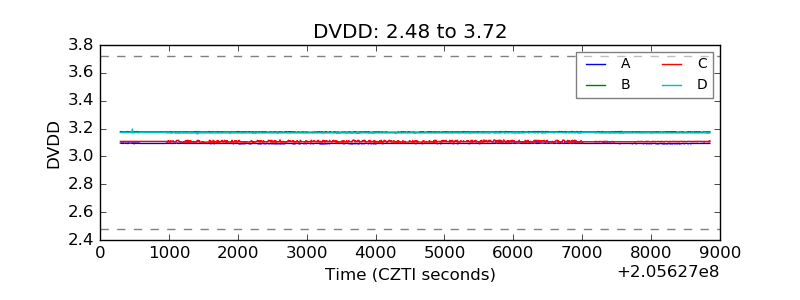 |
| Temperature 1 | 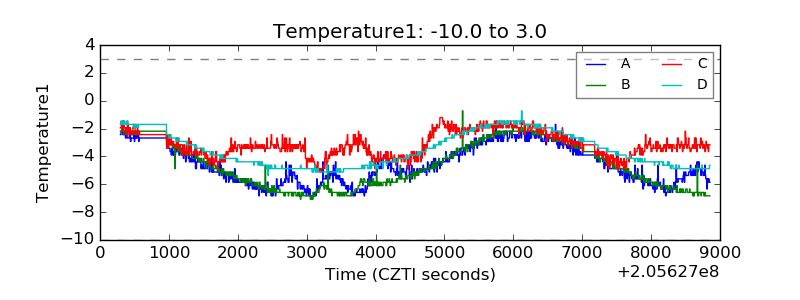 |
| Veto HV Monitor | 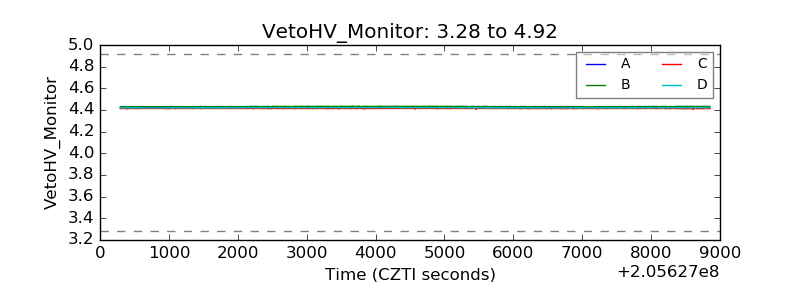 |
| Veto LLD | 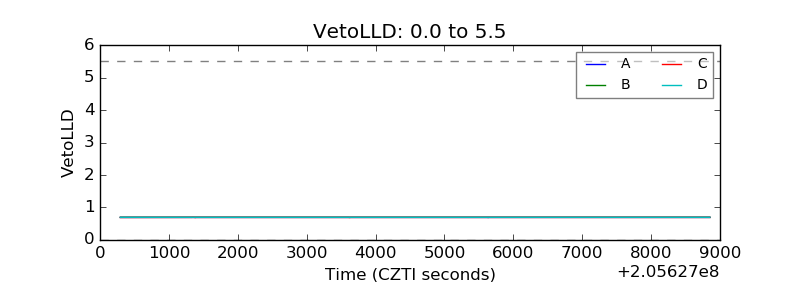 |
| Alpha Counter | 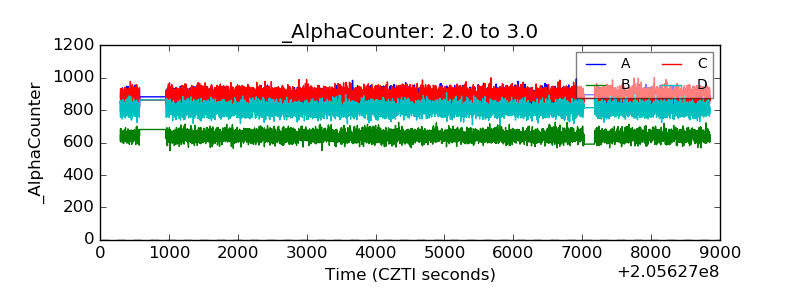 |
| _CPM_Rate | 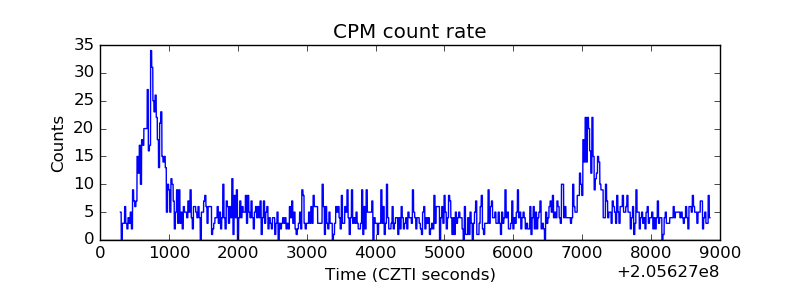 |
| CZT Counter | 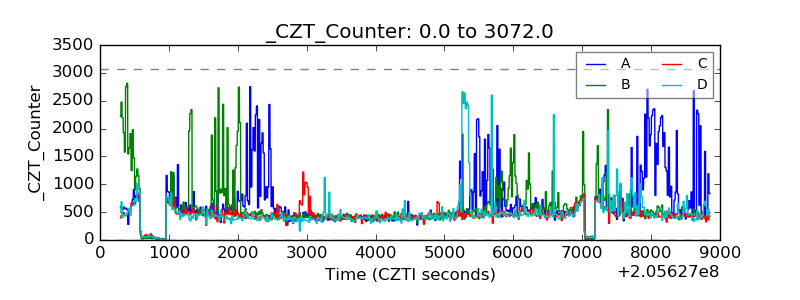 |
| +2.5 Volts monitor |  |
| +5 Volts monitor |  |
| _ROLL_ROT | 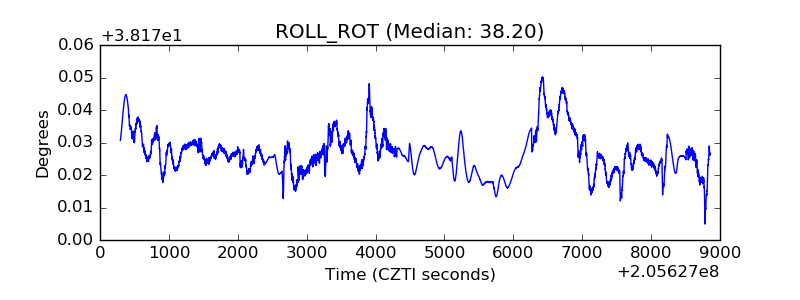 |
| _Roll_DEC | 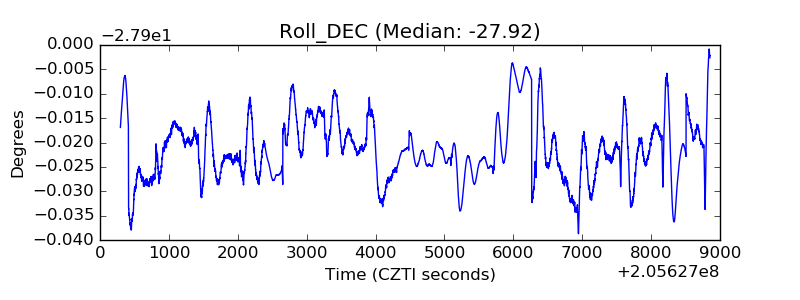 |
| _Roll_RA | 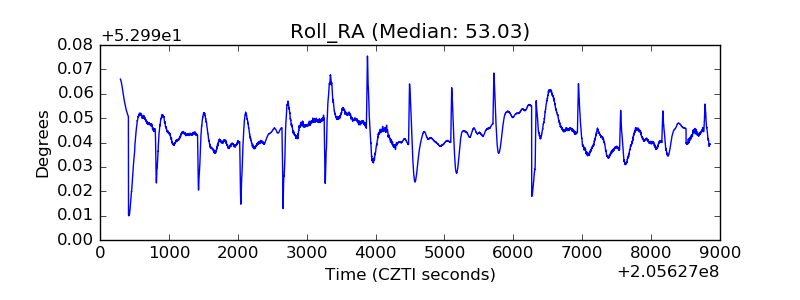 |
| Veto Counter | 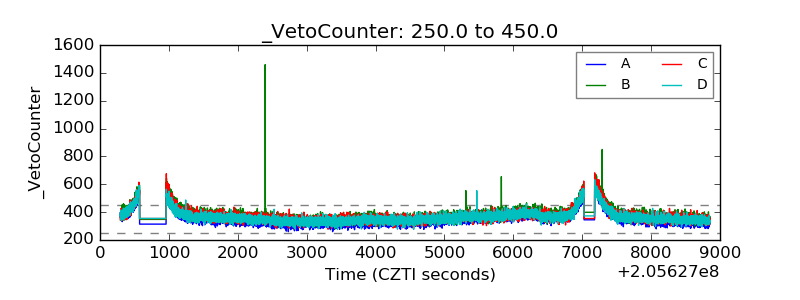 |