| Param | Original file | Final file |
|---|---|---|
| Filename | modeM0/AS1G05_240T01_9000000536_04203cztM0_level2.evt | modeM0/AS1G05_240T01_9000000536_04203cztM0_level2_quad_clean.evt |
| Size (bytes) | 683,677,440 | 84,435,840 |
| Size | 652.0 MB | 80.5 MB |
| Events in quadrant A | 6,380,062 | 478,117 |
| Events in quadrant B | 5,402,234 | 503,400 |
| Events in quadrant C | 4,465,222 | 503,701 |
| Events in quadrant D | 3,891,752 | 490,895 |
| Mode SS | |||
|---|---|---|---|
| Quadrant | BADHDUFLAG | Total packets | Discarded packets |
| A | 0 | 174 | 0 |
| B | 0 | 174 | 0 |
| C | 0 | 174 | 0 |
| D | 0 | 174 | 0 |
| Mode M9 | |||
|---|---|---|---|
| Quadrant | BADHDUFLAG | Total packets | Discarded packets |
| A | 0 | 4 | 0 |
| B | 0 | 4 | 0 |
| C | 0 | 4 | 0 |
| D | 0 | 4 | 0 |
| Mode M0 | |||
|---|---|---|---|
| Quadrant | BADHDUFLAG | Total packets | Discarded packets |
| A | 0 | 24708 | 211 |
| B | 0 | 21888 | 131 |
| C | 0 | 19244 | 104 |
| D | 0 | 17809 | 70 |
| Quadrant | Total seconds | Saturated seconds | Saturation percentage |
|---|---|---|---|
| A | 8330 | 801 | 9.615846% |
| B | 8342 | 498 | 5.969791% |
| C | 8346 | 167 | 2.000959% |
| D | 8353 | 46 | 0.550700% |
Noise dominated data is calculated using 1-second bins in cleaned event files. If a bin has >2000 counts, and if more than 50% of those come from <1% of pixels, then it is considered to be noise-dominated and hence unusable.
| Quadrant | # 1 sec bins | Bins with >0 counts | Bins with >2000 counts | High rate bins dominated by noise | Noise dominated (total time) | Noise dominated (detector-on time) | Marked lightcurve |
|---|---|---|---|---|---|---|---|
| A | 8877 | 8384 | 483 | 483 | 5.44% | 5.76% | 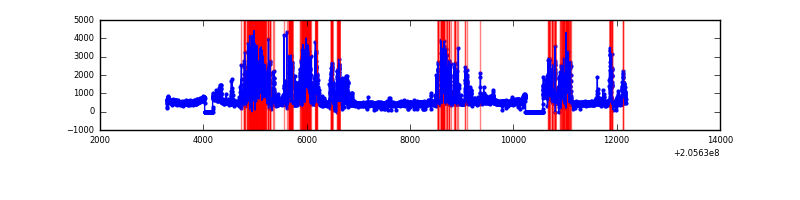 |
| B | 8877 | 8388 | 231 | 231 | 2.60% | 2.75% | 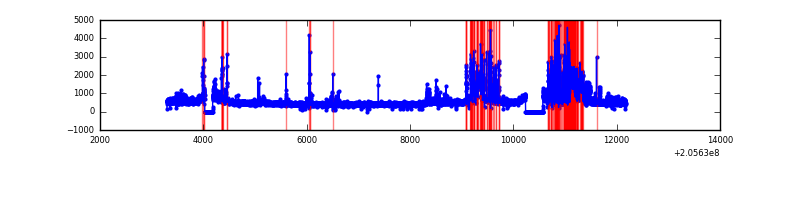 |
| C | 8877 | 8388 | 92 | 92 | 1.04% | 1.10% | 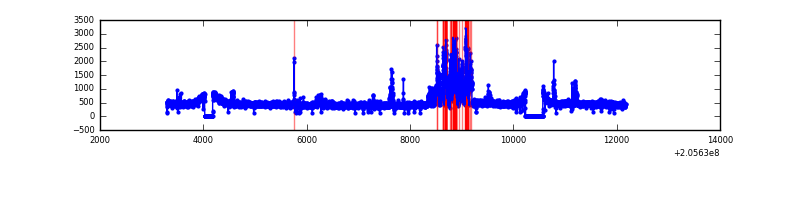 |
| D | 8877 | 8388 | 9 | 9 | 0.10% | 0.11% | 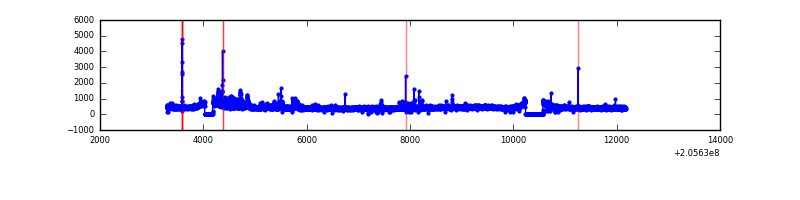 |
Top three noisy pixels from each quadrant. If the there are fewer than three noisy pixels in the level2.evt file, extra rows are filled as -1
| Pixel properties | Quadrant properties | ||||||
|---|---|---|---|---|---|---|---|
| Quadrant | DetID | PixID | Counts | Sigma | Mean | Median | Sigma |
| A | 0 | 50 | 2132071 | 10855.51 | 952 | 928 | 196.3 |
| A | 15 | 234 | 242301 | 1229.49 | 952 | 928 | 196.3 |
| A | 5 | 113 | 135212 | 684.01 | 952 | 928 | 196.3 |
| B | 3 | 0 | 1409144 | 7366.46 | 984 | 958 | 191.2 |
| B | 15 | 204 | 76229 | 393.76 | 984 | 958 | 191.2 |
| B | 8 | 3 | 46542 | 238.46 | 984 | 958 | 191.2 |
| C | 9 | 144 | 692276 | 3087.75 | 957 | 962 | 223.9 |
| C | 10 | 65 | 17544 | 74.06 | 957 | 962 | 223.9 |
| C | 8 | 128 | 8373 | 33.1 | 957 | 962 | 223.9 |
| D | 12 | 110 | 174104 | 739.81 | 956 | 927 | 234.1 |
| D | 13 | 239 | 56006 | 235.3 | 956 | 927 | 234.1 |
| D | 5 | 233 | 16092 | 64.79 | 956 | 927 | 234.1 |
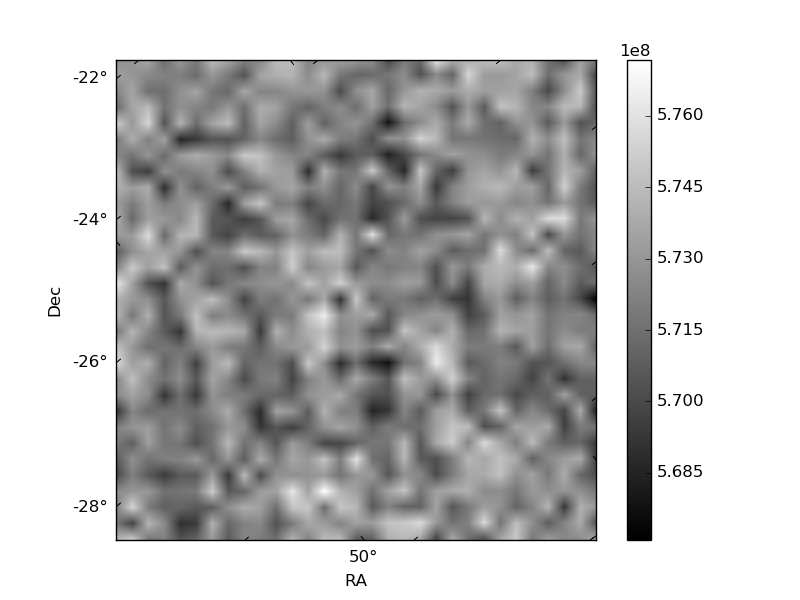
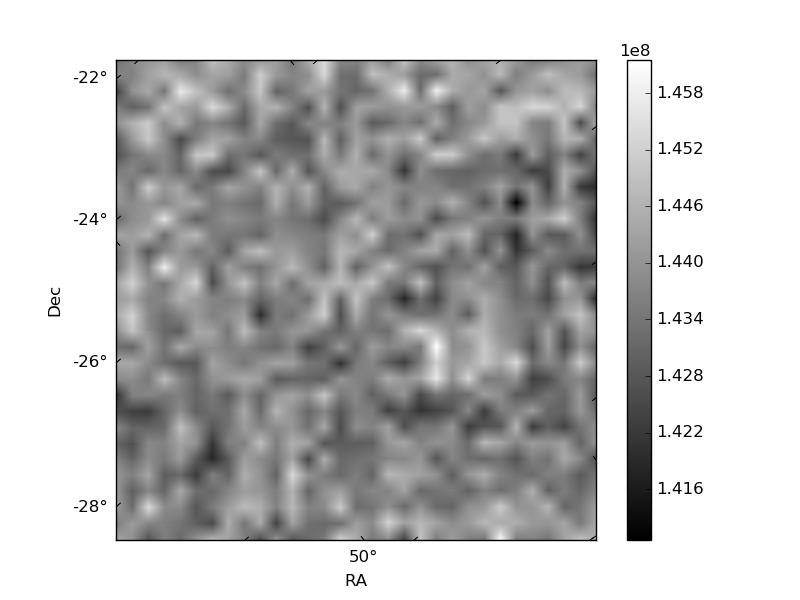
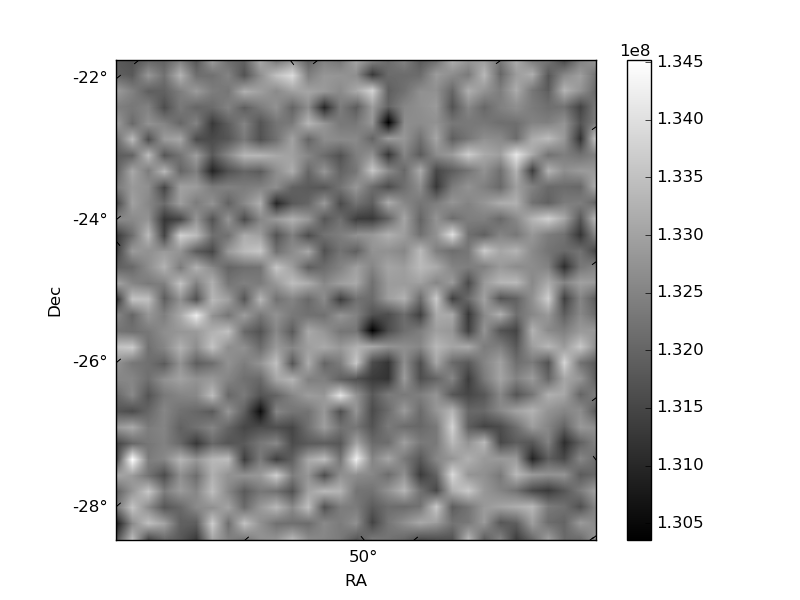
Histogram calculated using DETX and DETY for each event in the final _common_clean file
| Quadrant A | 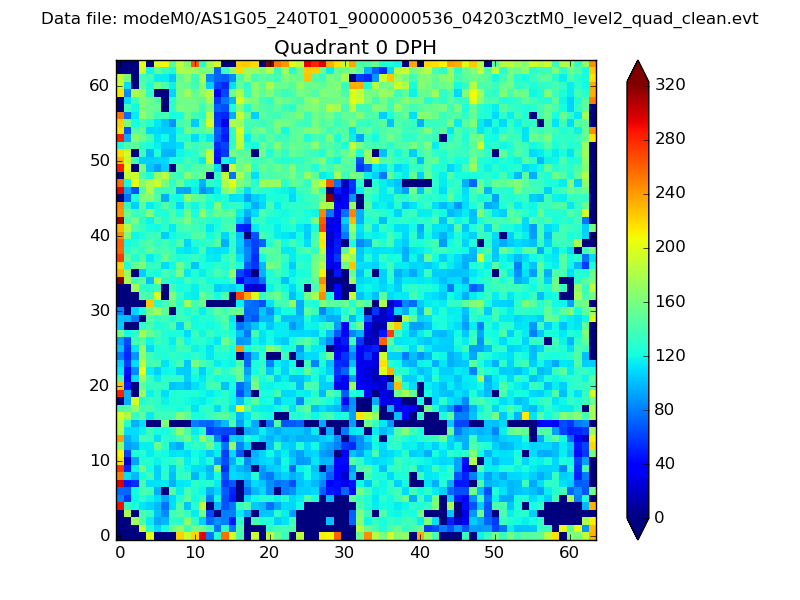 |
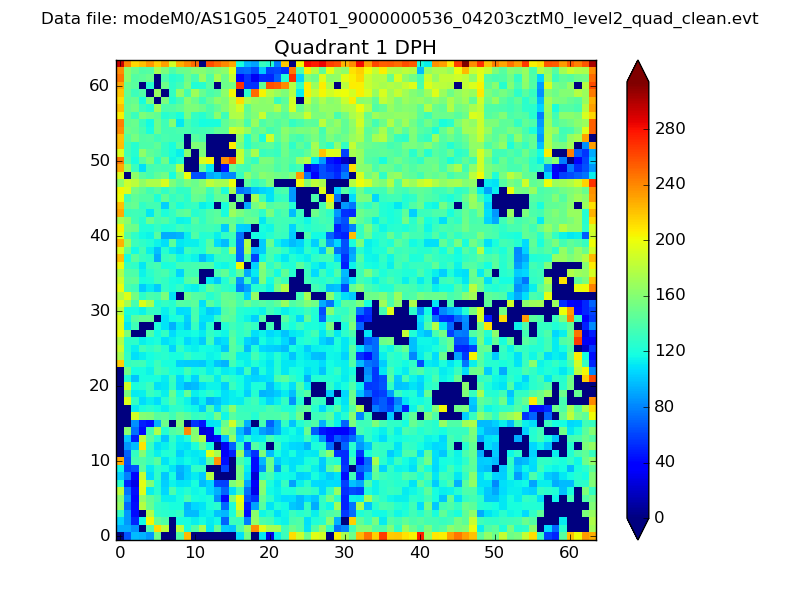 |
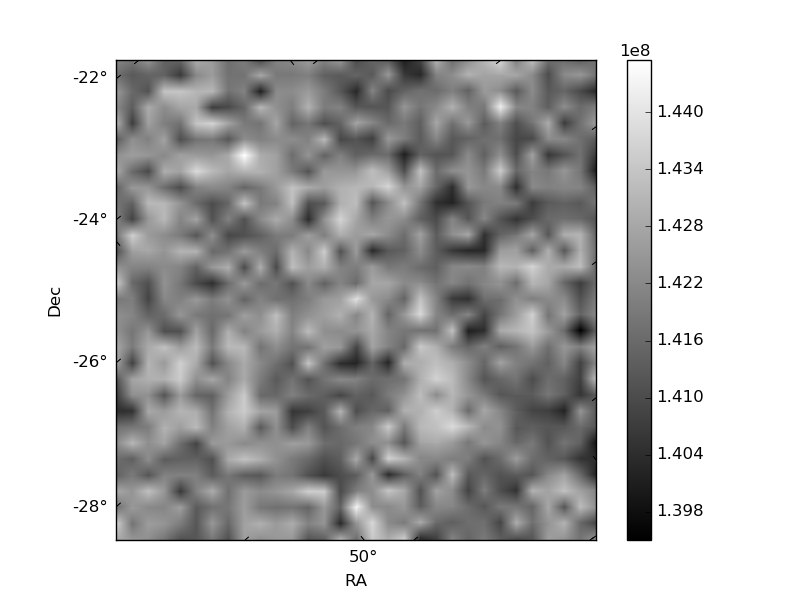
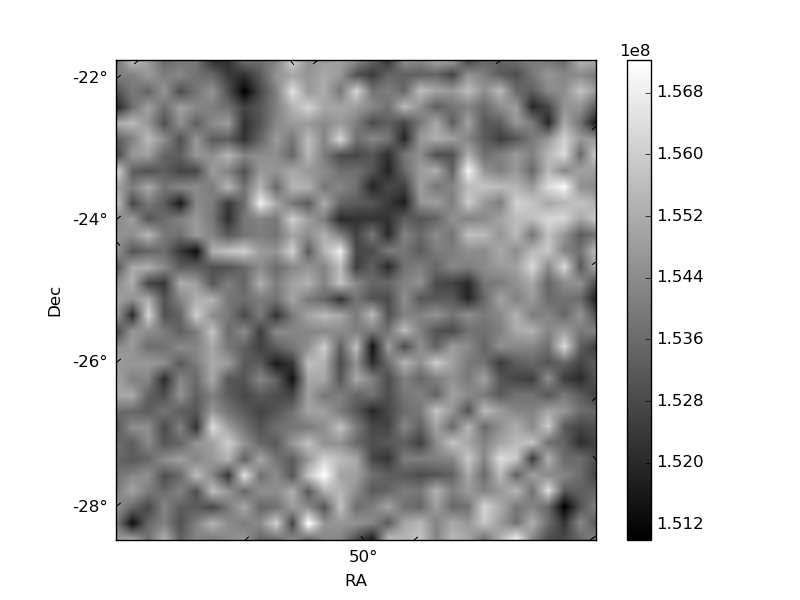
Quadrant B |
|---|---|---|---|
| Quadrant D | 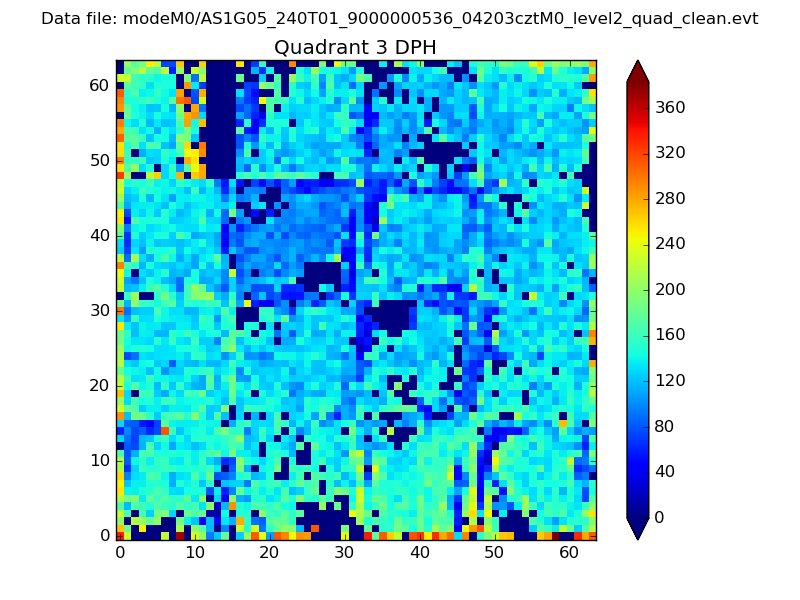 |
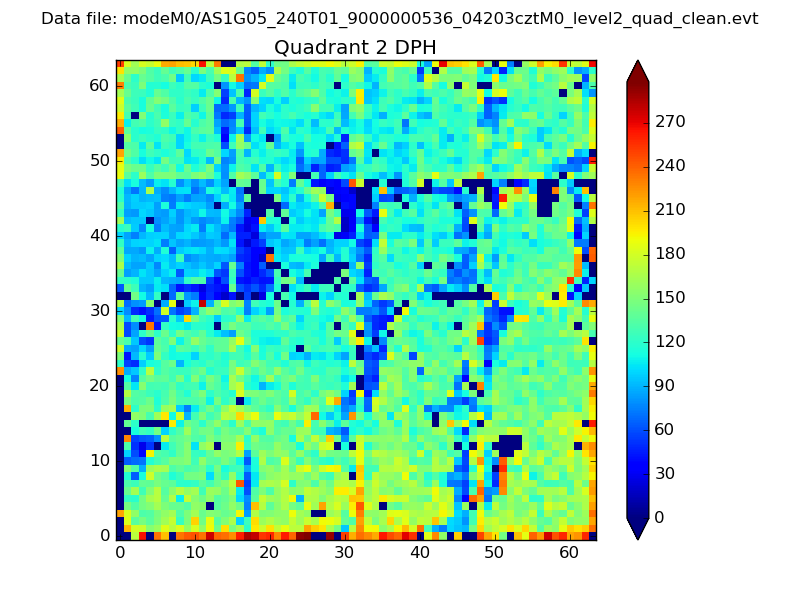 |
Quadrant C |
| Plot type | Count rate plots | Images |
|---|---|---|
| Comparison with Poisson distribution Blue bars denote a histogram of data divided into 1 sec bins. Red curve is a Poisson curve with rate = median count rate of data. |
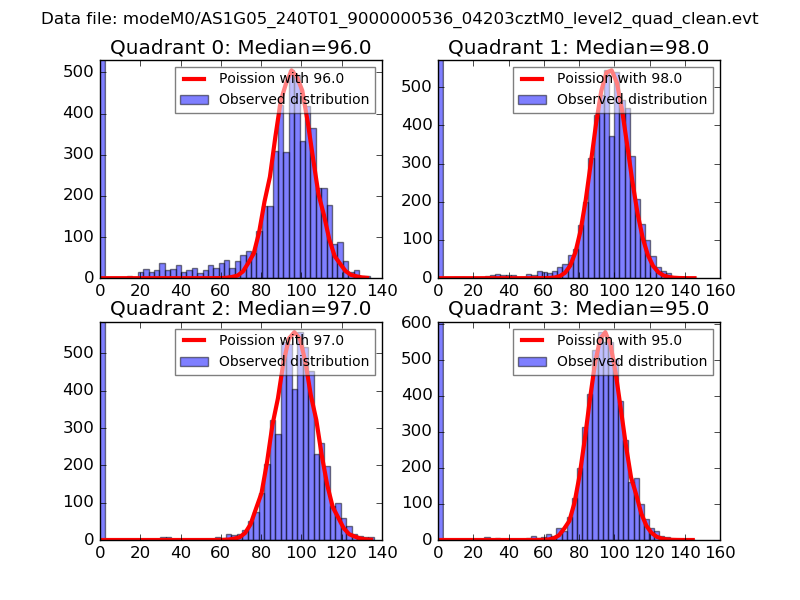 |
 |
| Quadrant-wise count rates Data is divided into 100 sec bins |
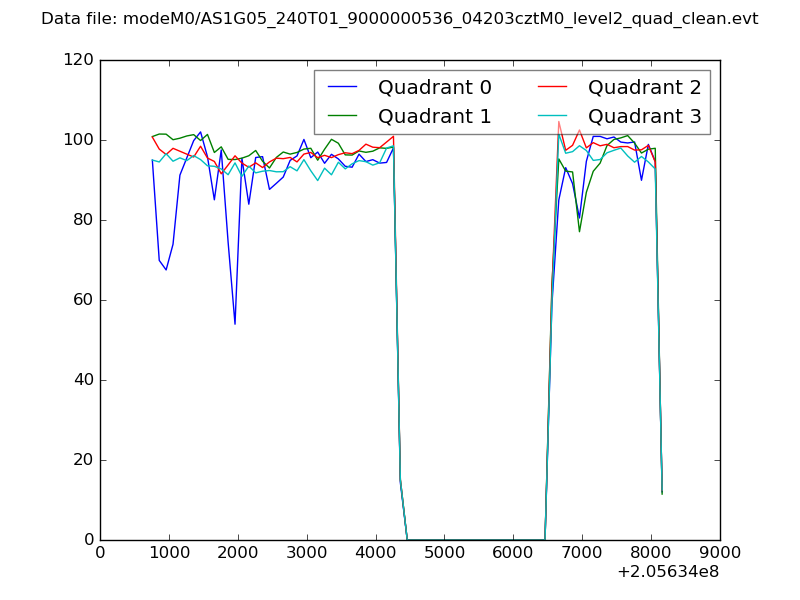 |
|
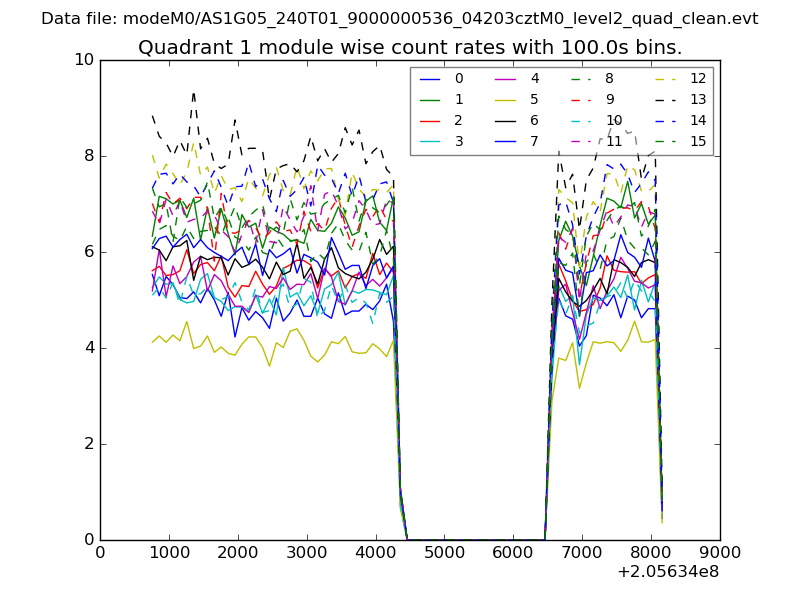
| Module-wise count rates for Quadrant A Data is divided into 100 sec bins |
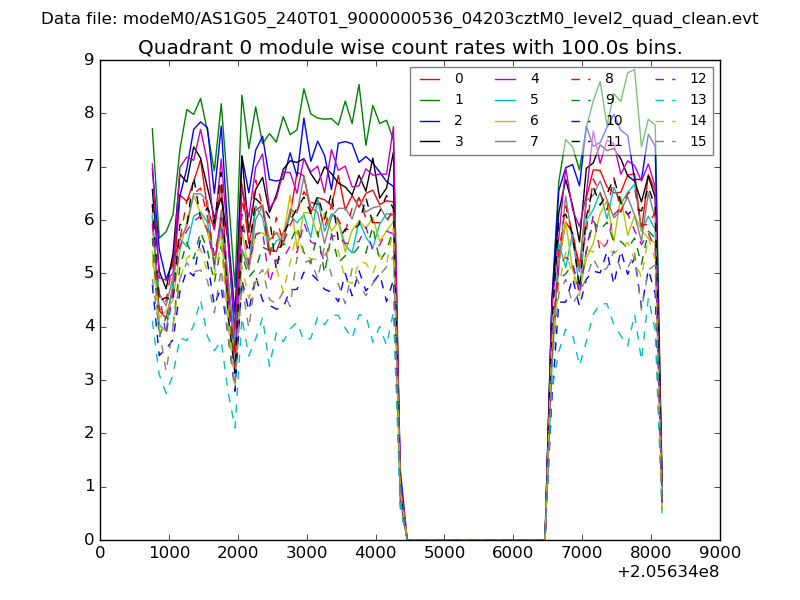 |
 |
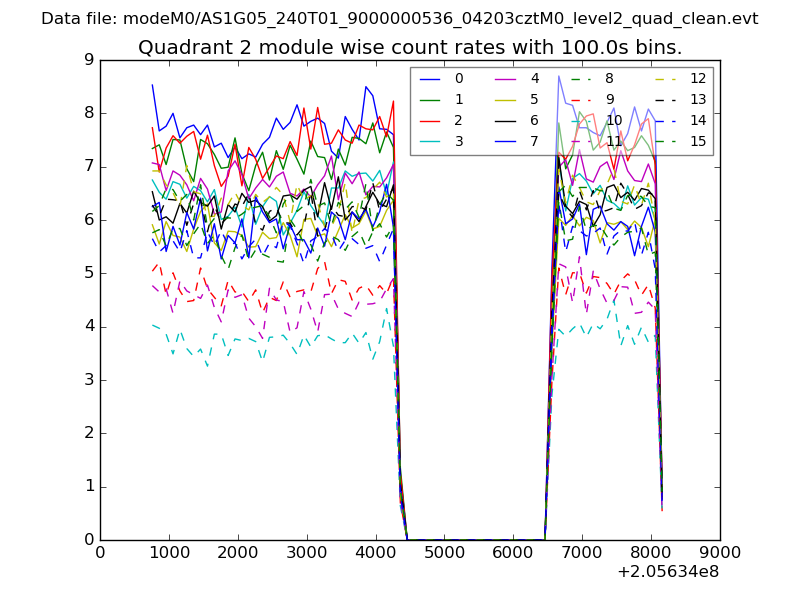
| Module-wise count rates for Quadrant B Data is divided into 100 sec bins |
 |
 |
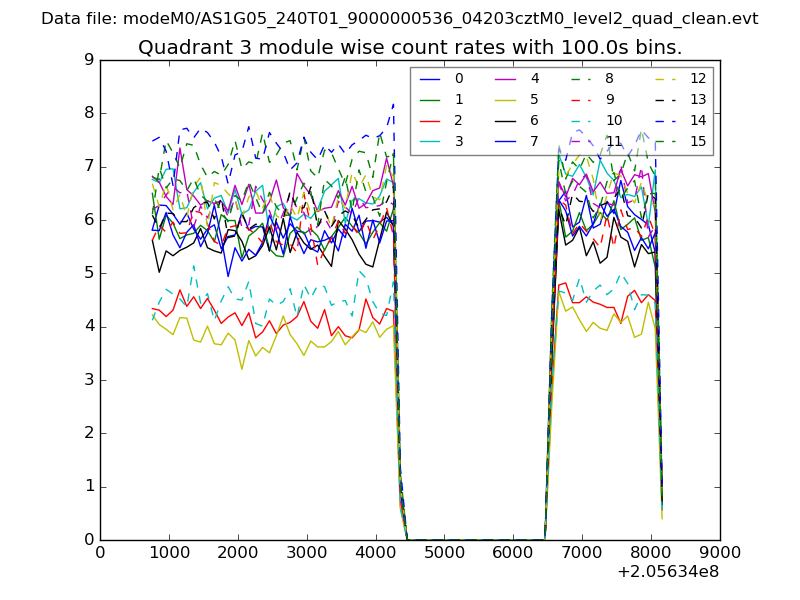
| Module-wise count rates for Quadrant C Data is divided into 100 sec bins |
 |
 |
| Module-wise count rates for Quadrant D Data is divided into 100 sec bins |
 |
 |
| Parameter | Plot |
|---|---|
| CZT HV Monitor | 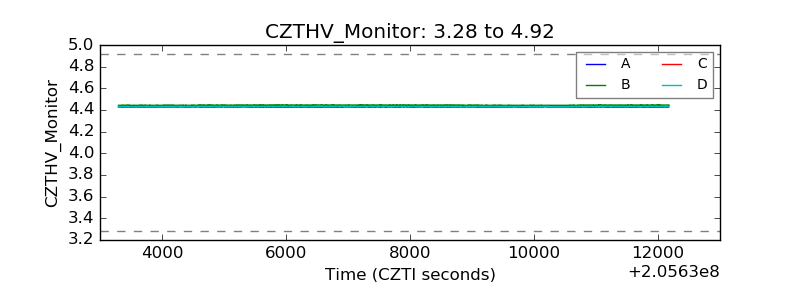 |
| D_VDD | 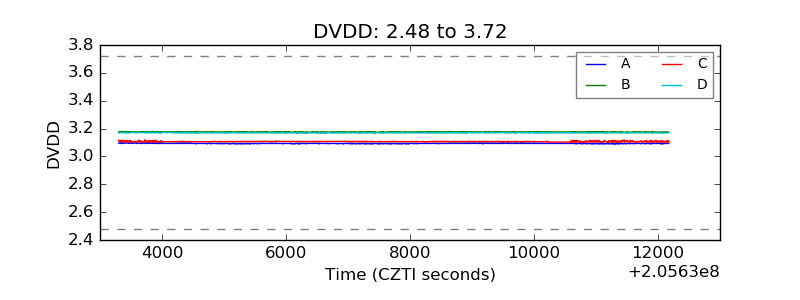 |
| Temperature 1 | 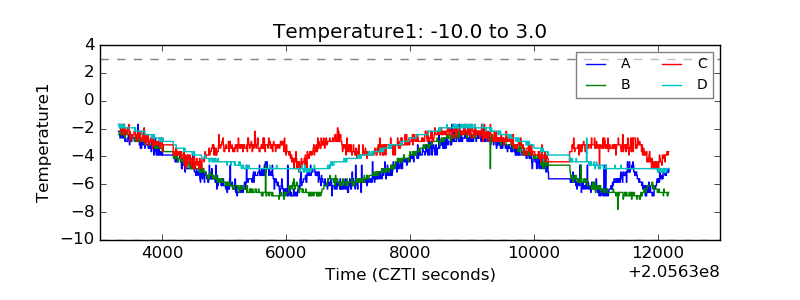 |
| Veto HV Monitor | 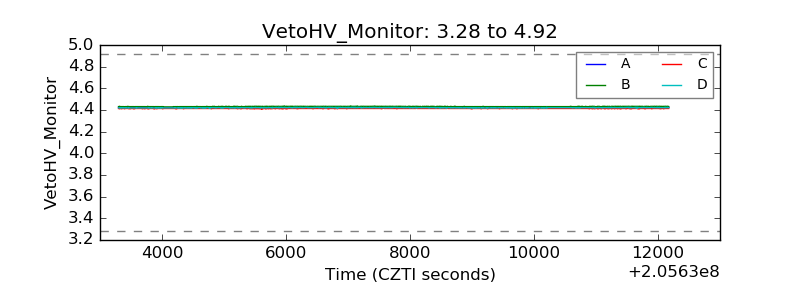 |
| Veto LLD | 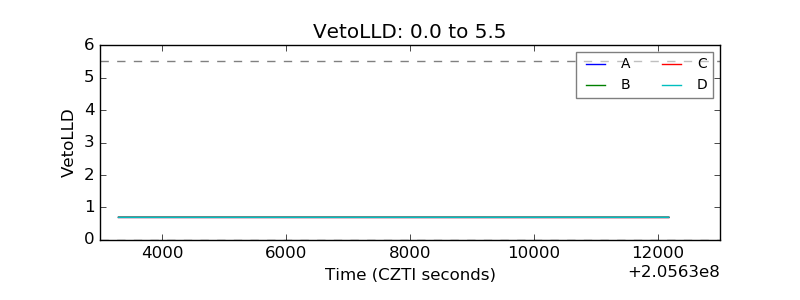 |
| Alpha Counter | 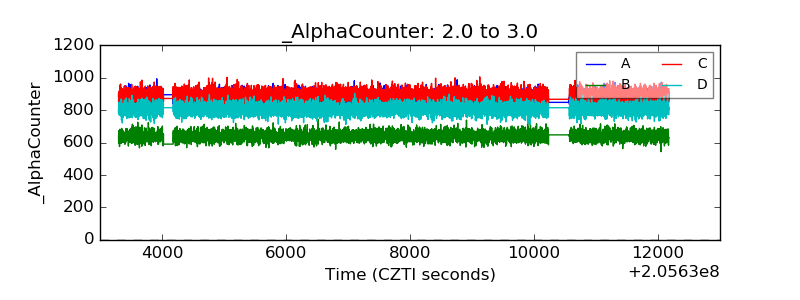 |
| _CPM_Rate | 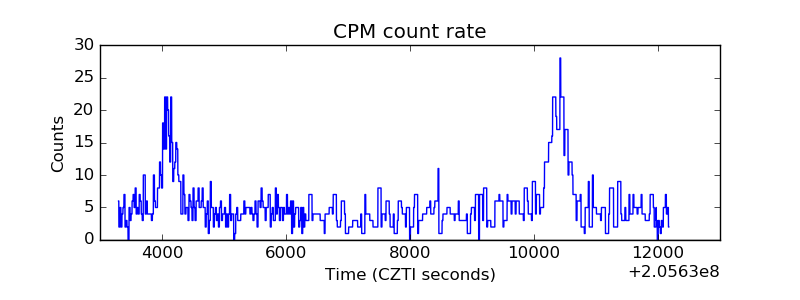 |
| CZT Counter |  |
| +2.5 Volts monitor |  |
| +5 Volts monitor |  |
| _ROLL_ROT | 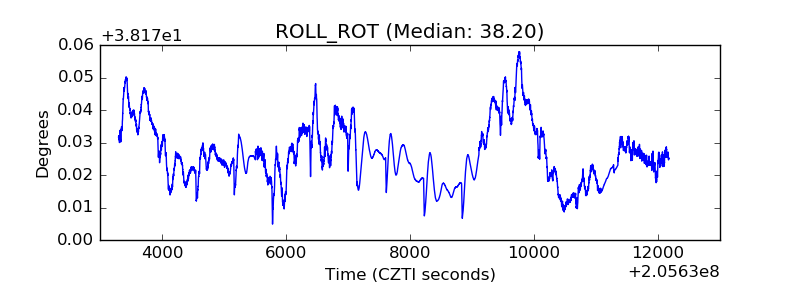 |
| _Roll_DEC | 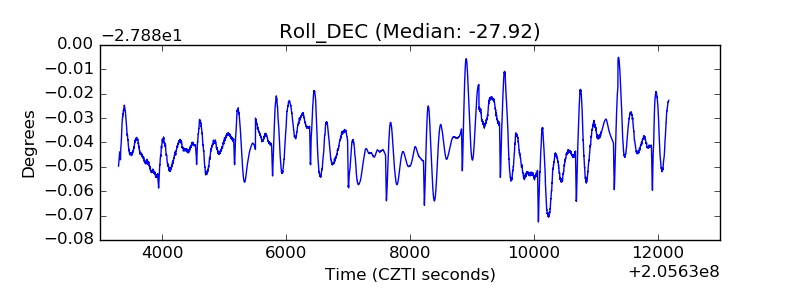 |
| _Roll_RA | 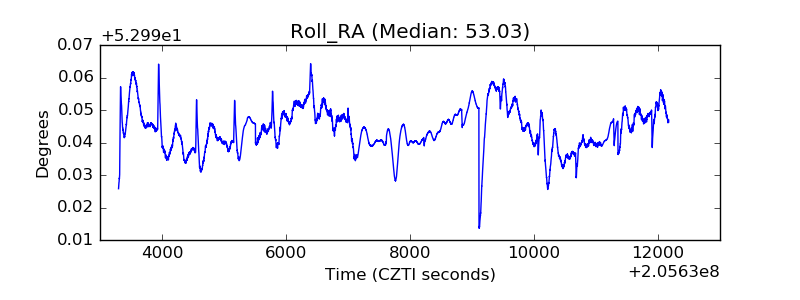 |
| Veto Counter | 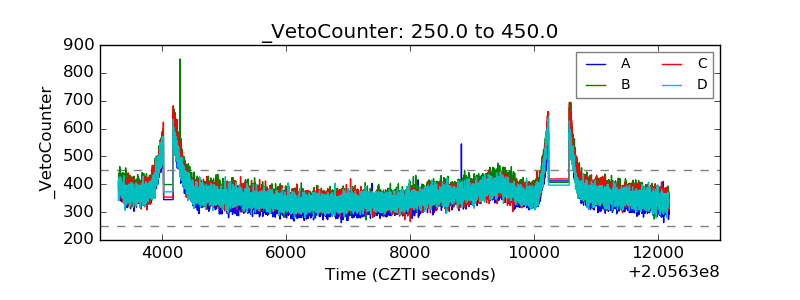 |