| Param | Original file | Final file |
|---|---|---|
| Filename | modeM0/AS1G05_240T01_9000000536_04205cztM0_level2.evt | modeM0/AS1G05_240T01_9000000536_04205cztM0_level2_quad_clean.evt |
| Size (bytes) | 809,988,480 | 101,903,040 |
| Size | 772.5 MB | 97.2 MB |
| Events in quadrant A | 6,766,414 | 616,114 |
| Events in quadrant B | 8,752,789 | 596,245 |
| Events in quadrant C | 4,504,235 | 627,056 |
| Events in quadrant D | 3,890,500 | 613,472 |
| Mode SS | |||
|---|---|---|---|
| Quadrant | BADHDUFLAG | Total packets | Discarded packets |
| A | 0 | 186 | 2 |
| B | 0 | 186 | 2 |
| C | 0 | 186 | 2 |
| D | 0 | 186 | 2 |
| Mode M9 | |||
|---|---|---|---|
| Quadrant | BADHDUFLAG | Total packets | Discarded packets |
| A | 0 | 5 | 0 |
| B | 0 | 5 | 0 |
| C | 0 | 5 | 0 |
| D | 0 | 5 | 0 |
| Mode M0 | |||
|---|---|---|---|
| Quadrant | BADHDUFLAG | Total packets | Discarded packets |
| A | 0 | 26612 | 237 |
| B | 0 | 32700 | 463 |
| C | 0 | 20033 | 195 |
| D | 0 | 18813 | 124 |
| Quadrant | Total seconds | Saturated seconds | Saturation percentage |
|---|---|---|---|
| A | 9117 | 838 | 9.191620% |
| B | 9097 | 1144 | 12.575574% |
| C | 9120 | 41 | 0.449561% |
| D | 9128 | 27 | 0.295793% |
Noise dominated data is calculated using 1-second bins in cleaned event files. If a bin has >2000 counts, and if more than 50% of those come from <1% of pixels, then it is considered to be noise-dominated and hence unusable.
| Quadrant | # 1 sec bins | Bins with >0 counts | Bins with >2000 counts | High rate bins dominated by noise | Noise dominated (total time) | Noise dominated (detector-on time) | Marked lightcurve |
|---|---|---|---|---|---|---|---|
| A | 9684 | 9188 | 587 | 587 | 6.06% | 6.39% | 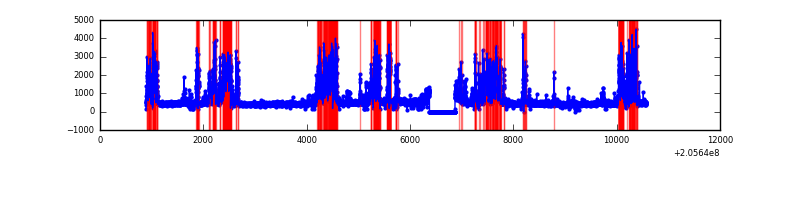 |
| B | 9684 | 9185 | 815 | 815 | 8.42% | 8.87% | 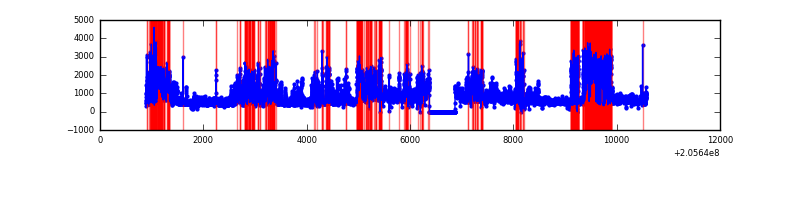 |
| C | 9684 | 9182 | 5 | 5 | 0.05% | 0.05% |  |
| D | 9684 | 9188 | 4 | 4 | 0.04% | 0.04% |  |
Top three noisy pixels from each quadrant. If the there are fewer than three noisy pixels in the level2.evt file, extra rows are filled as -1
| Pixel properties | Quadrant properties | ||||||
|---|---|---|---|---|---|---|---|
| Quadrant | DetID | PixID | Counts | Sigma | Mean | Median | Sigma |
| A | 0 | 50 | 2003725 | 9935.16 | 982 | 956 | 201.6 |
| A | 15 | 234 | 488003 | 2416.1 | 982 | 956 | 201.6 |
| A | 5 | 113 | 249140 | 1231.17 | 982 | 956 | 201.6 |
| B | 3 | 0 | 3720826 | 19282.37 | 997 | 974 | 192.9 |
| B | 14 | 167 | 1008210 | 5221.15 | 997 | 974 | 192.9 |
| B | 15 | 204 | 64361 | 328.58 | 997 | 974 | 192.9 |
| C | 9 | 144 | 566078 | 2430.27 | 998 | 1006 | 232.5 |
| C | 8 | 128 | 18378 | 74.71 | 998 | 1006 | 232.5 |
| C | 13 | 61 | 8145 | 30.7 | 998 | 1006 | 232.5 |
| D | 13 | 239 | 81336 | 335.01 | 995 | 968 | 239.9 |
| D | 13 | 223 | 21757 | 86.66 | 995 | 968 | 239.9 |
| D | 2 | 14 | 12959 | 49.98 | 995 | 968 | 239.9 |
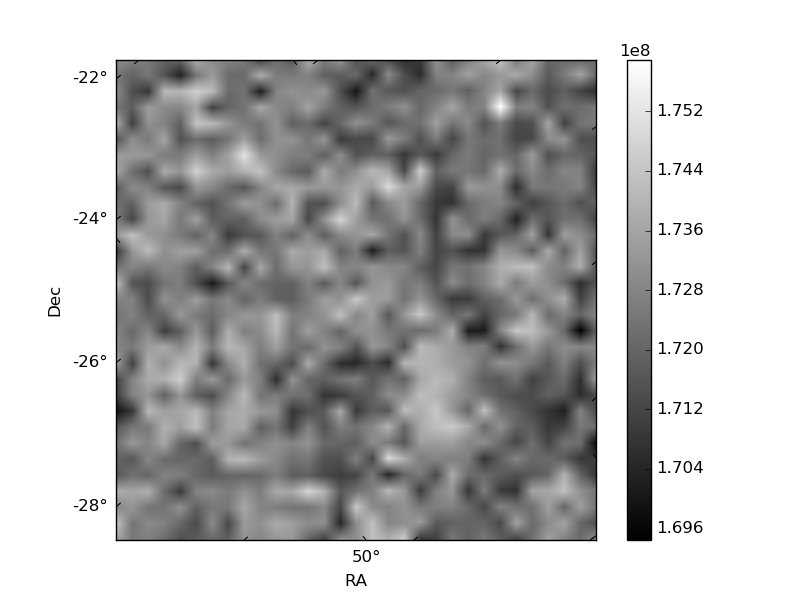
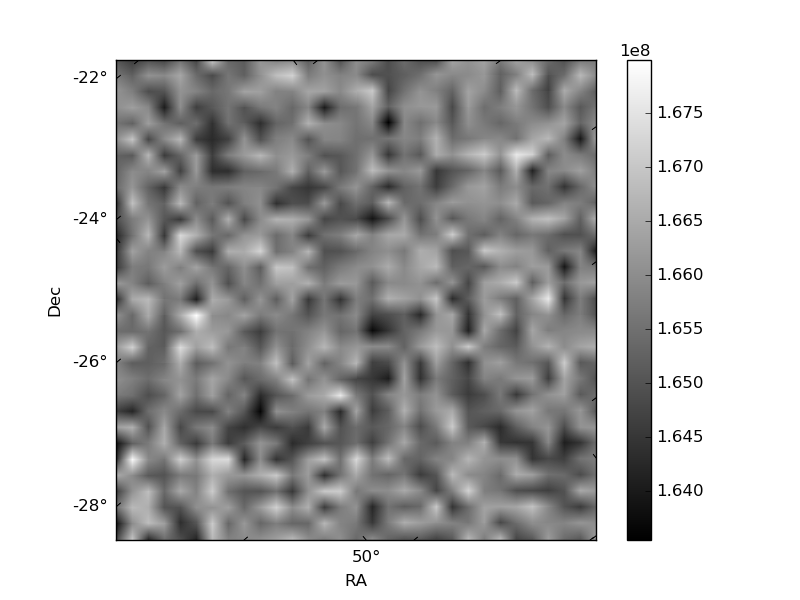
Histogram calculated using DETX and DETY for each event in the final _common_clean file
| Quadrant A | 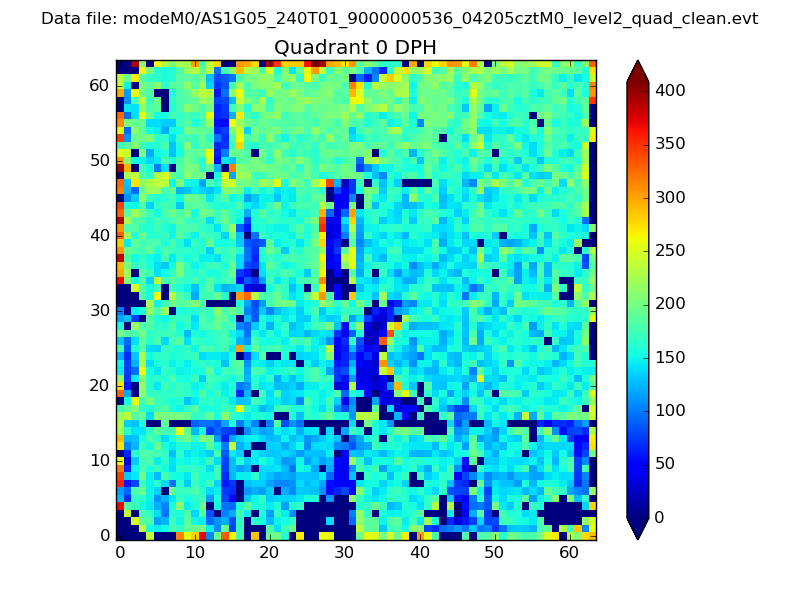 |
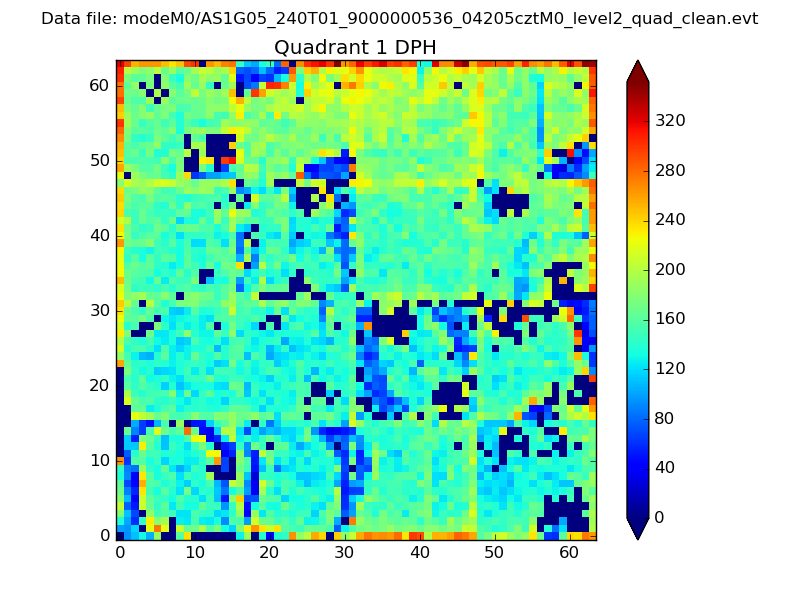 |
Quadrant B |
|---|---|---|---|
| Quadrant D |  |
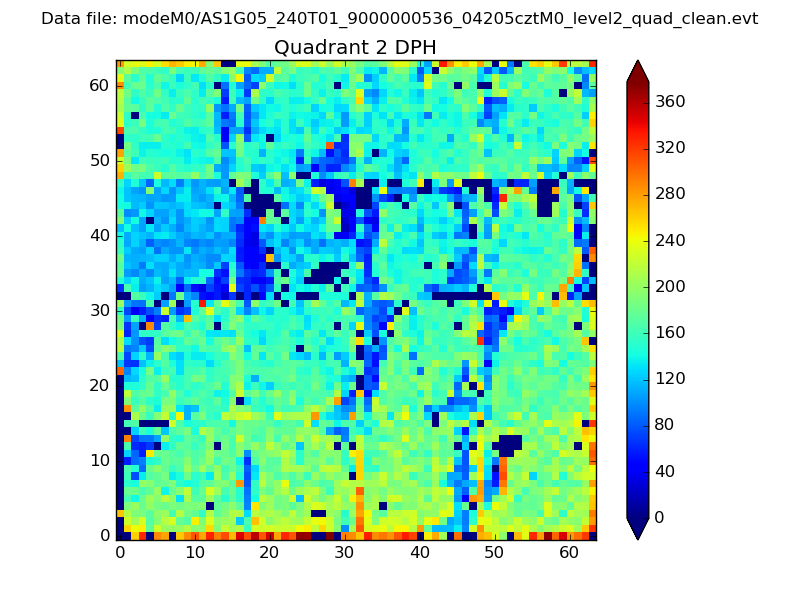 |
Quadrant C |
| Plot type | Count rate plots | Images |
|---|---|---|
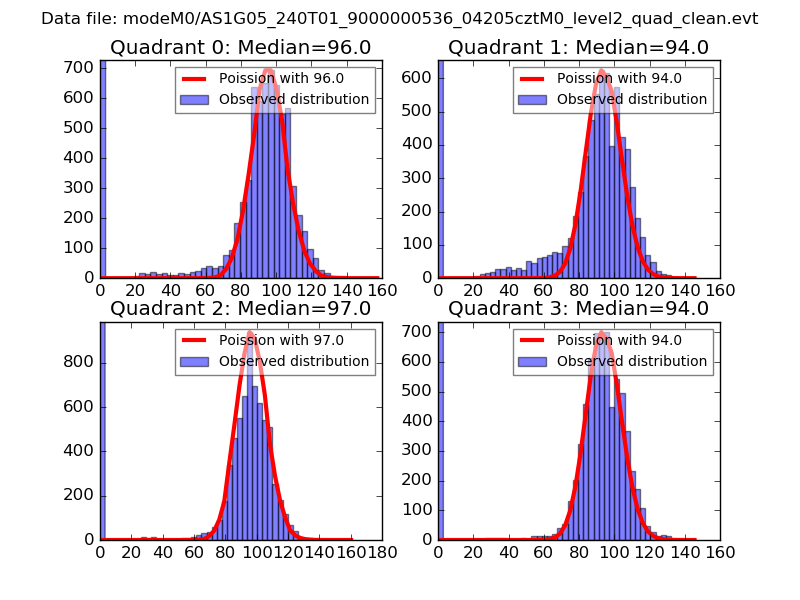
| Comparison with Poisson distribution Blue bars denote a histogram of data divided into 1 sec bins. Red curve is a Poisson curve with rate = median count rate of data. |
 |
 |
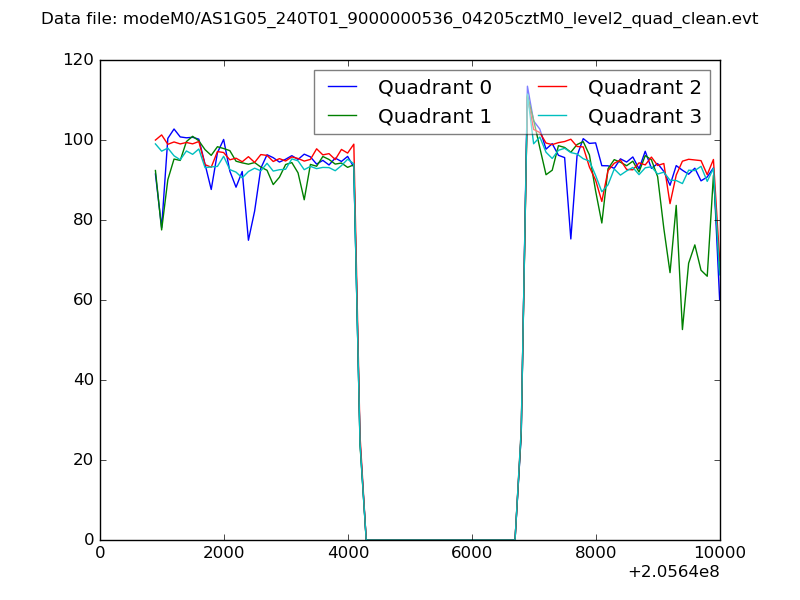
| Quadrant-wise count rates Data is divided into 100 sec bins |
 |
|
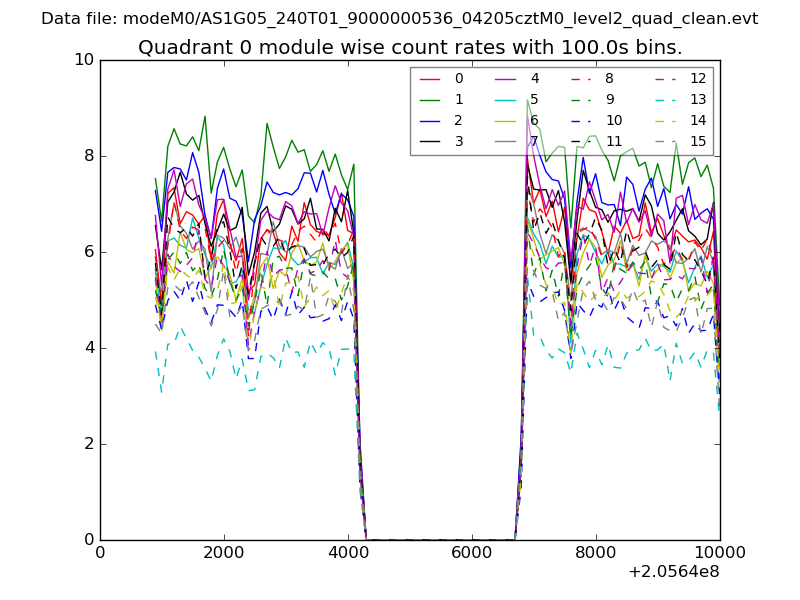
| Module-wise count rates for Quadrant A Data is divided into 100 sec bins |
 |
 |
| Module-wise count rates for Quadrant B Data is divided into 100 sec bins |
 |
 |
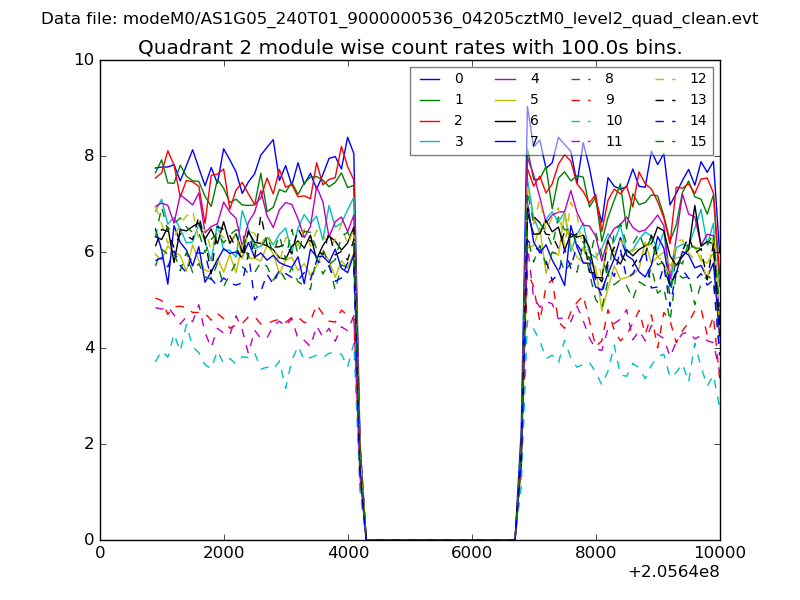
| Module-wise count rates for Quadrant C Data is divided into 100 sec bins |
 |
 |
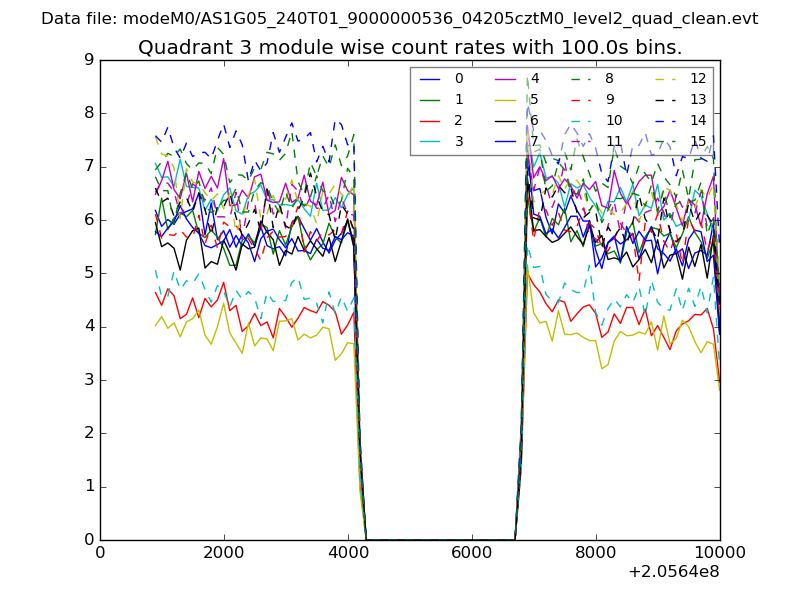
| Module-wise count rates for Quadrant D Data is divided into 100 sec bins |
 |
 |
| Parameter | Plot |
|---|---|
| CZT HV Monitor | 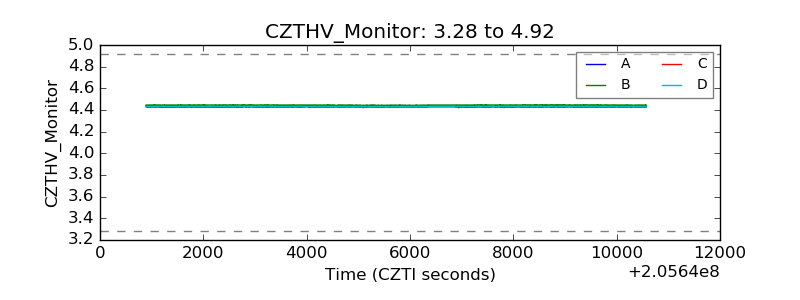 |
| D_VDD | 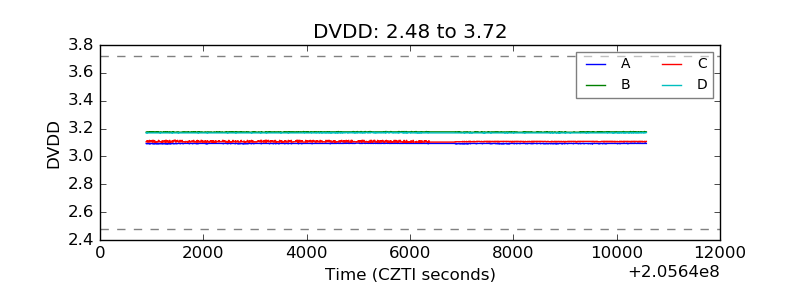 |
| Temperature 1 | 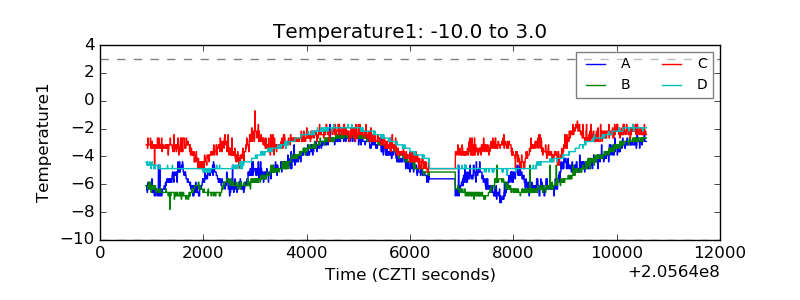 |
| Veto HV Monitor | 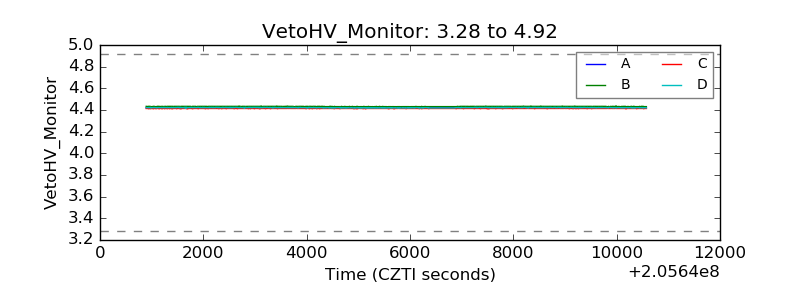 |
| Veto LLD | 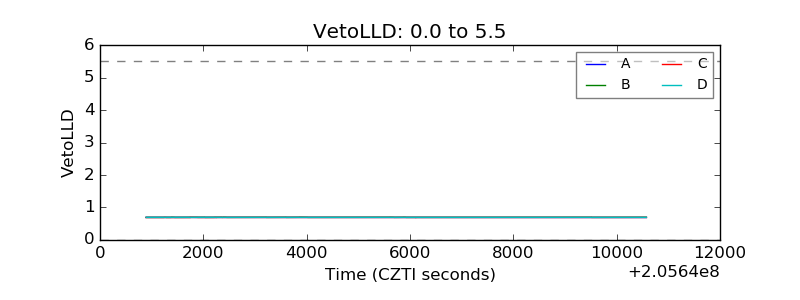 |
| Alpha Counter | 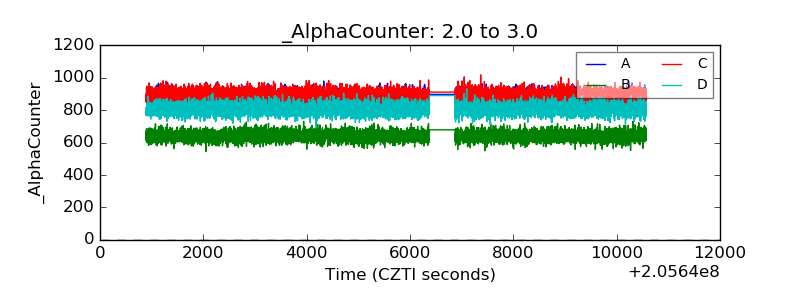 |
| _CPM_Rate | 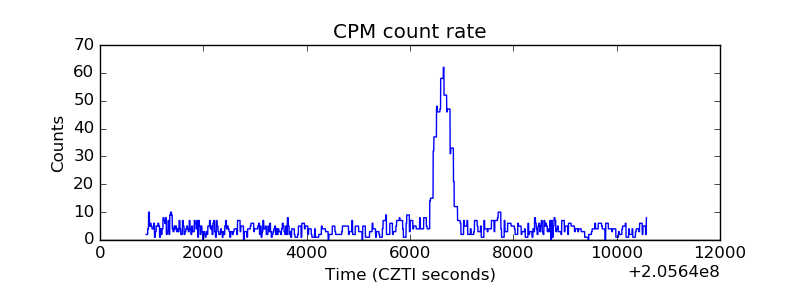 |
| CZT Counter | 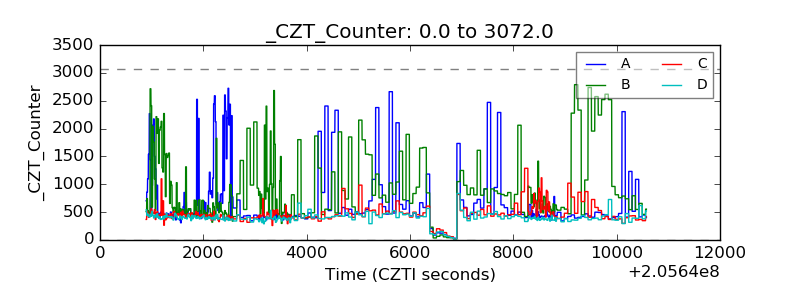 |
| +2.5 Volts monitor |  |
| +5 Volts monitor |  |
| _ROLL_ROT | 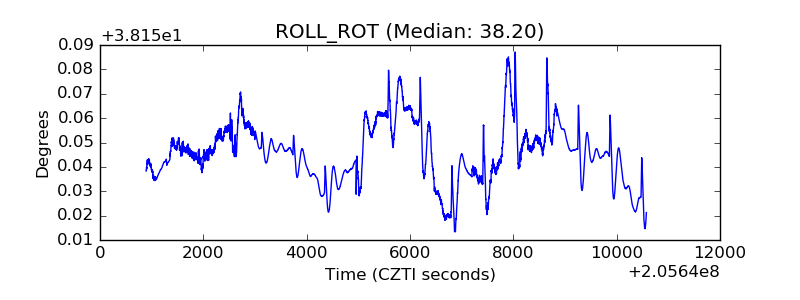 |
| _Roll_DEC | 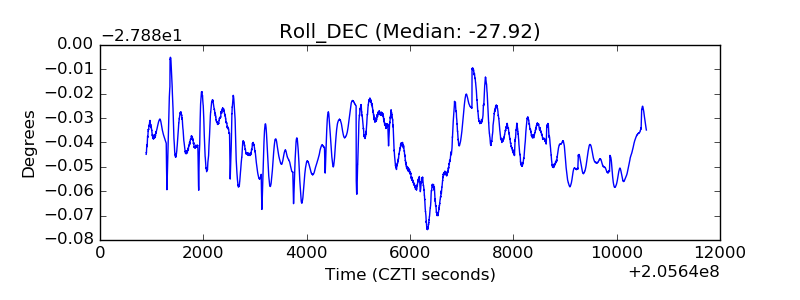 |
| _Roll_RA | 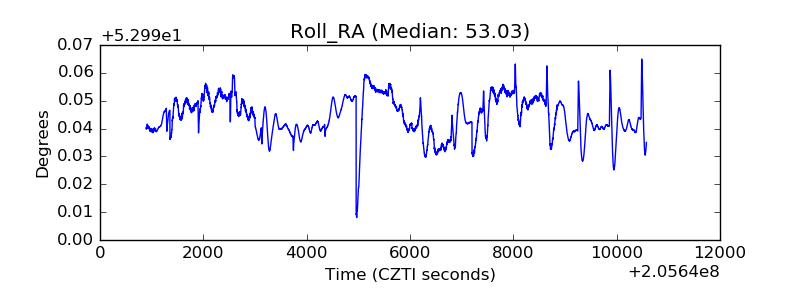 |
| Veto Counter | 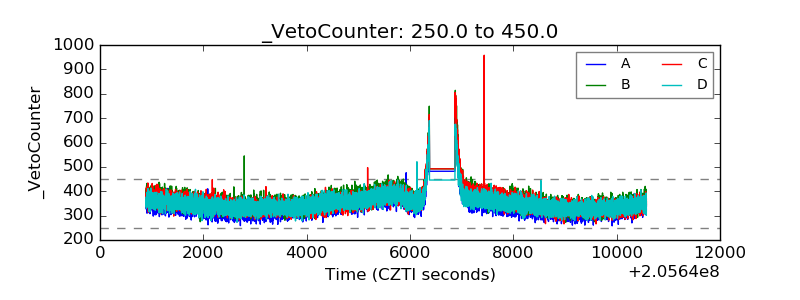 |