| Param | Original file | Final file |
|---|---|---|
| Filename | modeM0/AS1G05_240T01_9000000536_04207cztM0_level2.evt | modeM0/AS1G05_240T01_9000000536_04207cztM0_level2_quad_clean.evt |
| Size (bytes) | 465,387,840 | 77,673,600 |
| Size | 443.8 MB | 74.1 MB |
| Events in quadrant A | 3,435,611 | 481,200 |
| Events in quadrant B | 3,557,484 | 480,888 |
| Events in quadrant C | 3,226,715 | 475,542 |
| Events in quadrant D | 3,425,739 | 453,856 |
| Mode SS | |||
|---|---|---|---|
| Quadrant | BADHDUFLAG | Total packets | Discarded packets |
| A | 0 | 134 | 0 |
| B | 0 | 134 | 0 |
| C | 0 | 134 | 0 |
| D | 0 | 134 | 0 |
| Mode M9 | |||
|---|---|---|---|
| Quadrant | BADHDUFLAG | Total packets | Discarded packets |
| A | 0 | 9 | 0 |
| B | 0 | 9 | 0 |
| C | 0 | 9 | 0 |
| D | 0 | 9 | 0 |
| Mode M0 | |||
|---|---|---|---|
| Quadrant | BADHDUFLAG | Total packets | Discarded packets |
| A | 0 | 14620 | 26 |
| B | 0 | 14928 | 24 |
| C | 0 | 14218 | 23 |
| D | 0 | 15007 | 9 |
| Quadrant | Total seconds | Saturated seconds | Saturation percentage |
|---|---|---|---|
| A | 6601 | 128 | 1.939100% |
| B | 6602 | 87 | 1.317782% |
| C | 6602 | 81 | 1.226901% |
| D | 6608 | 240 | 3.631961% |
Noise dominated data is calculated using 1-second bins in cleaned event files. If a bin has >2000 counts, and if more than 50% of those come from <1% of pixels, then it is considered to be noise-dominated and hence unusable.
| Quadrant | # 1 sec bins | Bins with >0 counts | Bins with >2000 counts | High rate bins dominated by noise | Noise dominated (total time) | Noise dominated (detector-on time) | Marked lightcurve |
|---|---|---|---|---|---|---|---|
| A | 7582 | 6610 | 44 | 44 | 0.58% | 0.67% | 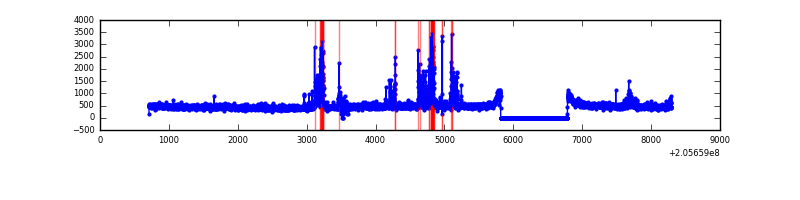 |
| B | 7582 | 6613 | 8 | 8 | 0.11% | 0.12% | 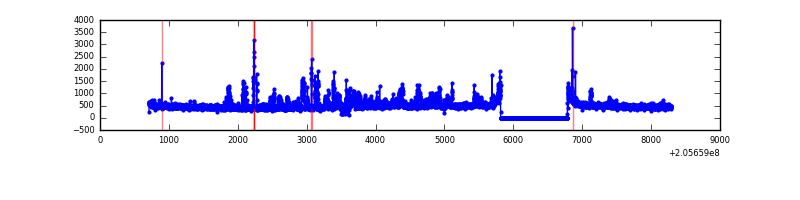 |
| C | 7582 | 6612 | 31 | 31 | 0.41% | 0.47% | 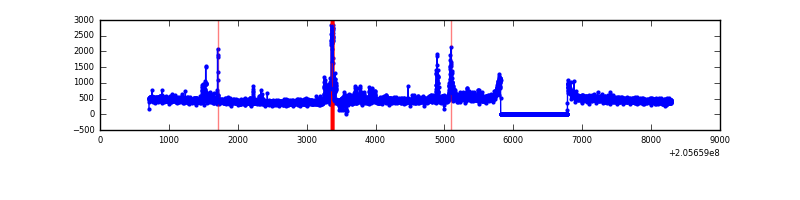 |
| D | 7581 | 6611 | 164 | 164 | 2.16% | 2.48% | 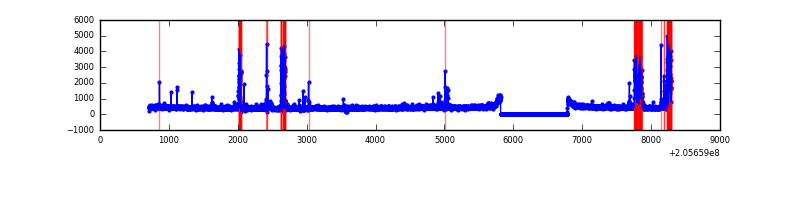 |
Top three noisy pixels from each quadrant. If the there are fewer than three noisy pixels in the level2.evt file, extra rows are filled as -1
| Pixel properties | Quadrant properties | ||||||
|---|---|---|---|---|---|---|---|
| Quadrant | DetID | PixID | Counts | Sigma | Mean | Median | Sigma |
| A | 0 | 50 | 304328 | 1938.81 | 770 | 753 | 156.6 |
| A | 15 | 234 | 73684 | 465.78 | 770 | 753 | 156.6 |
| A | 13 | 14 | 32643 | 203.67 | 770 | 753 | 156.6 |
| B | 3 | 0 | 417587 | 2762.45 | 775 | 757 | 150.9 |
| B | 15 | 204 | 52278 | 341.44 | 775 | 757 | 150.9 |
| B | 15 | 54 | 16746 | 105.96 | 775 | 757 | 150.9 |
| C | 9 | 144 | 291130 | 1649.85 | 749 | 753 | 176.0 |
| C | 14 | 67 | 7122 | 36.18 | 749 | 753 | 176.0 |
| C | 13 | 61 | 6139 | 30.6 | 749 | 753 | 176.0 |
| D | 13 | 239 | 561594 | 3142.2 | 741 | 720 | 178.5 |
| D | 2 | 14 | 12608 | 66.6 | 741 | 720 | 178.5 |
| D | 13 | 223 | 11289 | 59.21 | 741 | 720 | 178.5 |
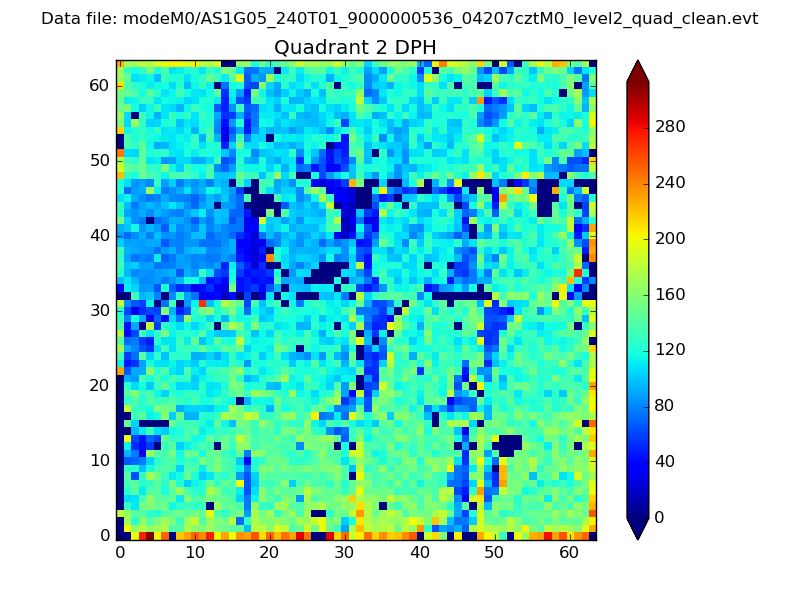
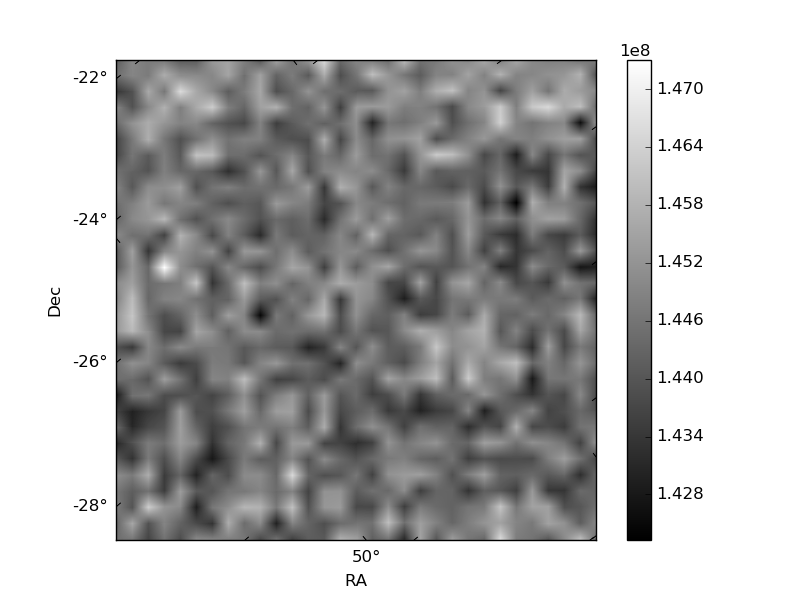
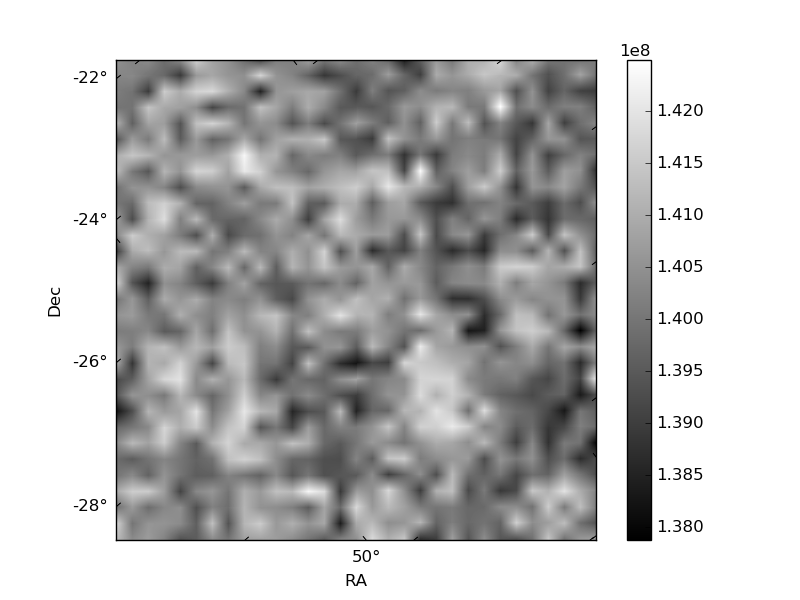
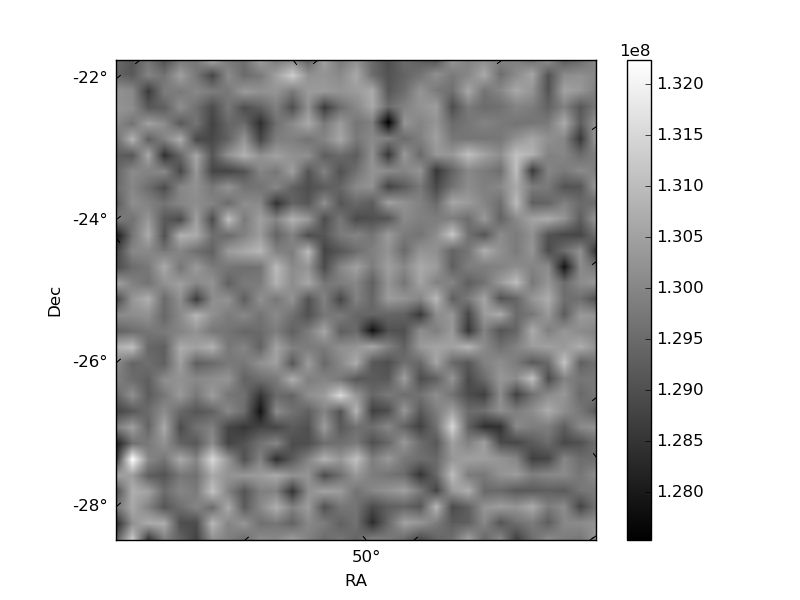
Histogram calculated using DETX and DETY for each event in the final _common_clean file
| Quadrant A | 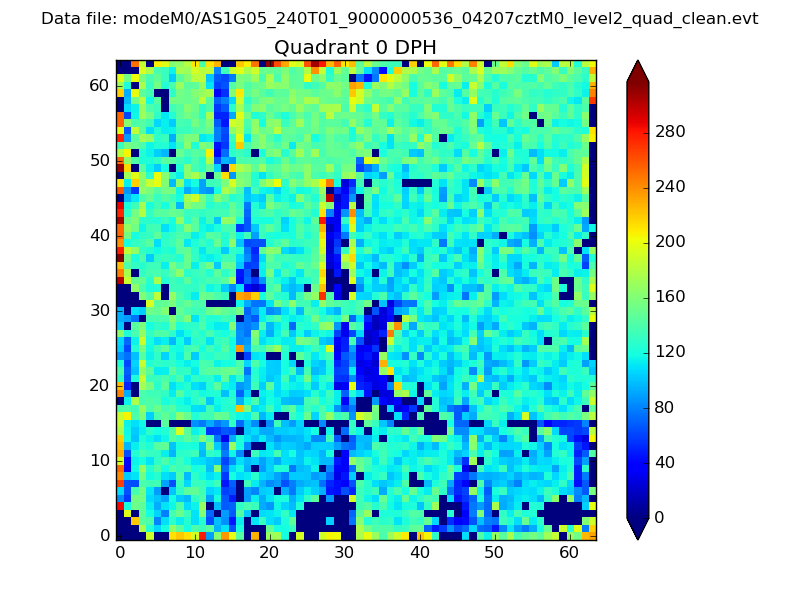 |
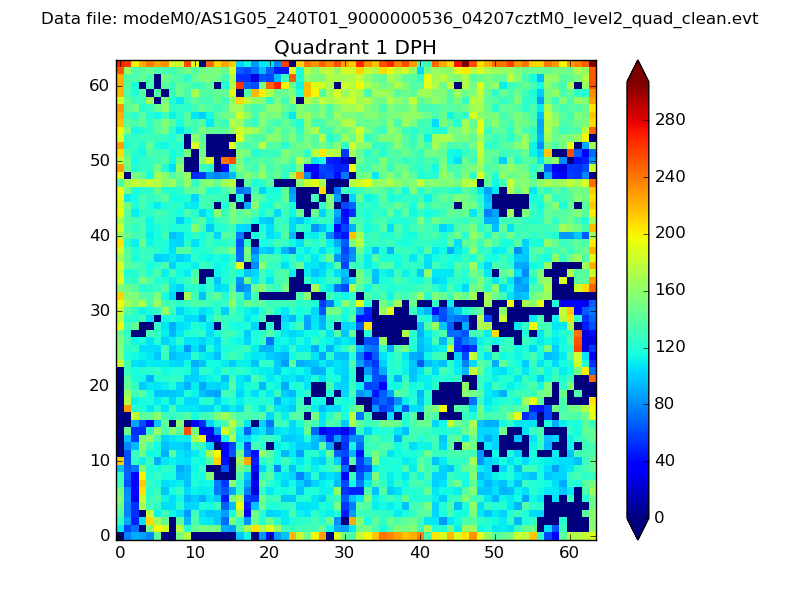 |
Quadrant B |
|---|---|---|---|
| Quadrant D | 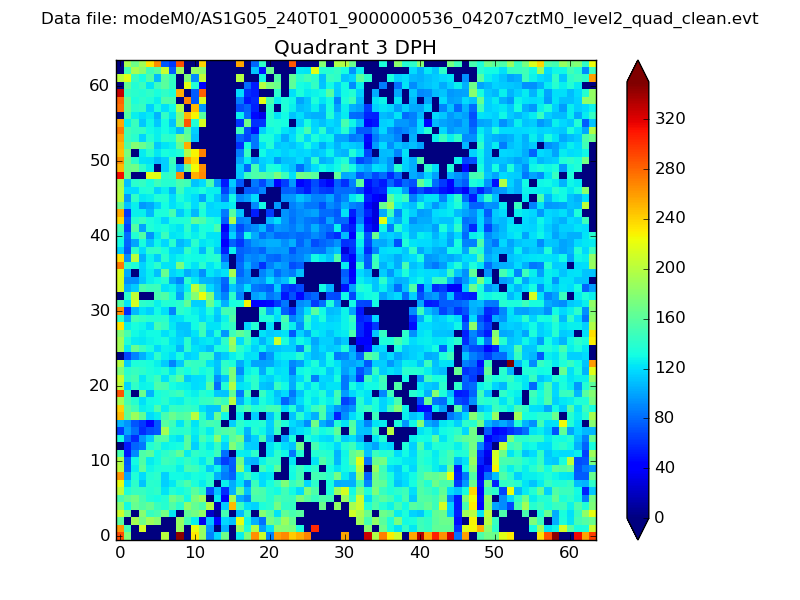 |
 |
Quadrant C |
| Plot type | Count rate plots | Images |
|---|---|---|
| Comparison with Poisson distribution Blue bars denote a histogram of data divided into 1 sec bins. Red curve is a Poisson curve with rate = median count rate of data. |
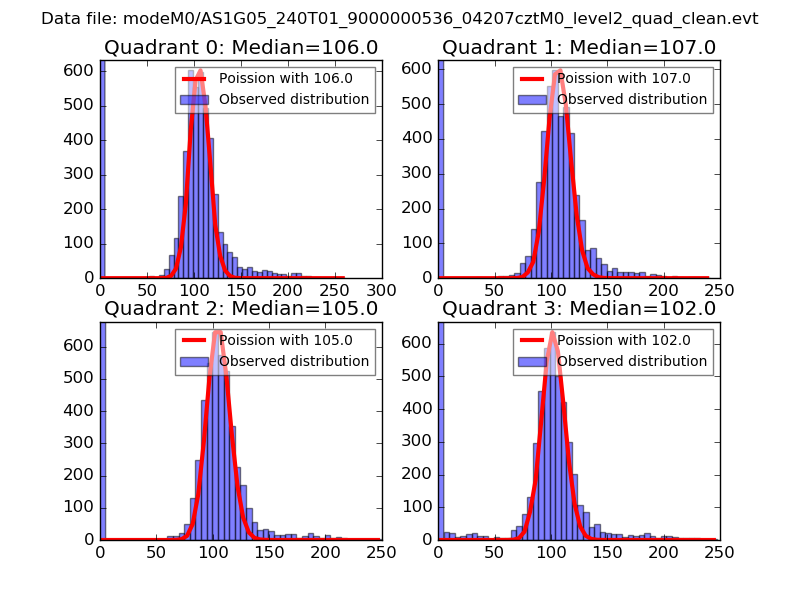 |
 |
| Quadrant-wise count rates Data is divided into 100 sec bins |
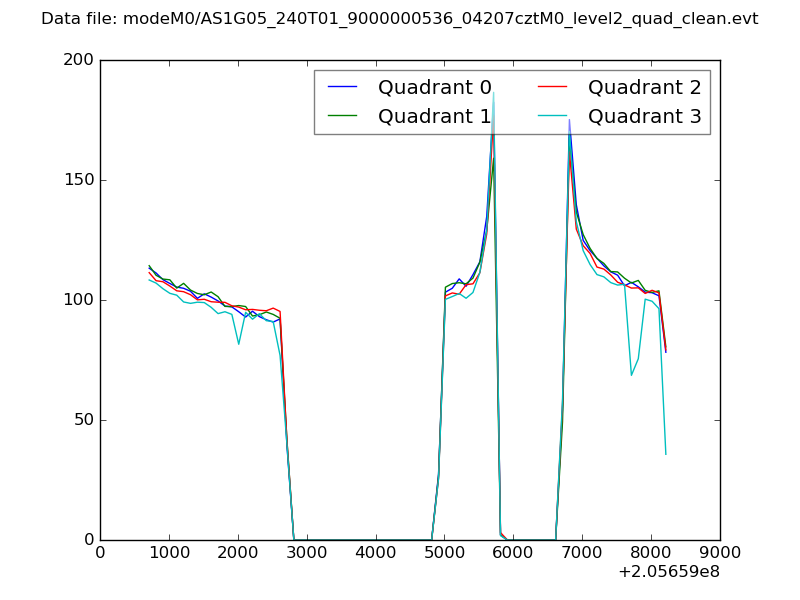 |
|
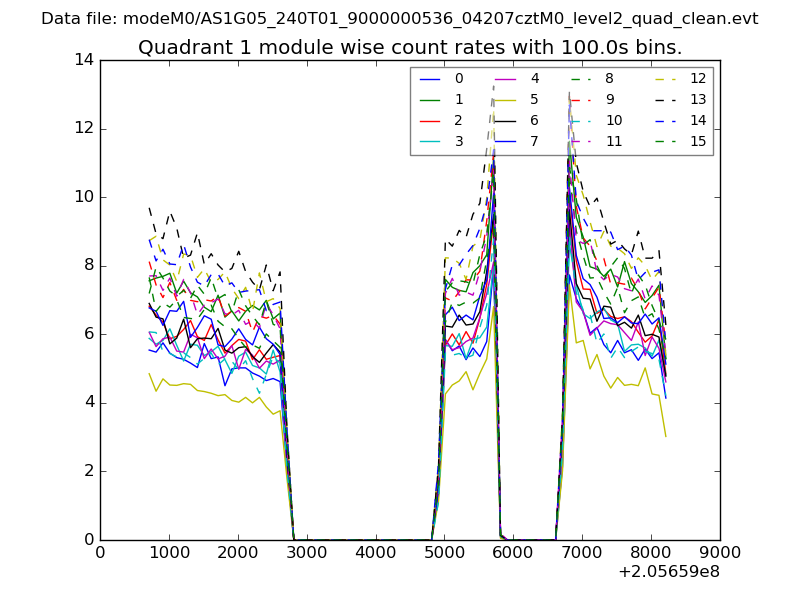
| Module-wise count rates for Quadrant A Data is divided into 100 sec bins |
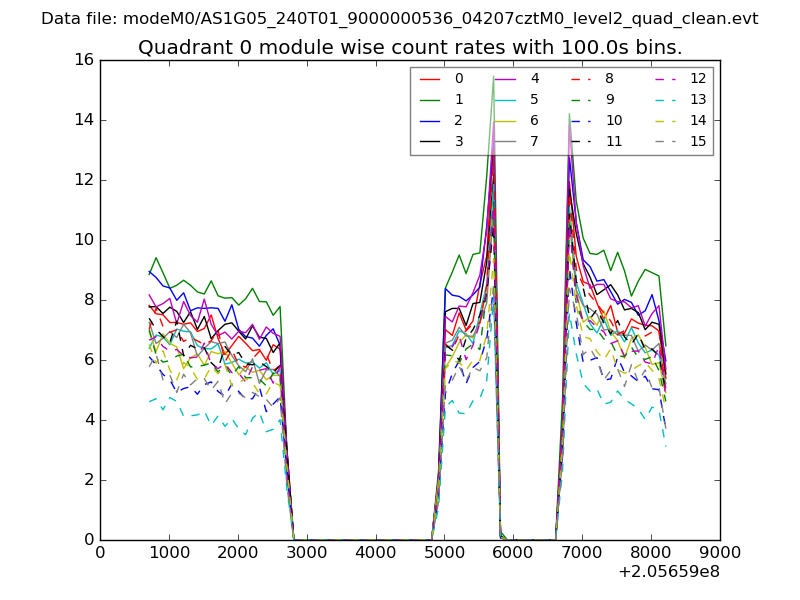 |
 |
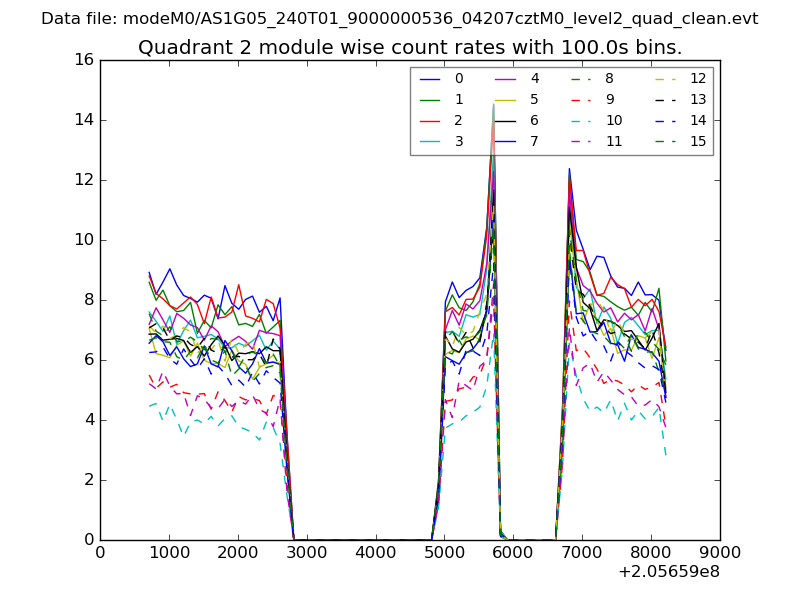
| Module-wise count rates for Quadrant B Data is divided into 100 sec bins |
 |
 |
| Module-wise count rates for Quadrant C Data is divided into 100 sec bins |
 |
 |
| Module-wise count rates for Quadrant D Data is divided into 100 sec bins |
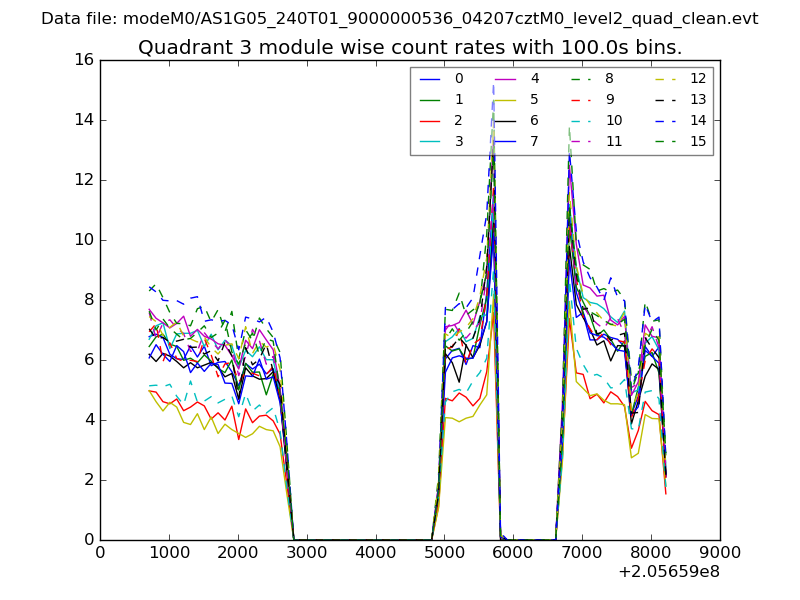 |
 |
| Parameter | Plot |
|---|---|
| CZT HV Monitor | 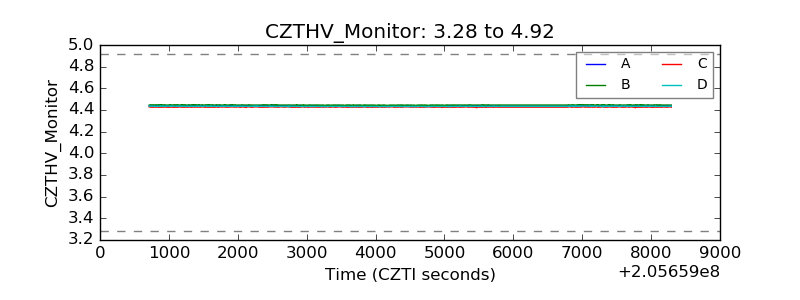 |
| D_VDD | 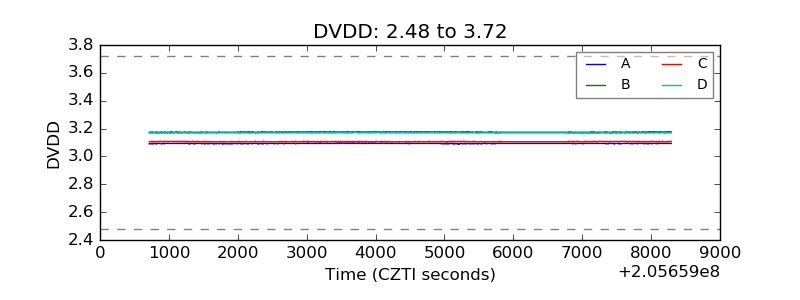 |
| Temperature 1 | 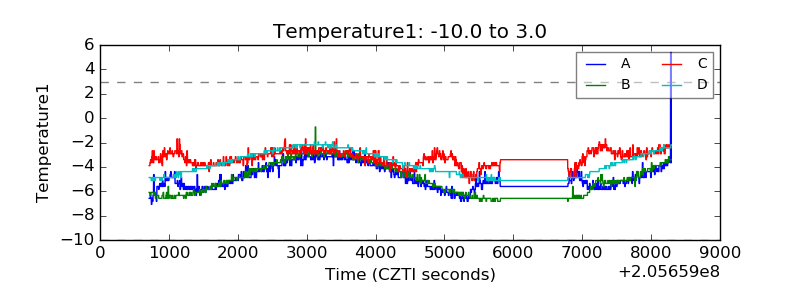 |
| Veto HV Monitor | 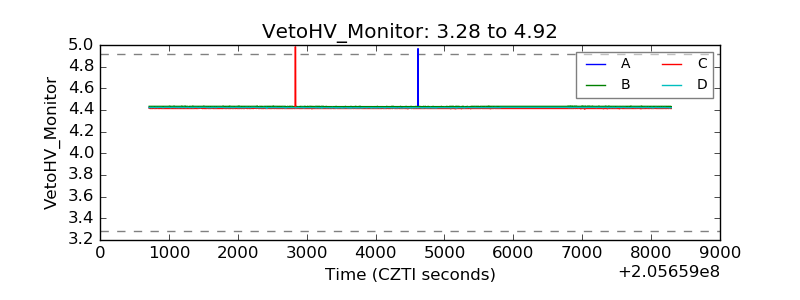 |
| Veto LLD | 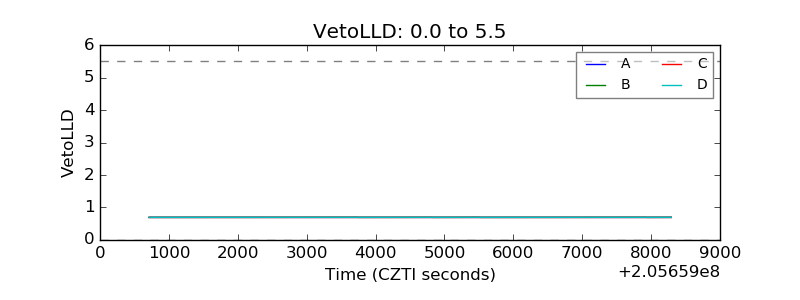 |
| Alpha Counter | 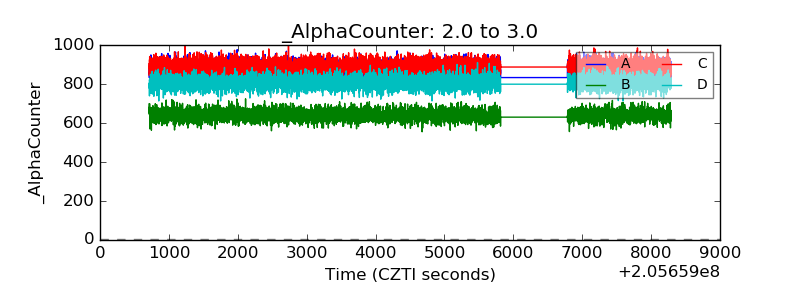 |
| _CPM_Rate | 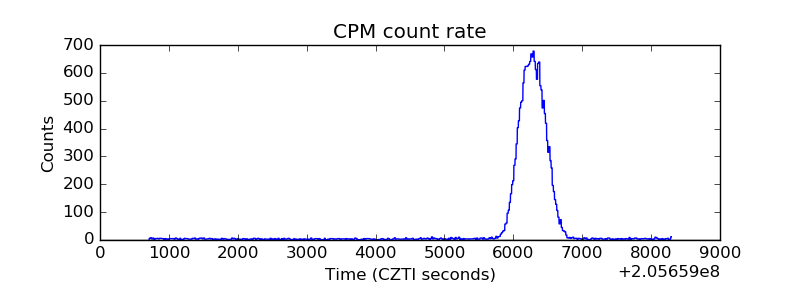 |
| CZT Counter | 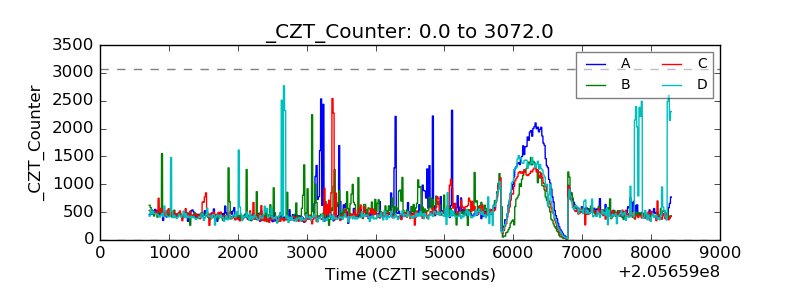 |
| +2.5 Volts monitor |  |
| +5 Volts monitor |  |
| _ROLL_ROT | 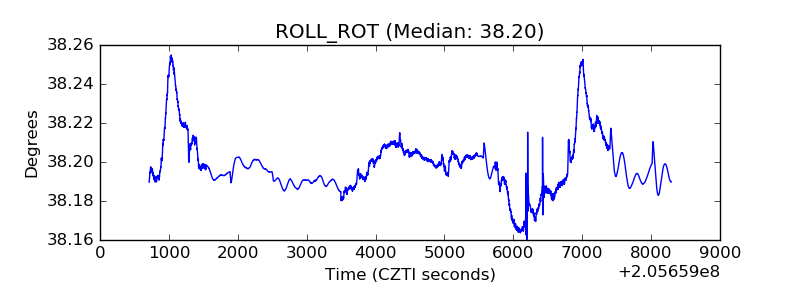 |
| _Roll_DEC | 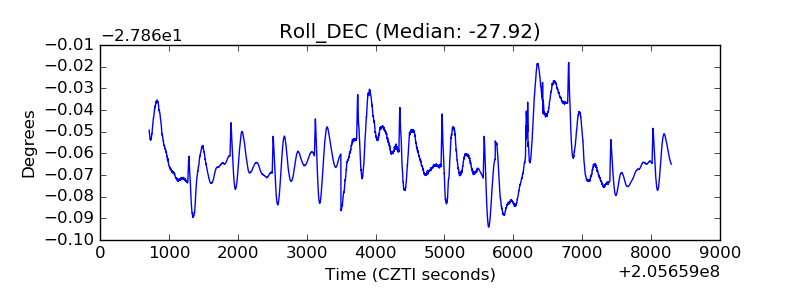 |
| _Roll_RA | 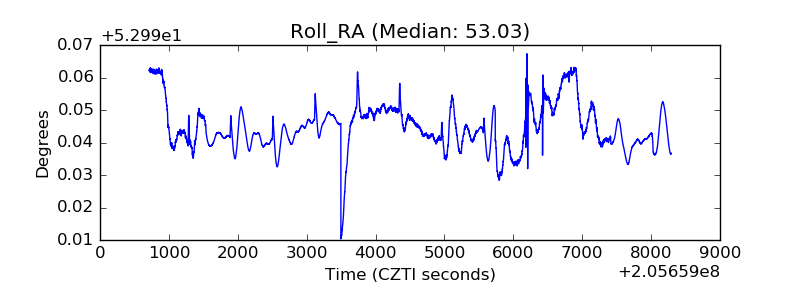 |
| Veto Counter | 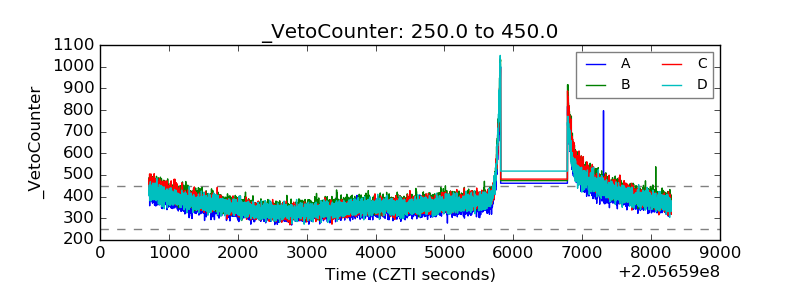 |