| Param | Original file | Final file |
|---|---|---|
| Filename | modeM0/AS1G05_240T01_9000000536_04209cztM0_level2.evt | modeM0/AS1G05_240T01_9000000536_04209cztM0_level2_quad_clean.evt |
| Size (bytes) | 533,413,440 | 75,176,640 |
| Size | 508.7 MB | 71.7 MB |
| Events in quadrant A | 4,900,077 | 469,745 |
| Events in quadrant B | 3,991,038 | 465,683 |
| Events in quadrant C | 2,931,354 | 463,067 |
| Events in quadrant D | 3,890,546 | 424,074 |
| Mode SS | |||
|---|---|---|---|
| Quadrant | BADHDUFLAG | Total packets | Discarded packets |
| A | 0 | 132 | 0 |
| B | 0 | 132 | 0 |
| C | 0 | 132 | 0 |
| D | 0 | 132 | 0 |
| Mode M9 | |||
|---|---|---|---|
| Quadrant | BADHDUFLAG | Total packets | Discarded packets |
| A | 0 | 11 | 0 |
| B | 0 | 11 | 0 |
| C | 0 | 11 | 0 |
| D | 0 | 11 | 0 |
| Mode M0 | |||
|---|---|---|---|
| Quadrant | BADHDUFLAG | Total packets | Discarded packets |
| A | 0 | 18768 | 2 |
| B | 0 | 15957 | 1 |
| C | 0 | 13216 | 1 |
| D | 0 | 16156 | 1 |
| Quadrant | Total seconds | Saturated seconds | Saturation percentage |
|---|---|---|---|
| A | 6502 | 679 | 10.442941% |
| B | 6502 | 212 | 3.260535% |
| C | 6502 | 31 | 0.476776% |
| D | 6502 | 367 | 5.644417% |
Noise dominated data is calculated using 1-second bins in cleaned event files. If a bin has >2000 counts, and if more than 50% of those come from <1% of pixels, then it is considered to be noise-dominated and hence unusable.
| Quadrant | # 1 sec bins | Bins with >0 counts | Bins with >2000 counts | High rate bins dominated by noise | Noise dominated (total time) | Noise dominated (detector-on time) | Marked lightcurve |
|---|---|---|---|---|---|---|---|
| A | 7612 | 6503 | 510 | 510 | 6.70% | 7.84% | 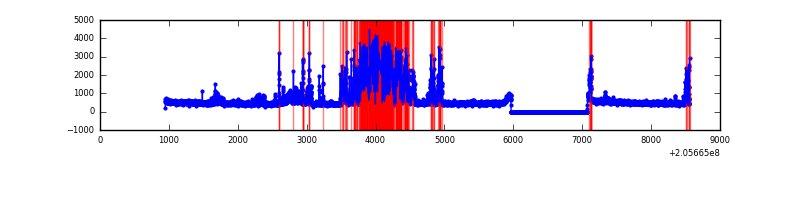 |
| B | 7612 | 6503 | 128 | 128 | 1.68% | 1.97% | 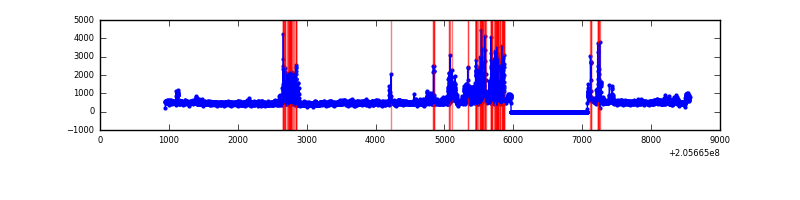 |
| C | 7612 | 6503 | 0 | 0 | 0.00% | 0.00% | 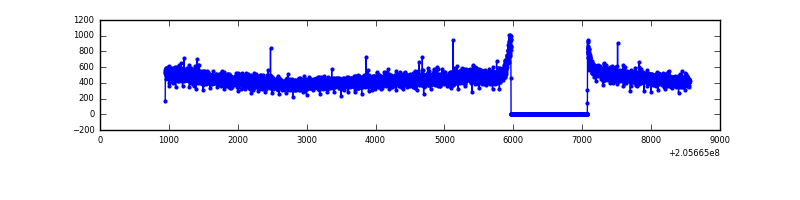 |
| D | 7612 | 6503 | 288 | 288 | 3.78% | 4.43% | 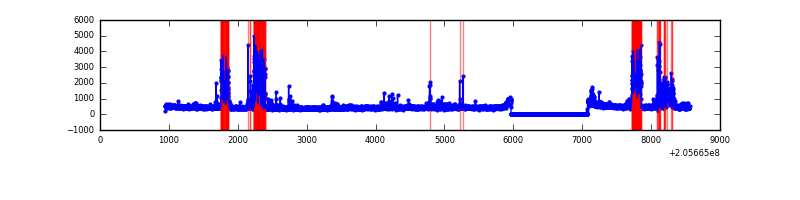 |
Top three noisy pixels from each quadrant. If the there are fewer than three noisy pixels in the level2.evt file, extra rows are filled as -1
| Pixel properties | Quadrant properties | ||||||
|---|---|---|---|---|---|---|---|
| Quadrant | DetID | PixID | Counts | Sigma | Mean | Median | Sigma |
| A | 15 | 234 | 1743453 | 11539.38 | 744 | 727 | 151.0 |
| A | 0 | 50 | 250157 | 1651.59 | 744 | 727 | 151.0 |
| A | 8 | 15 | 20729 | 132.44 | 744 | 727 | 151.0 |
| B | 3 | 0 | 903550 | 6089.04 | 772 | 753 | 148.3 |
| B | 15 | 204 | 43663 | 289.41 | 772 | 753 | 148.3 |
| B | 0 | 183 | 21074 | 137.06 | 772 | 753 | 148.3 |
| C | 14 | 67 | 13996 | 76.15 | 746 | 751 | 173.9 |
| C | 13 | 61 | 6107 | 30.79 | 746 | 751 | 173.9 |
| C | 10 | 65 | 3445 | 15.49 | 746 | 751 | 173.9 |
| D | 13 | 239 | 1010687 | 5752.27 | 727 | 708 | 175.6 |
| D | 12 | 110 | 44588 | 249.92 | 727 | 708 | 175.6 |
| D | 2 | 206 | 19972 | 109.72 | 727 | 708 | 175.6 |
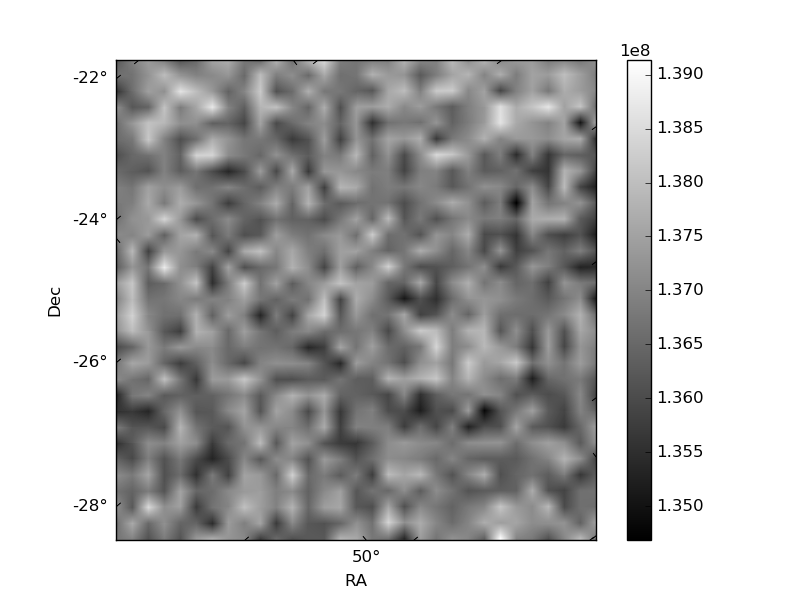
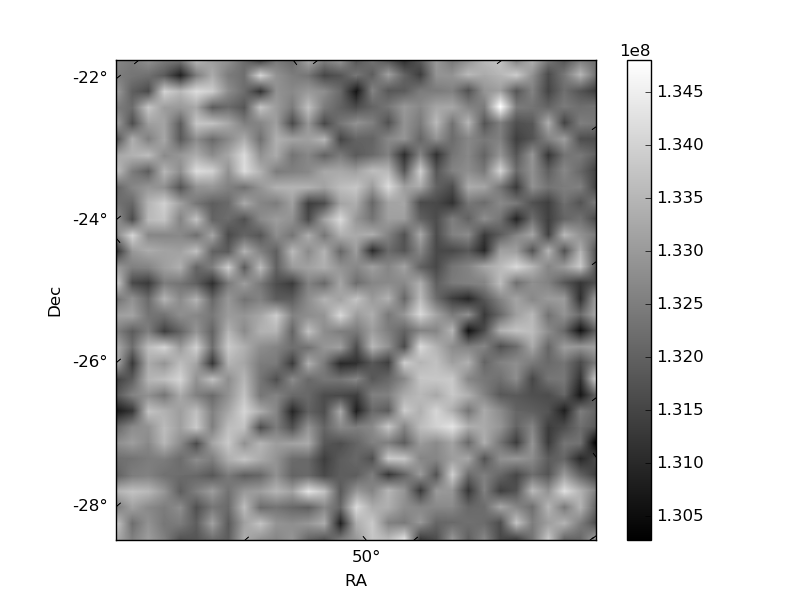
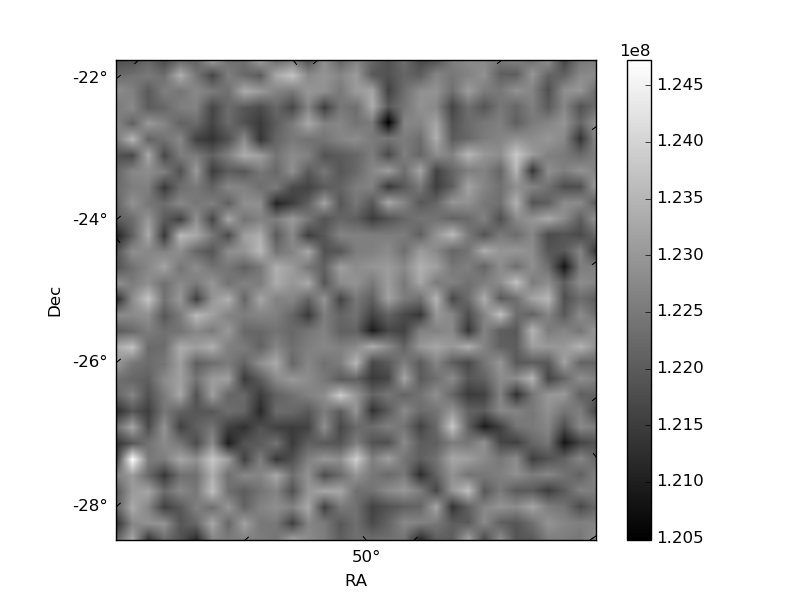
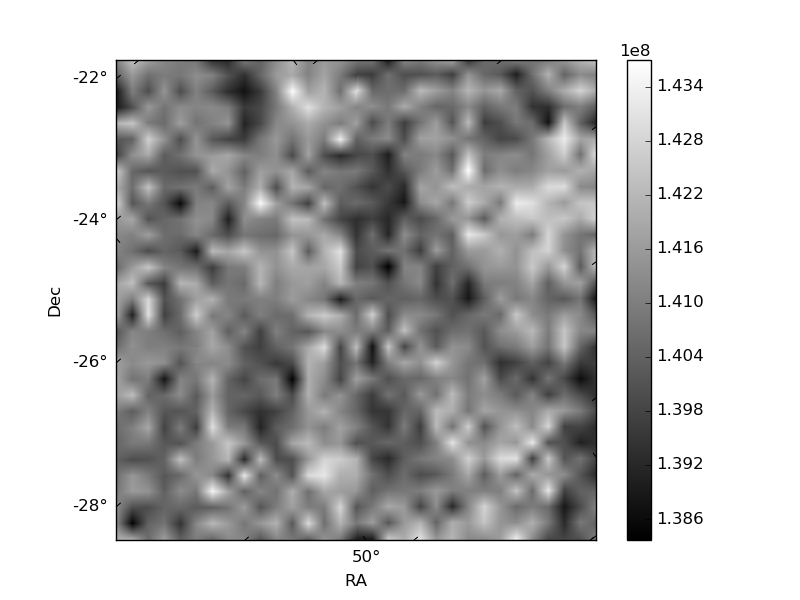
Histogram calculated using DETX and DETY for each event in the final _common_clean file
| Quadrant A | 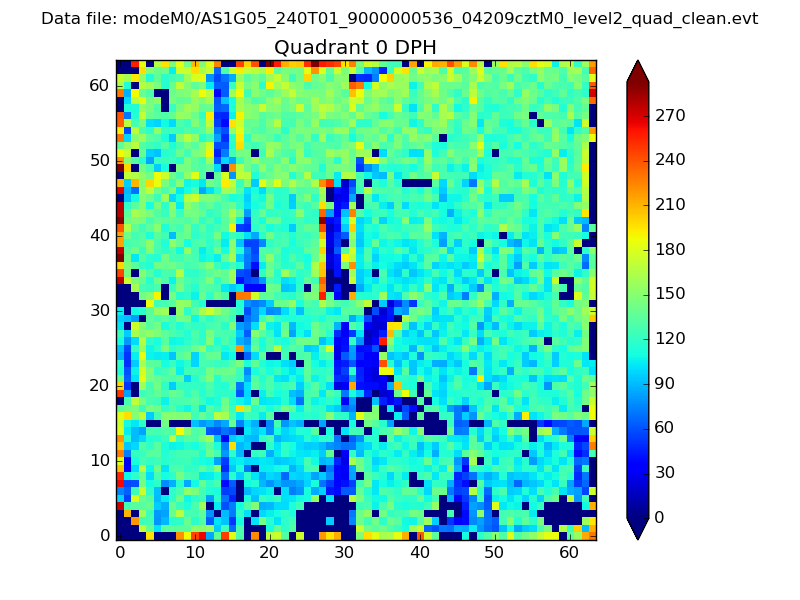 |
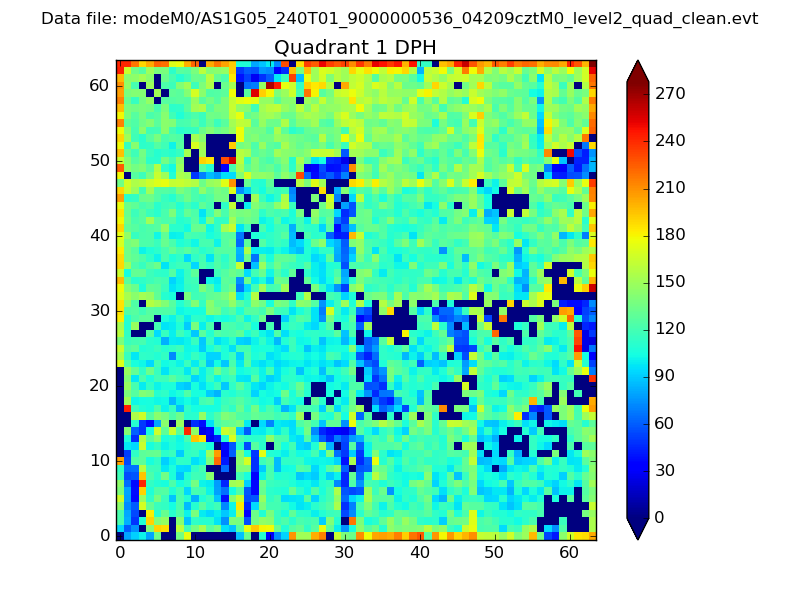 |
Quadrant B |
|---|---|---|---|
| Quadrant D | 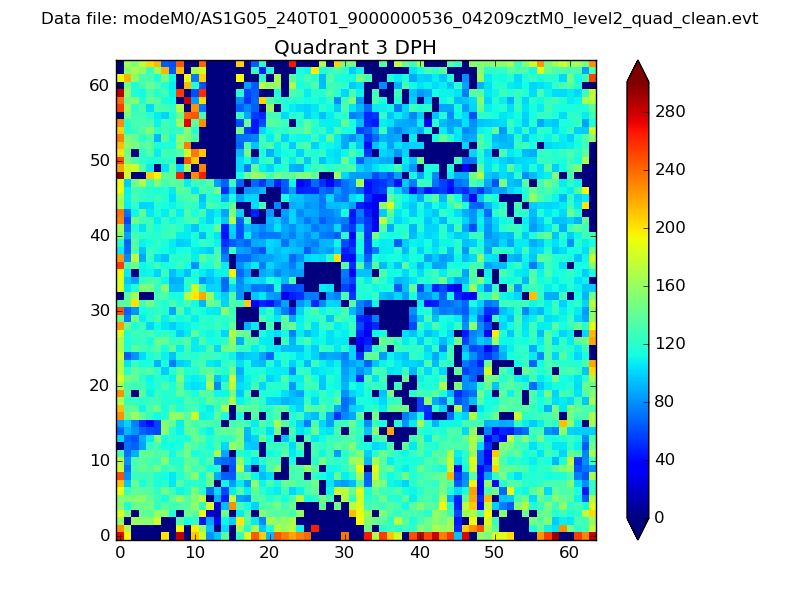 |
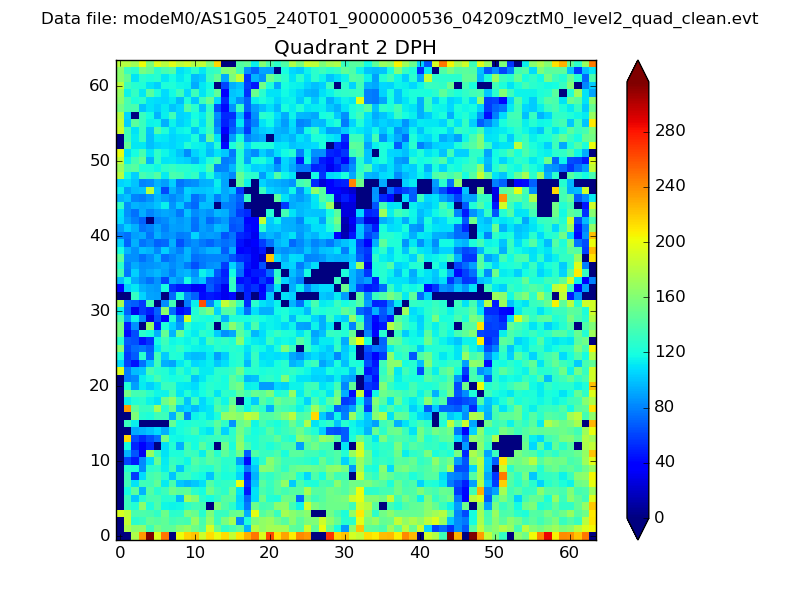 |
Quadrant C |
| Plot type | Count rate plots | Images |
|---|---|---|
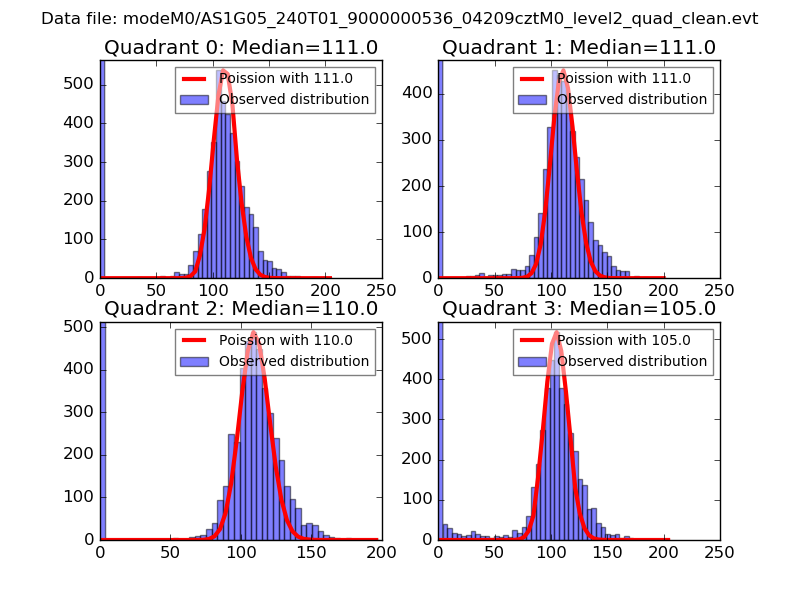
| Comparison with Poisson distribution Blue bars denote a histogram of data divided into 1 sec bins. Red curve is a Poisson curve with rate = median count rate of data. |
 |
 |
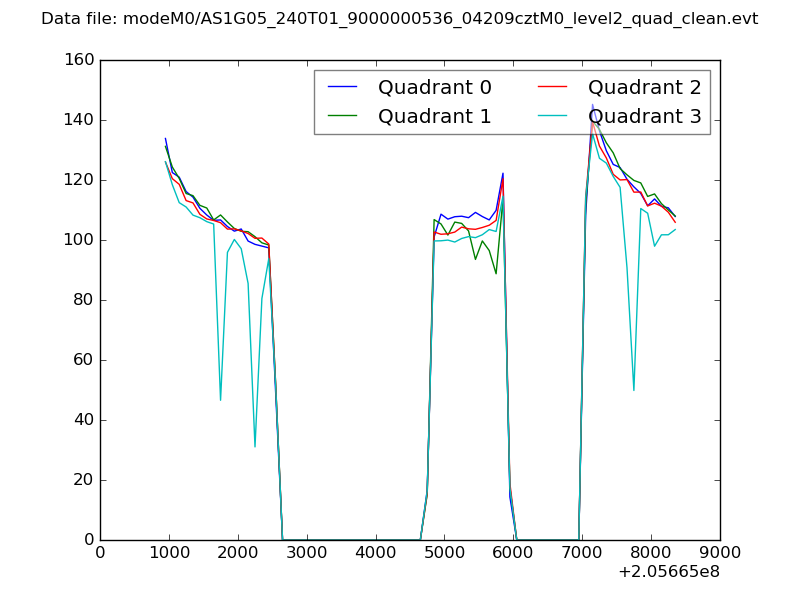
| Quadrant-wise count rates Data is divided into 100 sec bins |
 |
|
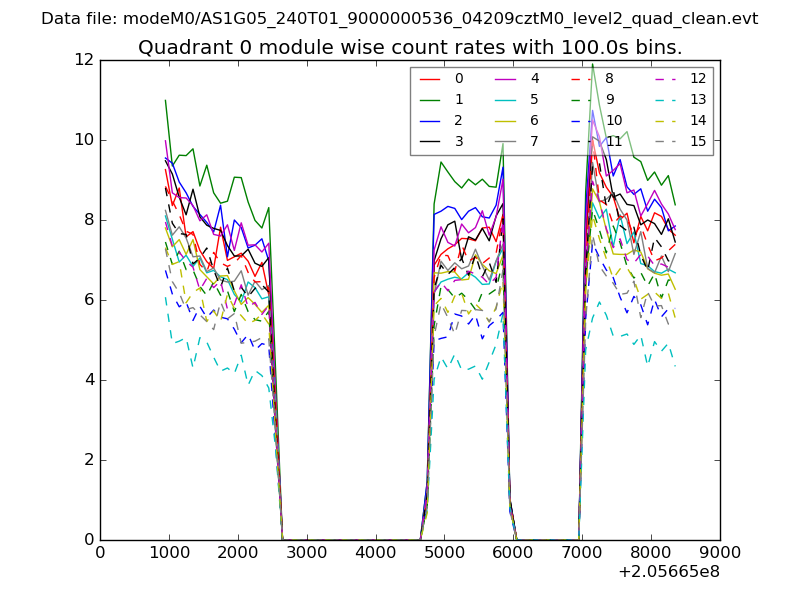
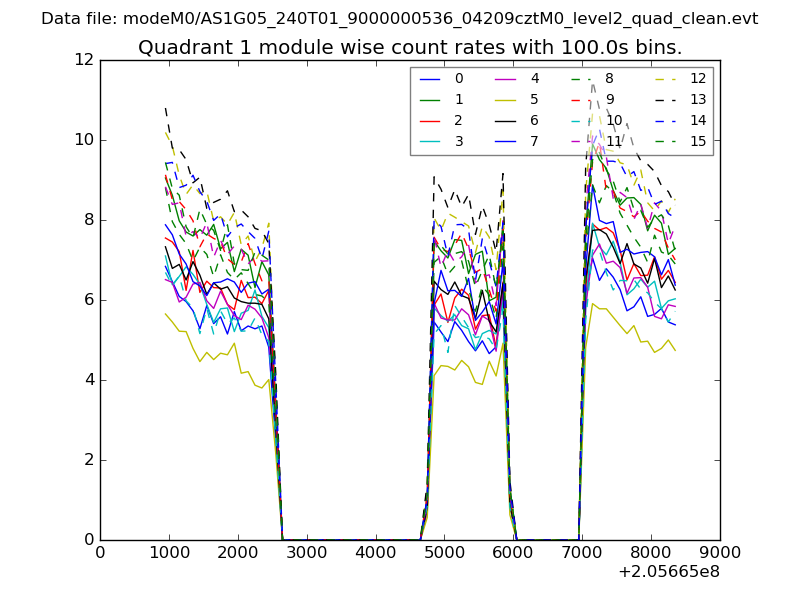
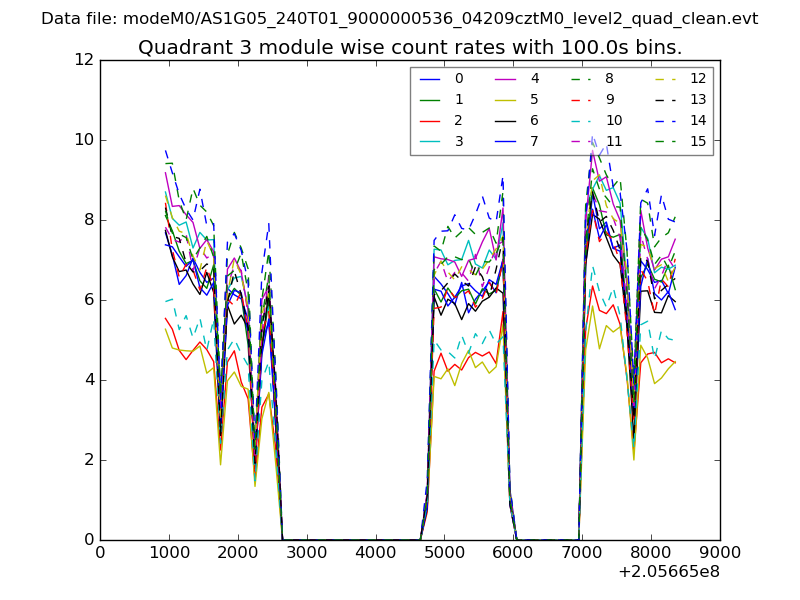
| Module-wise count rates for Quadrant A Data is divided into 100 sec bins |
 |
 |
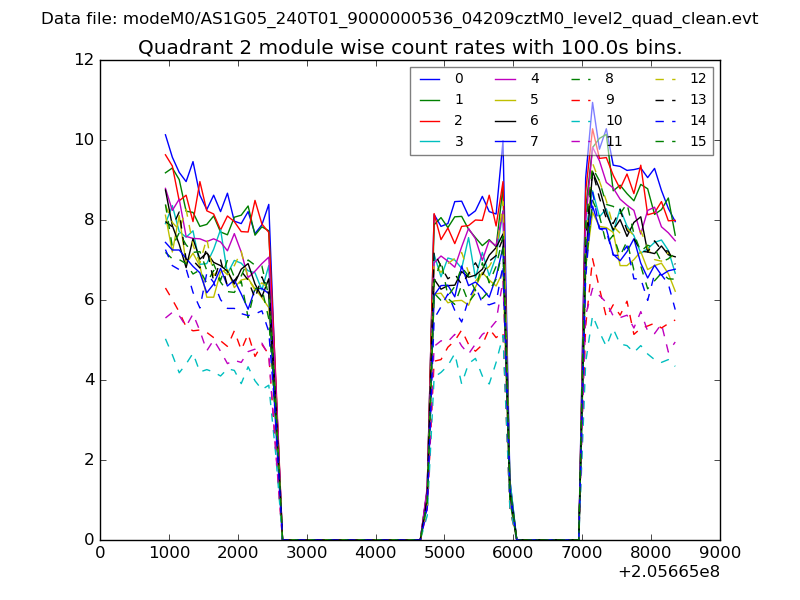
| Module-wise count rates for Quadrant B Data is divided into 100 sec bins |
 |
 |
| Module-wise count rates for Quadrant C Data is divided into 100 sec bins |
 |
 |
| Module-wise count rates for Quadrant D Data is divided into 100 sec bins |
 |
 |
| Parameter | Plot |
|---|---|
| CZT HV Monitor | 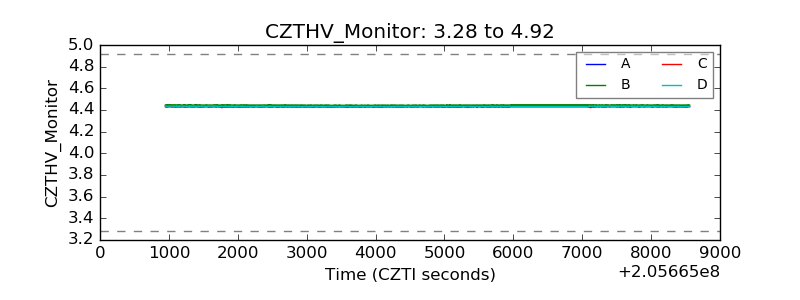 |
| D_VDD | 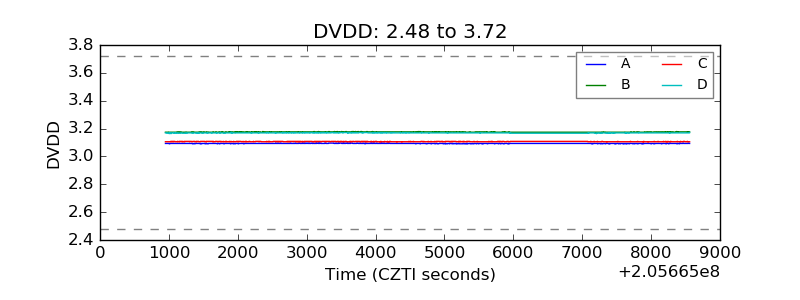 |
| Temperature 1 | 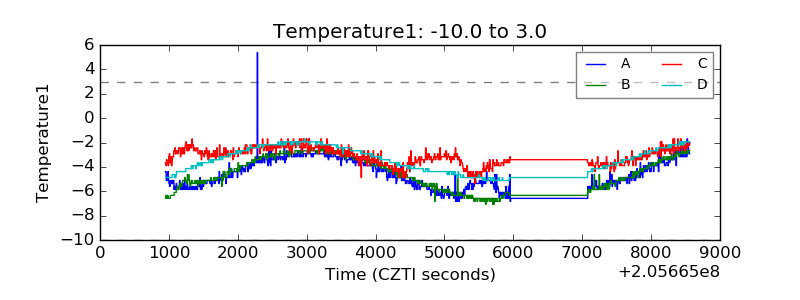 |
| Veto HV Monitor | 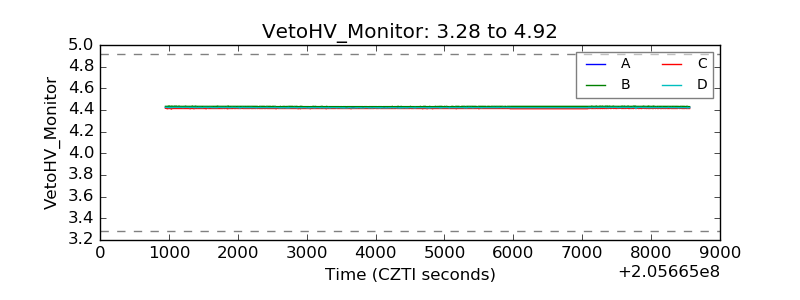 |
| Veto LLD |  |
| Alpha Counter | 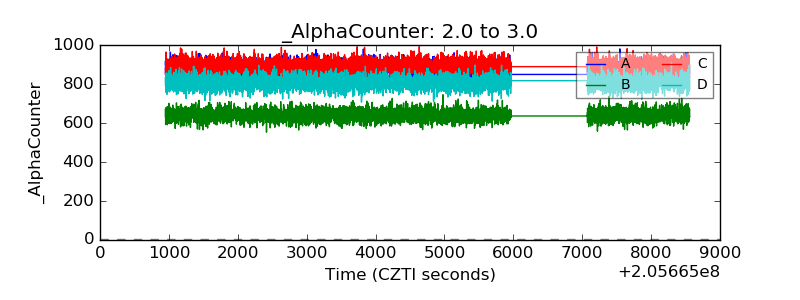 |
| _CPM_Rate | 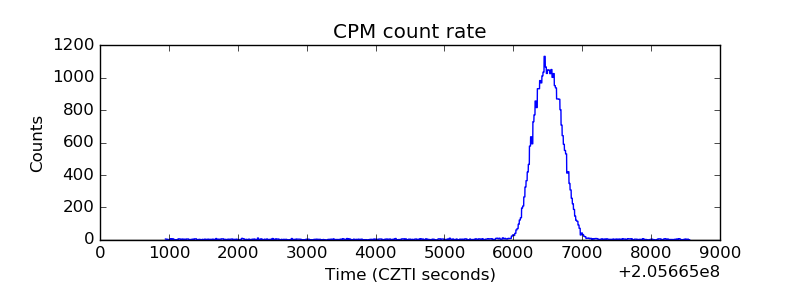 |
| CZT Counter | 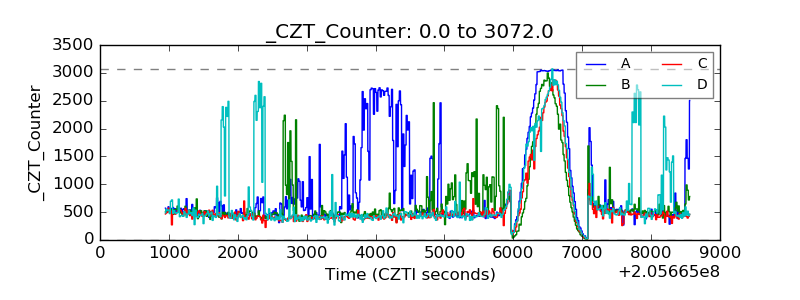 |
| +2.5 Volts monitor |  |
| +5 Volts monitor |  |
| _ROLL_ROT |  |
| _Roll_DEC | 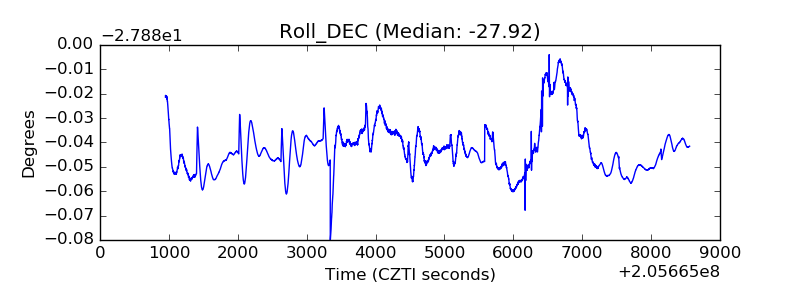 |
| _Roll_RA | 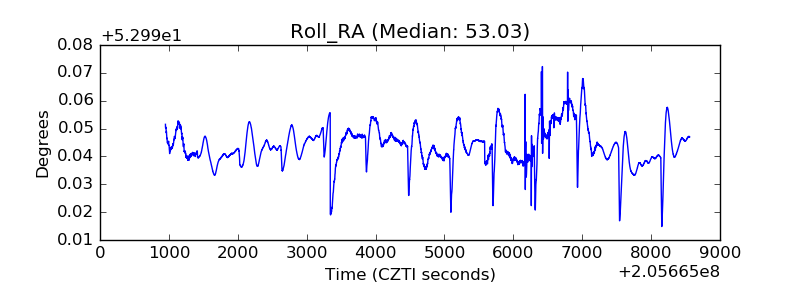 |
| Veto Counter | 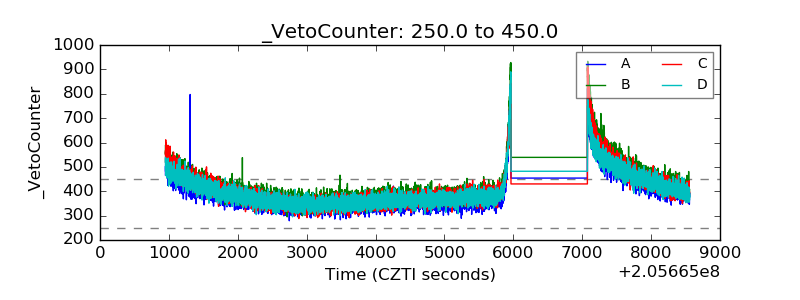 |