| Param | Original file | Final file |
|---|---|---|
| Filename | modeM0/AS1G05_240T01_9000000536_04210cztM0_level2.evt | modeM0/AS1G05_240T01_9000000536_04210cztM0_level2_quad_clean.evt |
| Size (bytes) | 518,181,120 | 71,968,320 |
| Size | 494.2 MB | 68.6 MB |
| Events in quadrant A | 3,303,308 | 450,400 |
| Events in quadrant B | 4,218,699 | 433,056 |
| Events in quadrant C | 2,994,671 | 439,743 |
| Events in quadrant D | 4,736,593 | 403,520 |
| Mode SS | |||
|---|---|---|---|
| Quadrant | BADHDUFLAG | Total packets | Discarded packets |
| A | 0 | 132 | 0 |
| B | 0 | 132 | 0 |
| C | 0 | 132 | 0 |
| D | 0 | 132 | 0 |
| Mode M9 | |||
|---|---|---|---|
| Quadrant | BADHDUFLAG | Total packets | Discarded packets |
| A | 0 | 12 | 0 |
| B | 0 | 12 | 0 |
| C | 0 | 12 | 0 |
| D | 0 | 12 | 0 |
| Mode M0 | |||
|---|---|---|---|
| Quadrant | BADHDUFLAG | Total packets | Discarded packets |
| A | 0 | 13909 | 2 |
| B | 0 | 16640 | 1 |
| C | 0 | 13235 | 1 |
| D | 0 | 18426 | 1 |
| Quadrant | Total seconds | Saturated seconds | Saturation percentage |
|---|---|---|---|
| A | 6479 | 95 | 1.466276% |
| B | 6479 | 387 | 5.973144% |
| C | 6479 | 22 | 0.339559% |
| D | 6479 | 460 | 7.099861% |
Noise dominated data is calculated using 1-second bins in cleaned event files. If a bin has >2000 counts, and if more than 50% of those come from <1% of pixels, then it is considered to be noise-dominated and hence unusable.
| Quadrant | # 1 sec bins | Bins with >0 counts | Bins with >2000 counts | High rate bins dominated by noise | Noise dominated (total time) | Noise dominated (detector-on time) | Marked lightcurve |
|---|---|---|---|---|---|---|---|
| A | 7704 | 6480 | 27 | 27 | 0.35% | 0.42% | 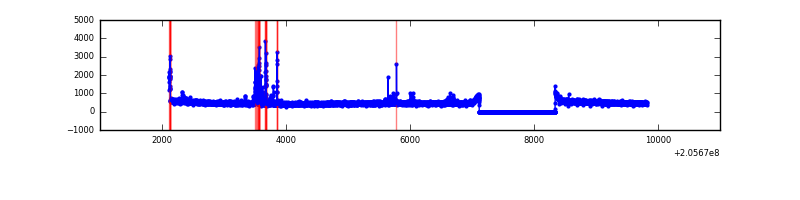 |
| B | 7704 | 6480 | 295 | 295 | 3.83% | 4.55% | 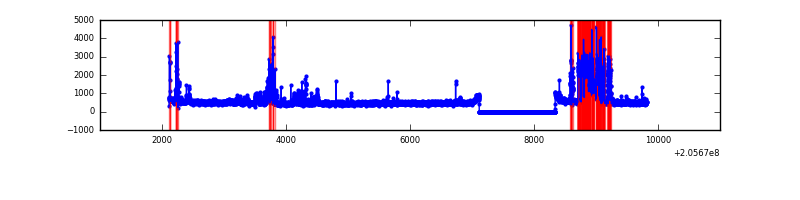 |
| C | 7704 | 6480 | 0 | 0 | 0.00% | 0.00% | 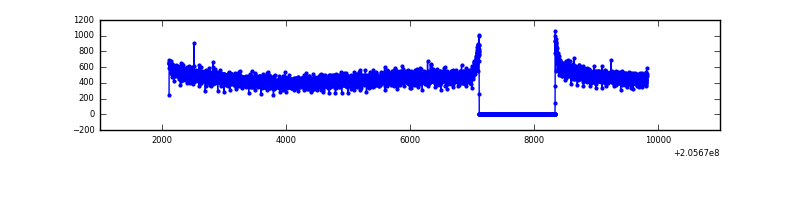 |
| D | 7704 | 6480 | 388 | 388 | 5.04% | 5.99% | 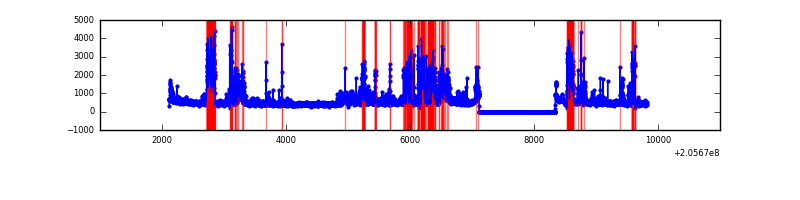 |
Top three noisy pixels from each quadrant. If the there are fewer than three noisy pixels in the level2.evt file, extra rows are filled as -1
| Pixel properties | Quadrant properties | ||||||
|---|---|---|---|---|---|---|---|
| Quadrant | DetID | PixID | Counts | Sigma | Mean | Median | Sigma |
| A | 0 | 50 | 180708 | 1103.09 | 802 | 784 | 163.1 |
| A | 8 | 15 | 13920 | 80.54 | 802 | 784 | 163.1 |
| A | 13 | 14 | 10929 | 62.2 | 802 | 784 | 163.1 |
| B | 3 | 0 | 1081328 | 7183.07 | 785 | 767 | 150.4 |
| B | 14 | 167 | 56315 | 369.26 | 785 | 767 | 150.4 |
| B | 15 | 204 | 14271 | 89.77 | 785 | 767 | 150.4 |
| C | 9 | 144 | 10871 | 56.63 | 764 | 769 | 178.4 |
| C | 13 | 61 | 6238 | 30.66 | 764 | 769 | 178.4 |
| C | 14 | 67 | 2128 | 7.62 | 764 | 769 | 178.4 |
| D | 9 | 85 | 889503 | 4931.87 | 752 | 733 | 180.2 |
| D | 13 | 239 | 640588 | 3550.62 | 752 | 733 | 180.2 |
| D | 2 | 232 | 190712 | 1054.21 | 752 | 733 | 180.2 |
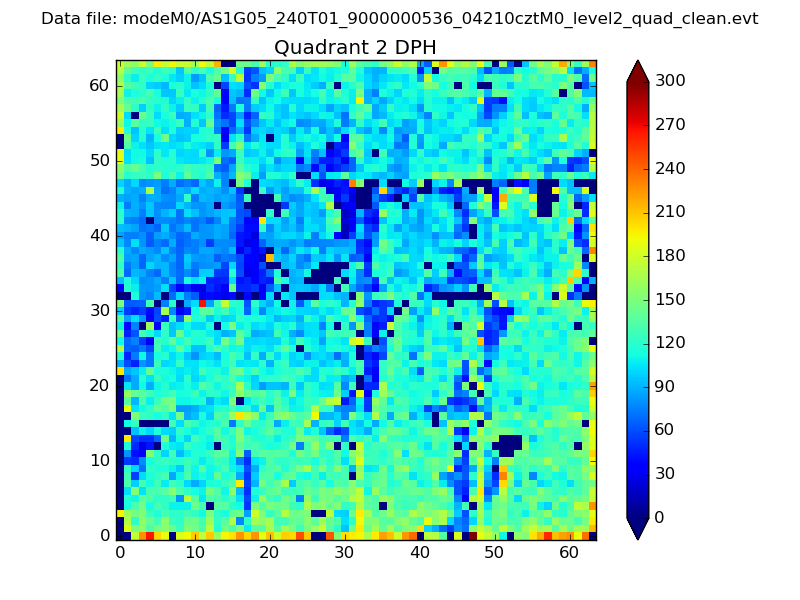
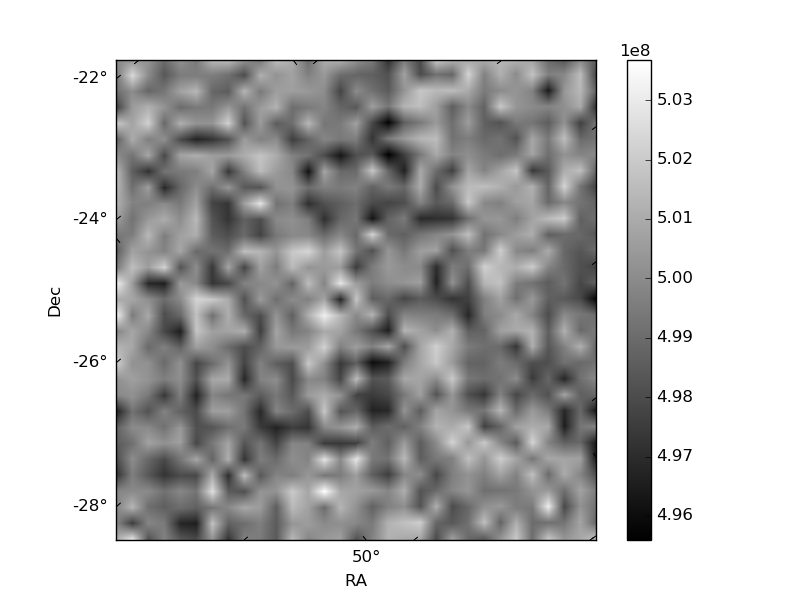
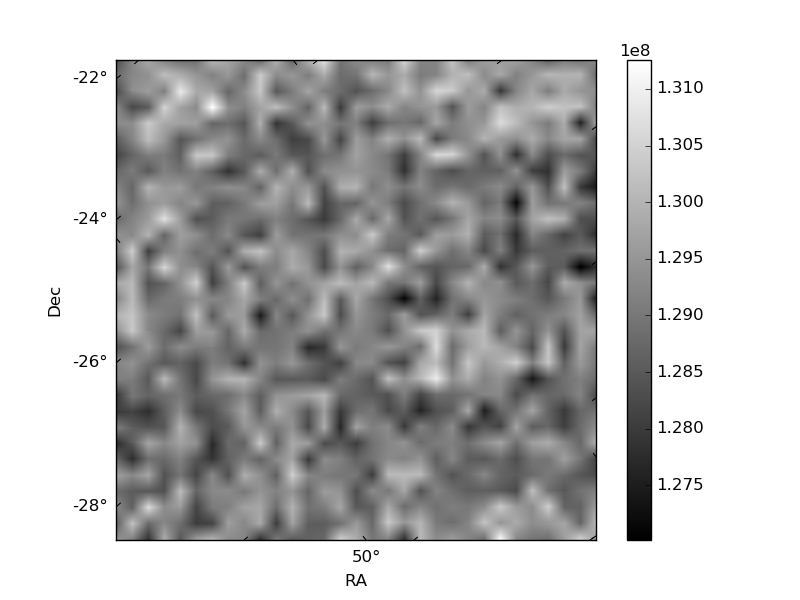
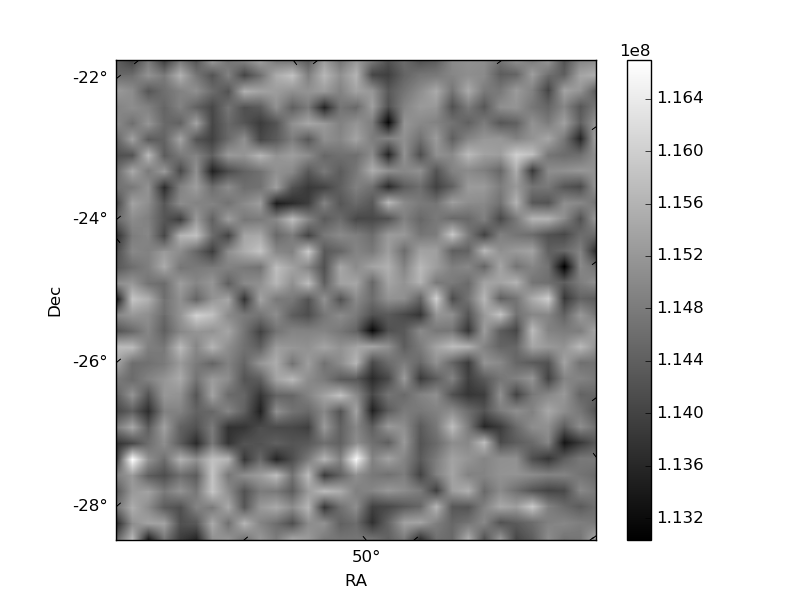
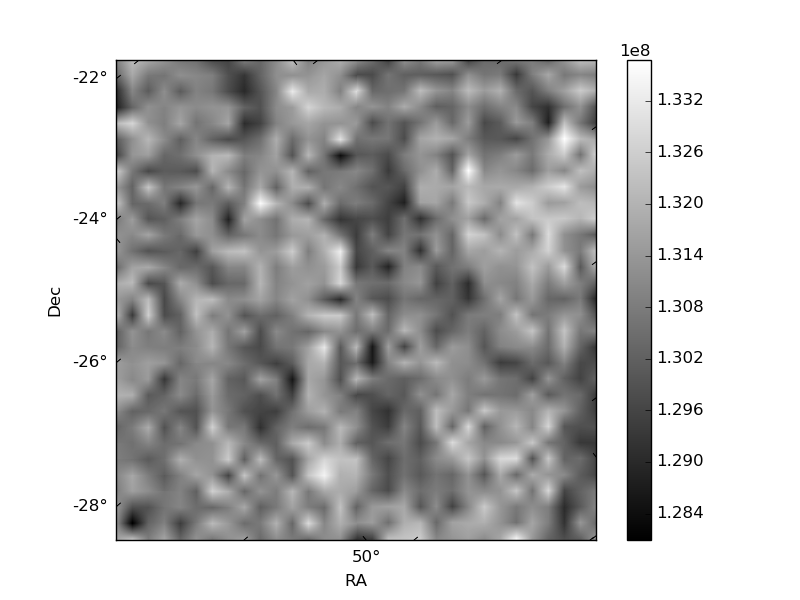
Histogram calculated using DETX and DETY for each event in the final _common_clean file
| Quadrant A | 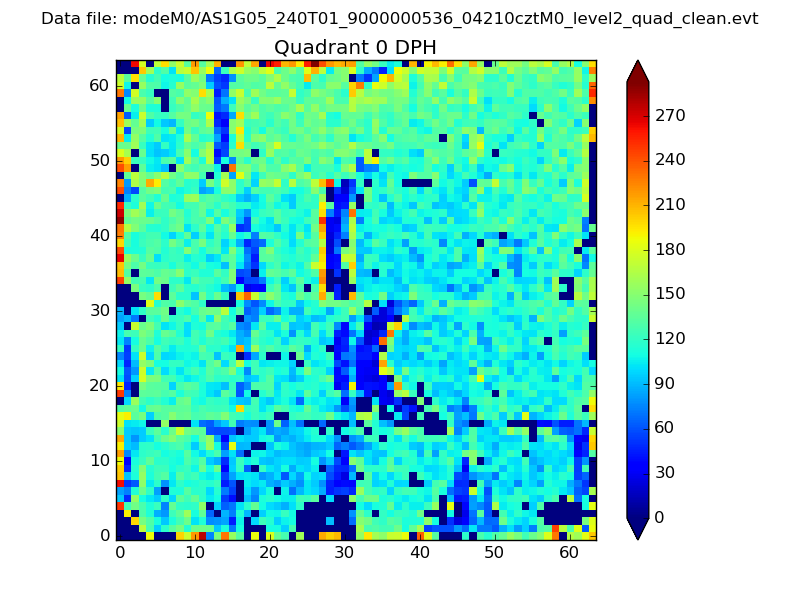 |
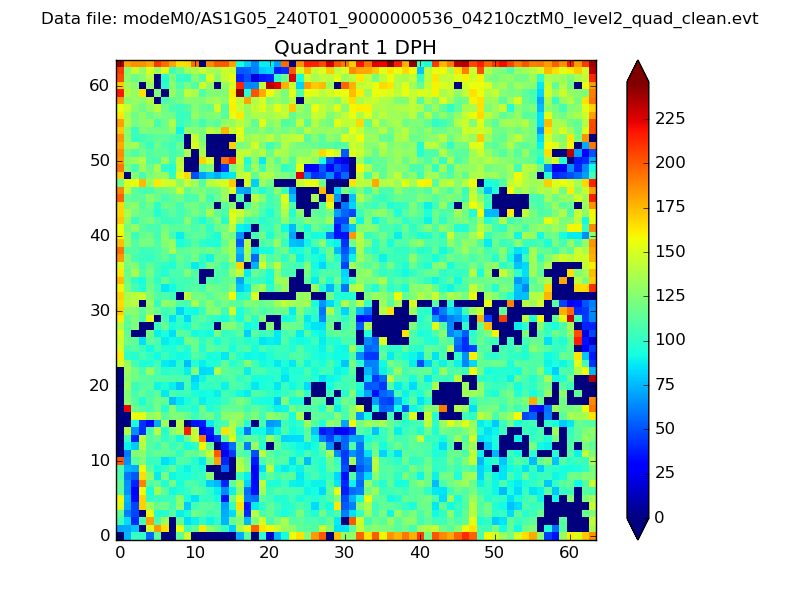 |
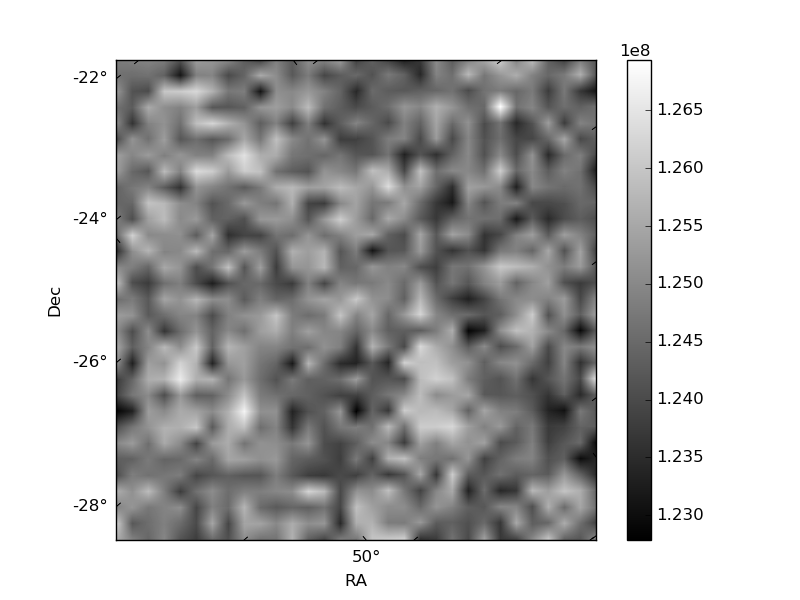
Quadrant B |
|---|---|---|---|
| Quadrant D | 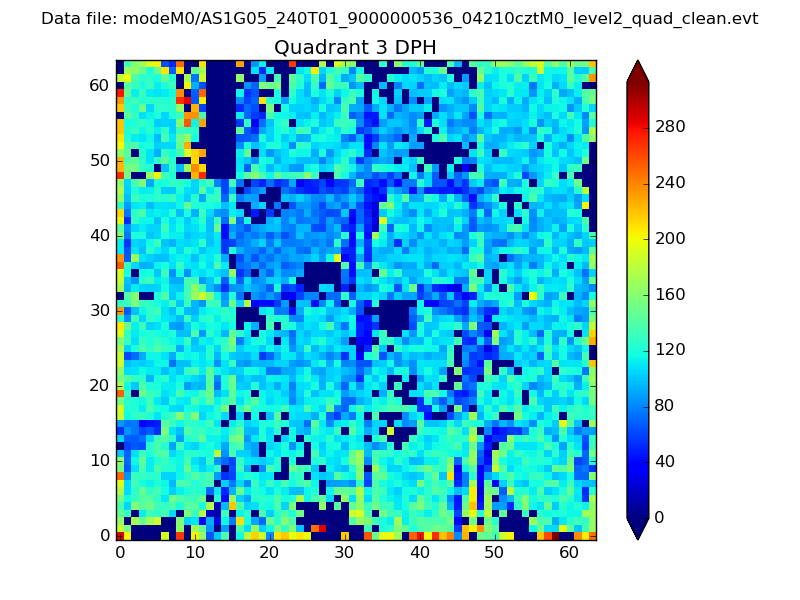 |
 |
Quadrant C |
| Plot type | Count rate plots | Images |
|---|---|---|
| Comparison with Poisson distribution Blue bars denote a histogram of data divided into 1 sec bins. Red curve is a Poisson curve with rate = median count rate of data. |
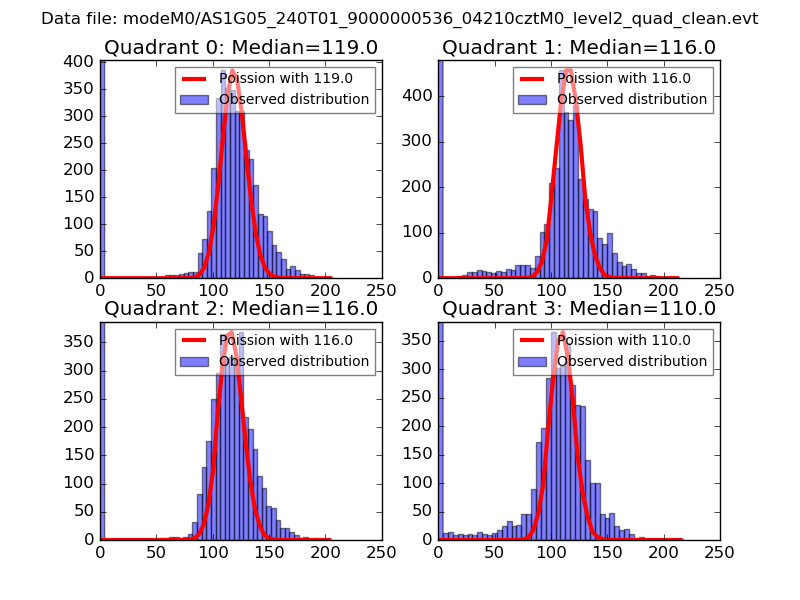 |
 |
| Quadrant-wise count rates Data is divided into 100 sec bins |
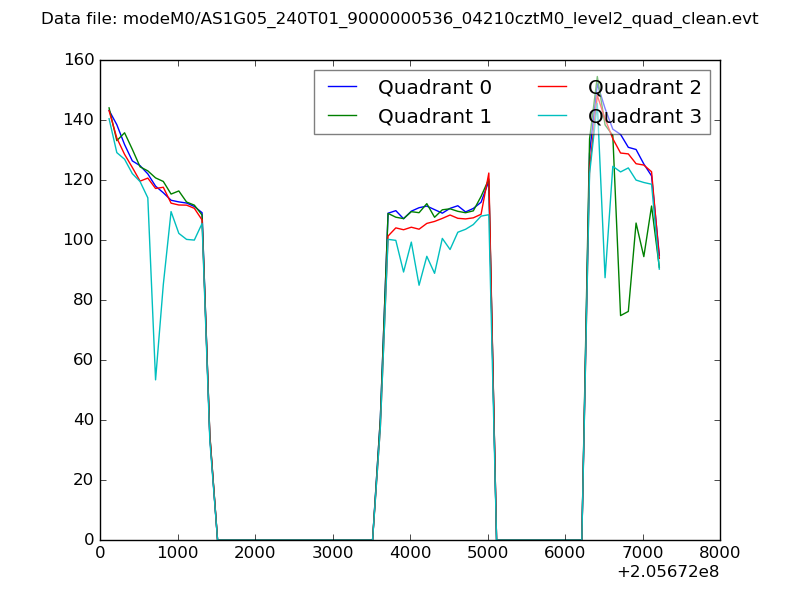 |
|
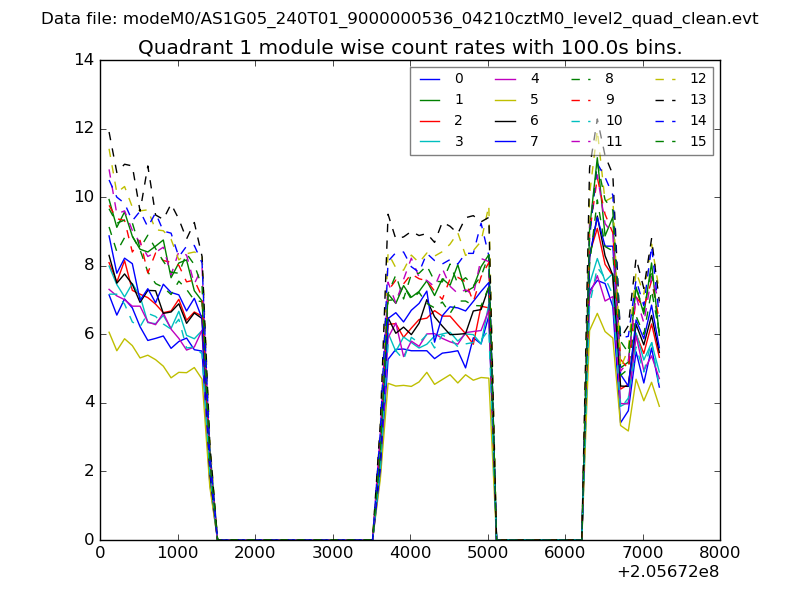
| Module-wise count rates for Quadrant A Data is divided into 100 sec bins |
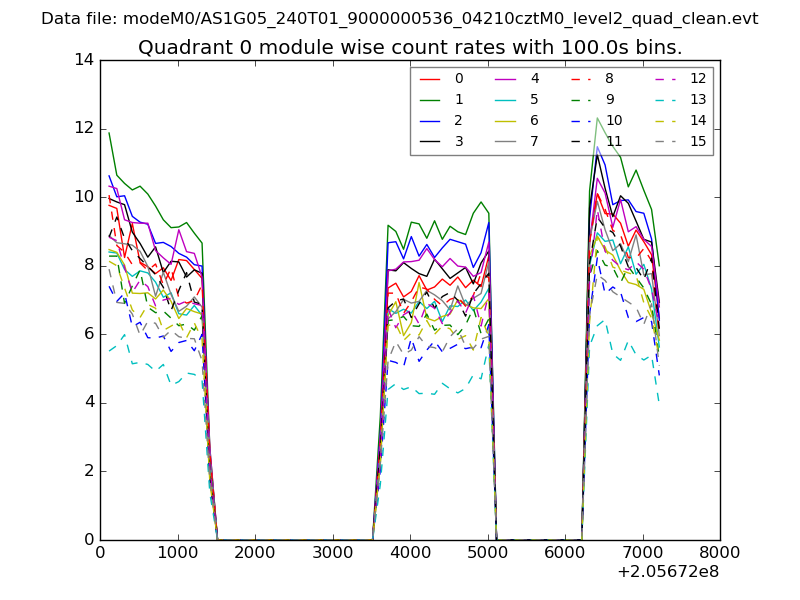 |
 |
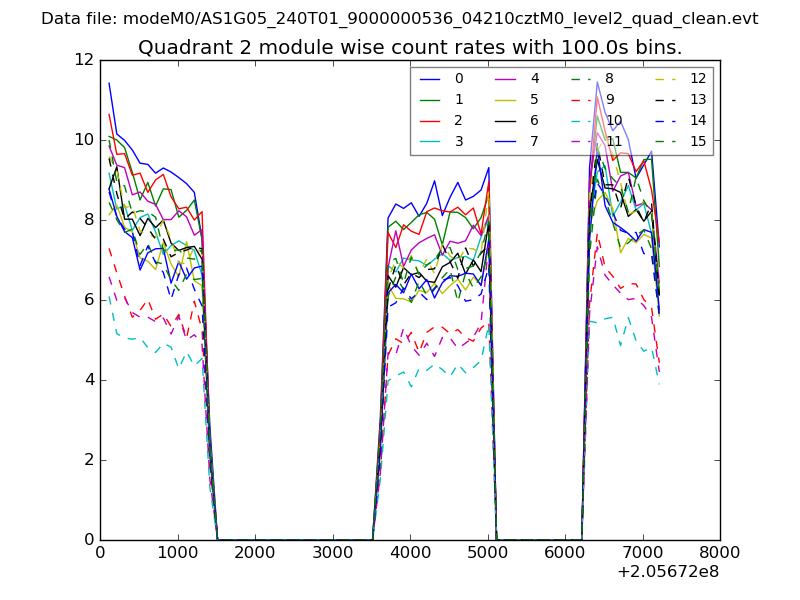
| Module-wise count rates for Quadrant B Data is divided into 100 sec bins |
 |
 |
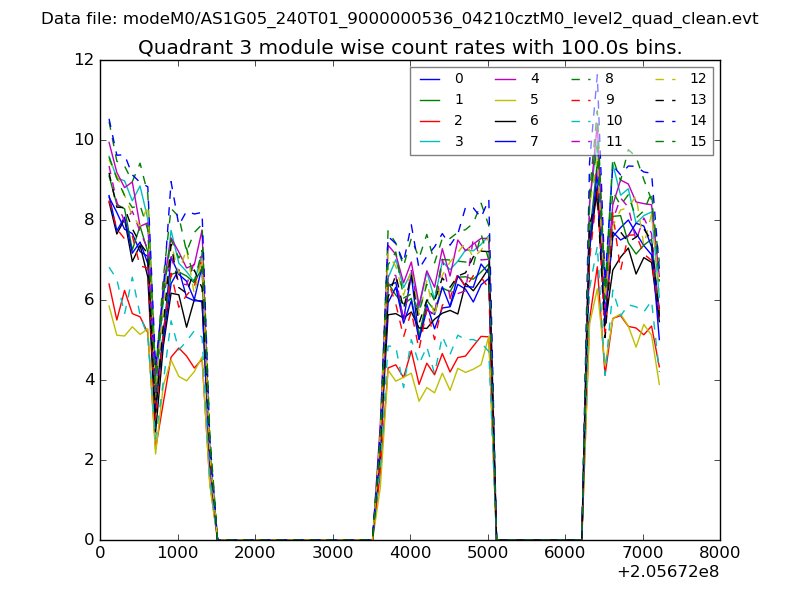
| Module-wise count rates for Quadrant C Data is divided into 100 sec bins |
 |
 |
| Module-wise count rates for Quadrant D Data is divided into 100 sec bins |
 |
 |
| Parameter | Plot |
|---|---|
| CZT HV Monitor | 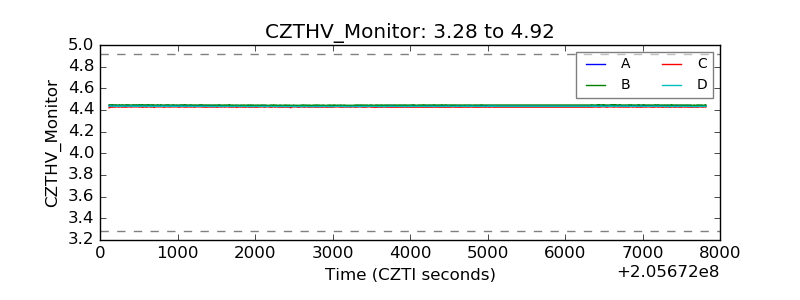 |
| D_VDD | 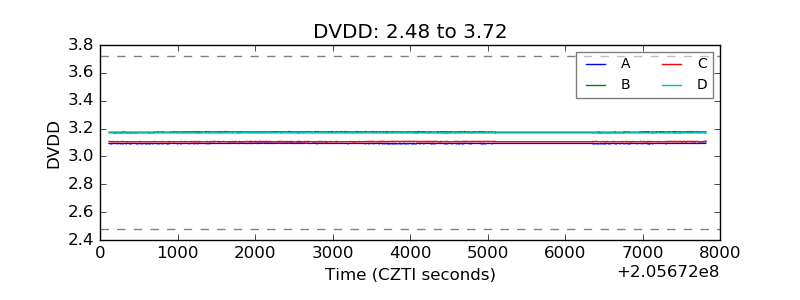 |
| Temperature 1 | 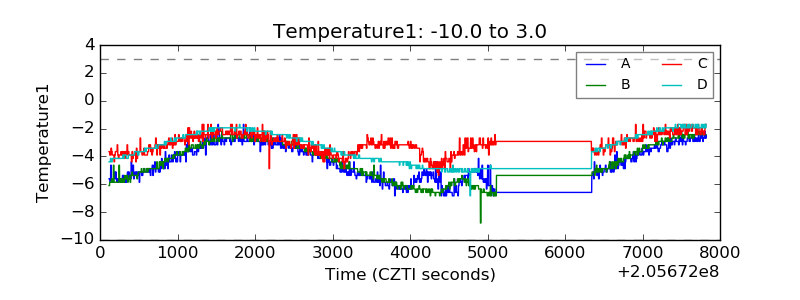 |
| Veto HV Monitor | 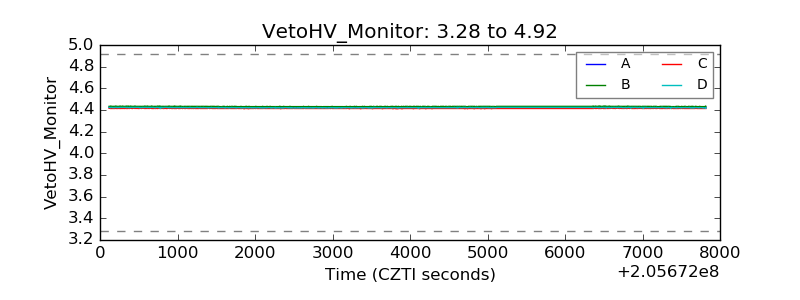 |
| Veto LLD | 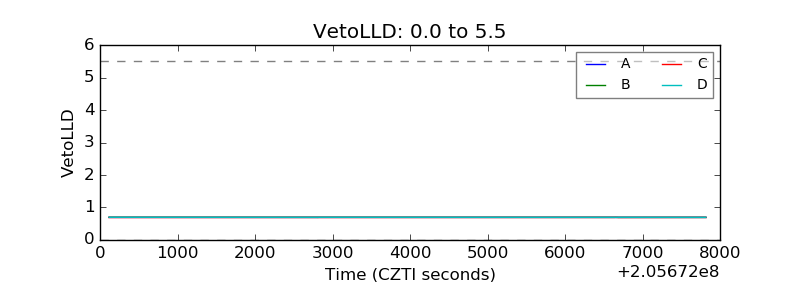 |
| Alpha Counter | 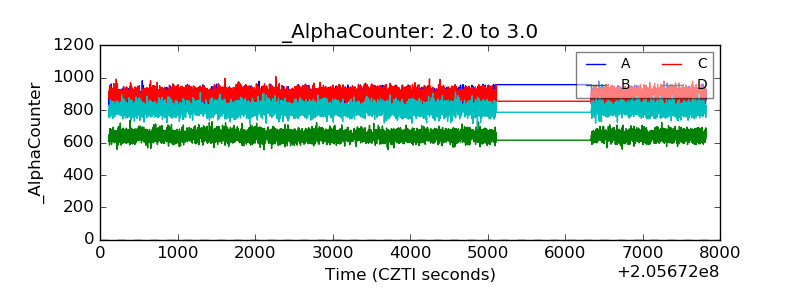 |
| _CPM_Rate | 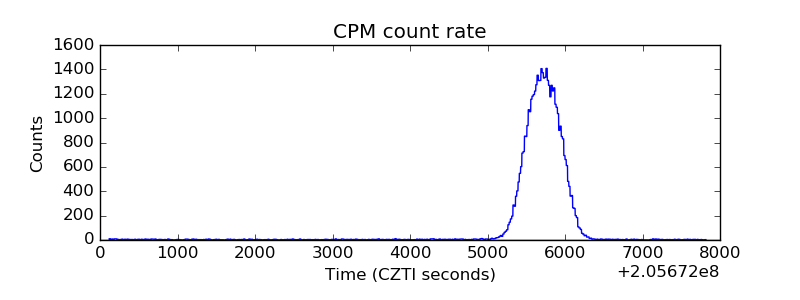 |
| CZT Counter |  |
| +2.5 Volts monitor |  |
| +5 Volts monitor |  |
| _ROLL_ROT | 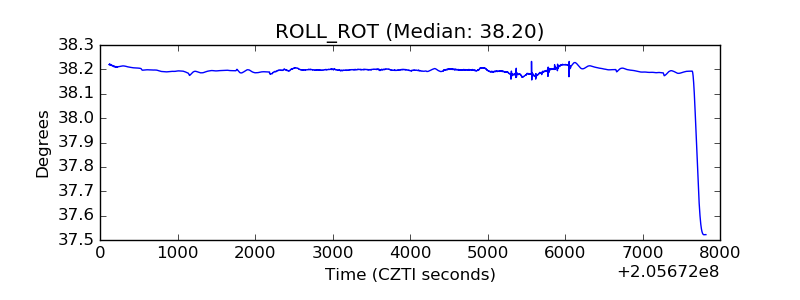 |
| _Roll_DEC | 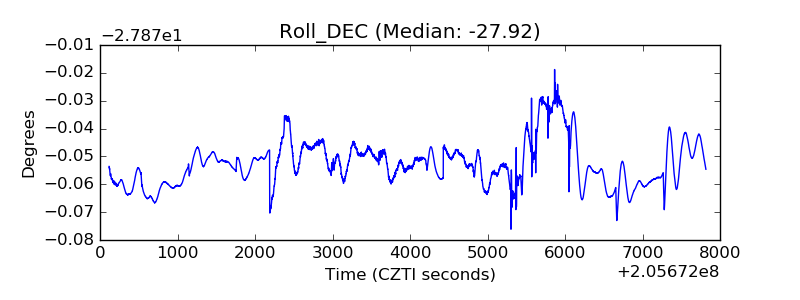 |
| _Roll_RA | 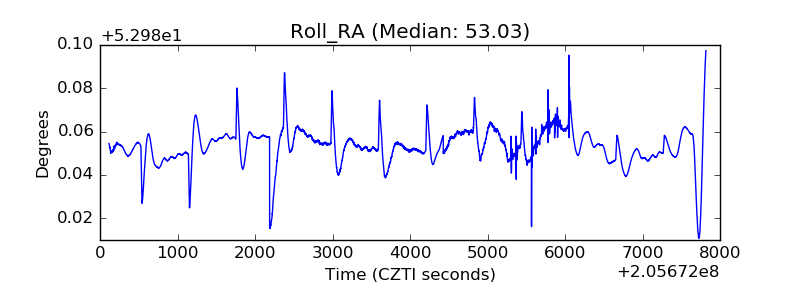 |
| Veto Counter | 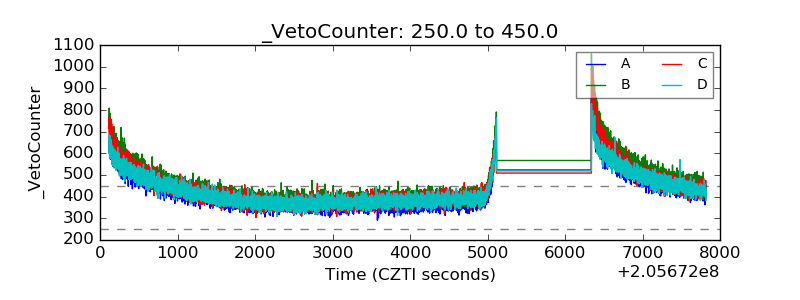 |