| Param | Original file | Final file |
|---|---|---|
| Filename | modeM0/AS1G05_240T01_9000000536_04212cztM0_level2.evt | modeM0/AS1G05_240T01_9000000536_04212cztM0_level2_quad_clean.evt |
| Size (bytes) | 499,512,960 | 59,538,240 |
| Size | 476.4 MB | 56.8 MB |
| Events in quadrant A | 3,436,379 | 345,961 |
| Events in quadrant B | 4,546,672 | 343,522 |
| Events in quadrant C | 3,079,294 | 336,523 |
| Events in quadrant D | 3,626,674 | 325,413 |
| Mode SS | |||
|---|---|---|---|
| Quadrant | BADHDUFLAG | Total packets | Discarded packets |
| A | 0 | 132 | 0 |
| B | 0 | 132 | 0 |
| C | 0 | 132 | 0 |
| D | 0 | 132 | 0 |
| Mode M9 | |||
|---|---|---|---|
| Quadrant | BADHDUFLAG | Total packets | Discarded packets |
| A | 0 | 13 | 0 |
| B | 0 | 13 | 0 |
| C | 0 | 13 | 0 |
| D | 0 | 13 | 0 |
| Mode M0 | |||
|---|---|---|---|
| Quadrant | BADHDUFLAG | Total packets | Discarded packets |
| A | 0 | 14088 | 3 |
| B | 0 | 17794 | 2 |
| C | 0 | 13306 | 2 |
| D | 0 | 15047 | 2 |
| Quadrant | Total seconds | Saturated seconds | Saturation percentage |
|---|---|---|---|
| A | 6461 | 139 | 2.151370% |
| B | 6461 | 273 | 4.225352% |
| C | 6461 | 50 | 0.773874% |
| D | 6462 | 192 | 2.971216% |
Noise dominated data is calculated using 1-second bins in cleaned event files. If a bin has >2000 counts, and if more than 50% of those come from <1% of pixels, then it is considered to be noise-dominated and hence unusable.
| Quadrant | # 1 sec bins | Bins with >0 counts | Bins with >2000 counts | High rate bins dominated by noise | Noise dominated (total time) | Noise dominated (detector-on time) | Marked lightcurve |
|---|---|---|---|---|---|---|---|
| A | 7751 | 6462 | 34 | 34 | 0.44% | 0.53% |  |
| B | 7751 | 6462 | 128 | 128 | 1.65% | 1.98% |  |
| C | 7751 | 6462 | 0 | 0 | 0.00% | 0.00% |  |
| D | 7752 | 6463 | 127 | 127 | 1.64% | 1.97% | 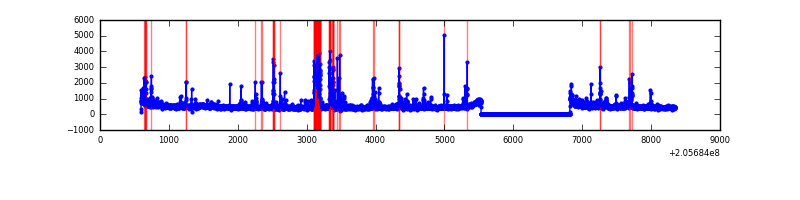 |
Top three noisy pixels from each quadrant. If the there are fewer than three noisy pixels in the level2.evt file, extra rows are filled as -1
| Pixel properties | Quadrant properties | ||||||
|---|---|---|---|---|---|---|---|
| Quadrant | DetID | PixID | Counts | Sigma | Mean | Median | Sigma |
| A | 15 | 234 | 144112 | 860.77 | 826 | 811 | 166.5 |
| A | 13 | 14 | 42869 | 252.63 | 826 | 811 | 166.5 |
| A | 0 | 50 | 32269 | 188.96 | 826 | 811 | 166.5 |
| B | 3 | 0 | 977293 | 6321.5 | 821 | 804 | 154.5 |
| B | 8 | 3 | 106197 | 682.28 | 821 | 804 | 154.5 |
| B | 14 | 167 | 105159 | 675.56 | 821 | 804 | 154.5 |
| C | 13 | 61 | 6538 | 31.51 | 787 | 792 | 182.4 |
| C | 14 | 48 | 3842 | 16.72 | 787 | 792 | 182.4 |
| C | 9 | 144 | 3595 | 15.37 | 787 | 792 | 182.4 |
| D | 2 | 232 | 493525 | 2628.4 | 784 | 763 | 187.5 |
| D | 13 | 239 | 49967 | 262.45 | 784 | 763 | 187.5 |
| D | 13 | 223 | 23438 | 120.95 | 784 | 763 | 187.5 |
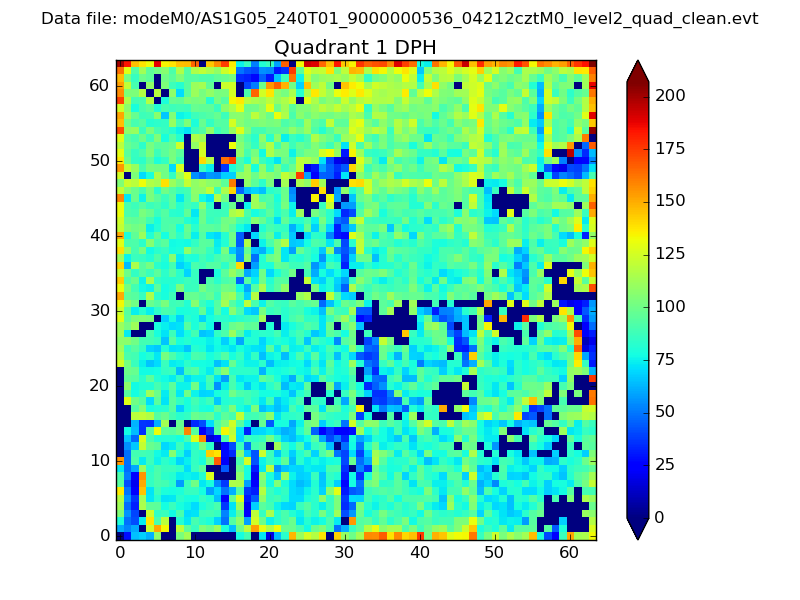
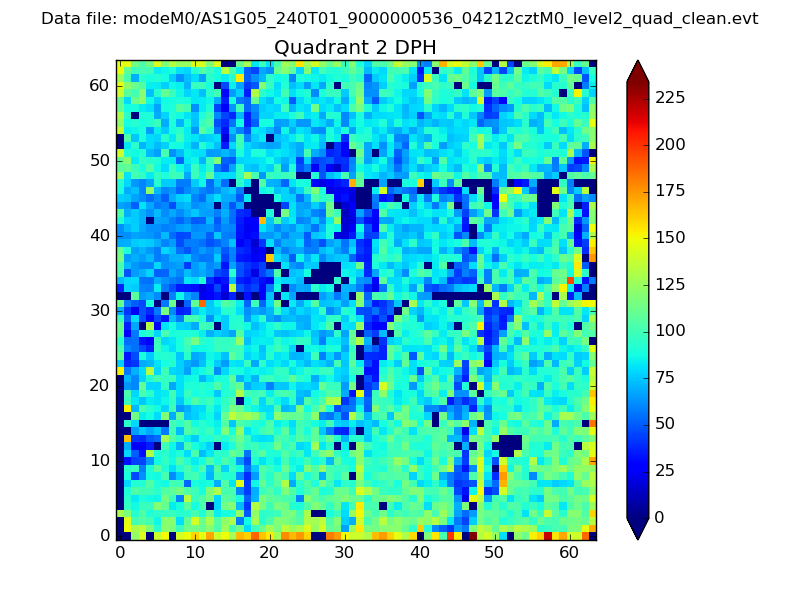
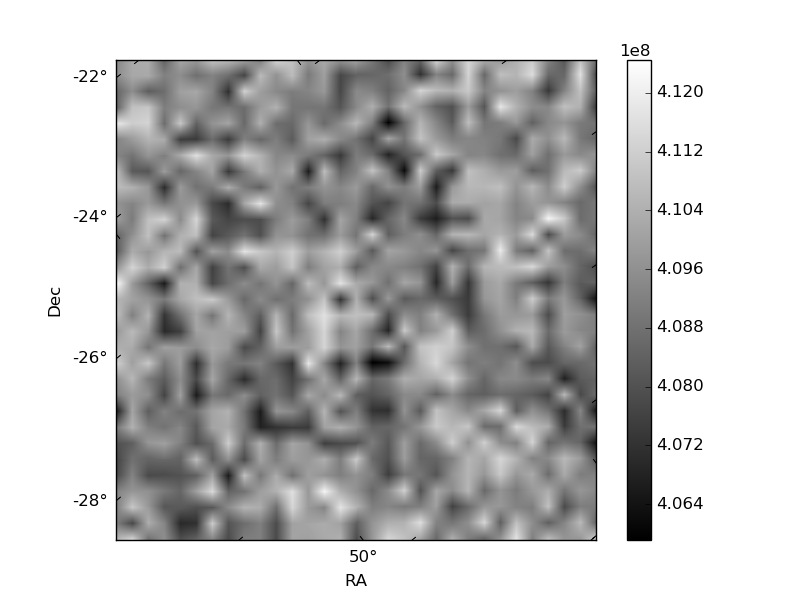
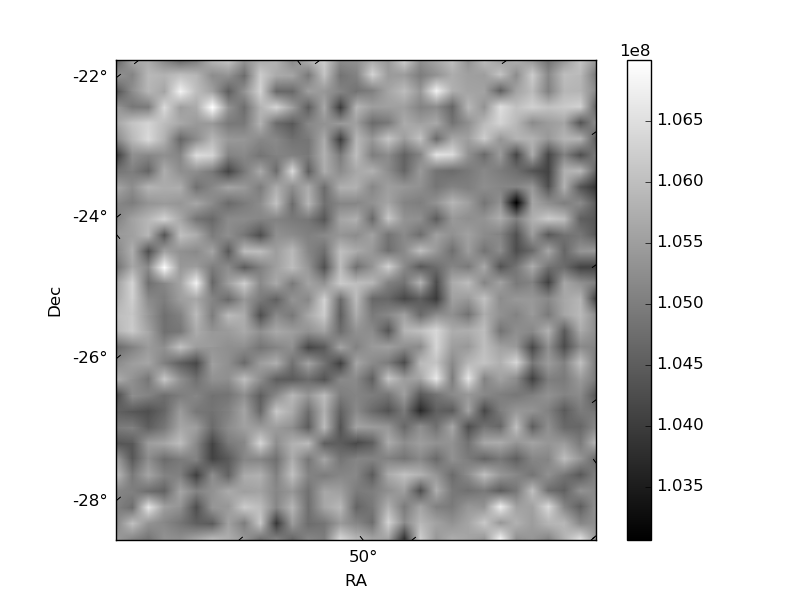
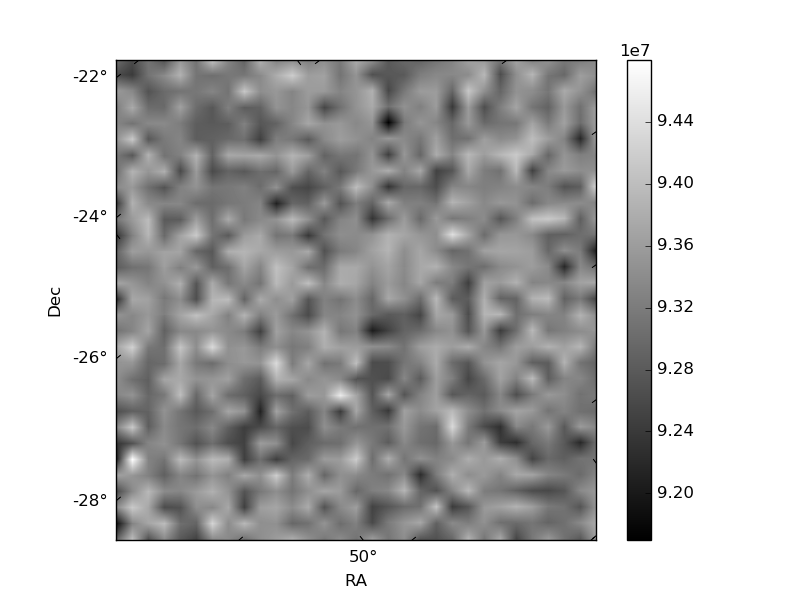
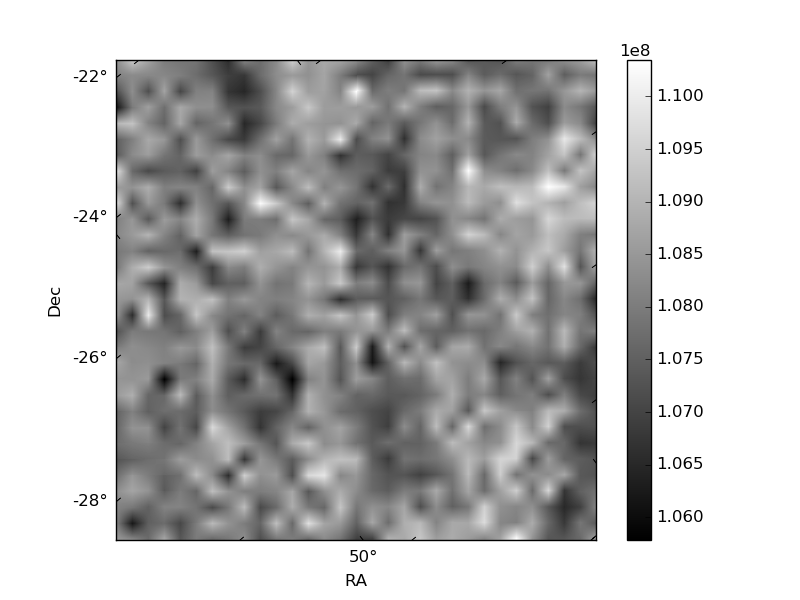
Histogram calculated using DETX and DETY for each event in the final _common_clean file
| Quadrant A |  |
 |
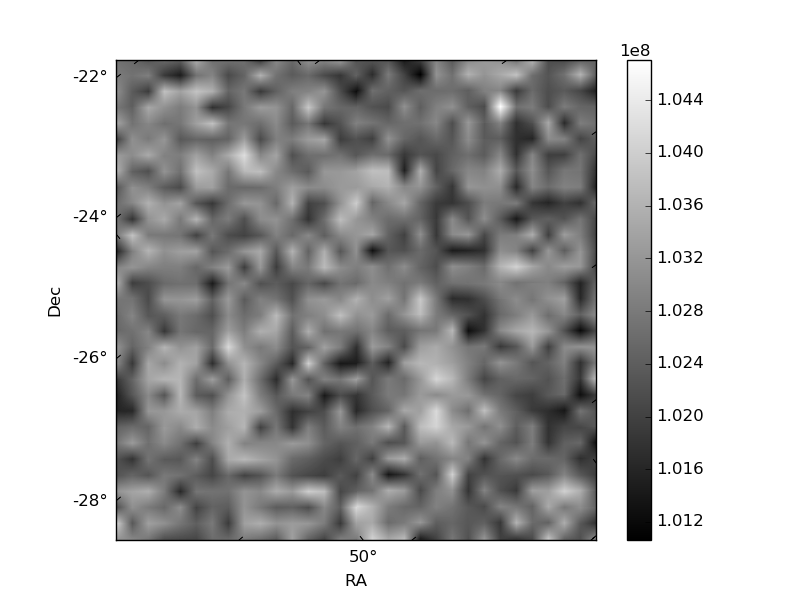
Quadrant B |
|---|---|---|---|
| Quadrant D | 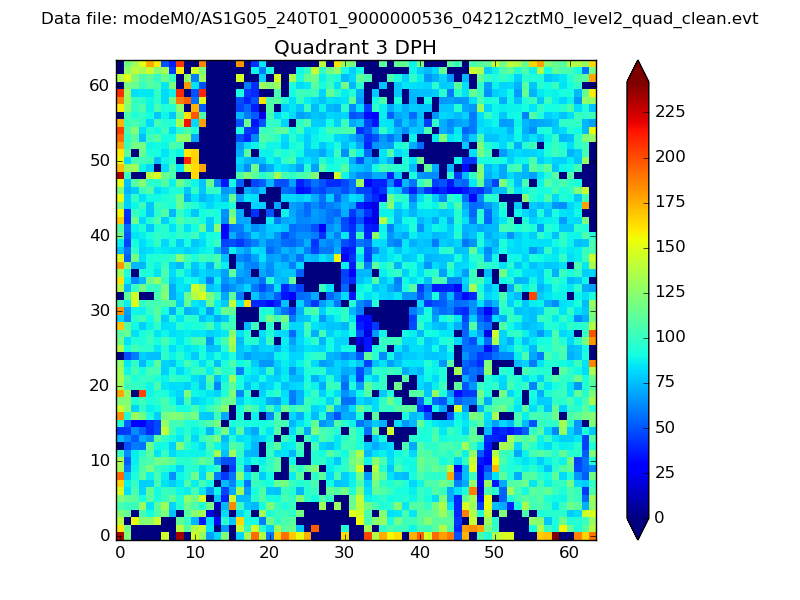 |
 |
Quadrant C |
| Plot type | Count rate plots | Images |
|---|---|---|
| Comparison with Poisson distribution Blue bars denote a histogram of data divided into 1 sec bins. Red curve is a Poisson curve with rate = median count rate of data. |
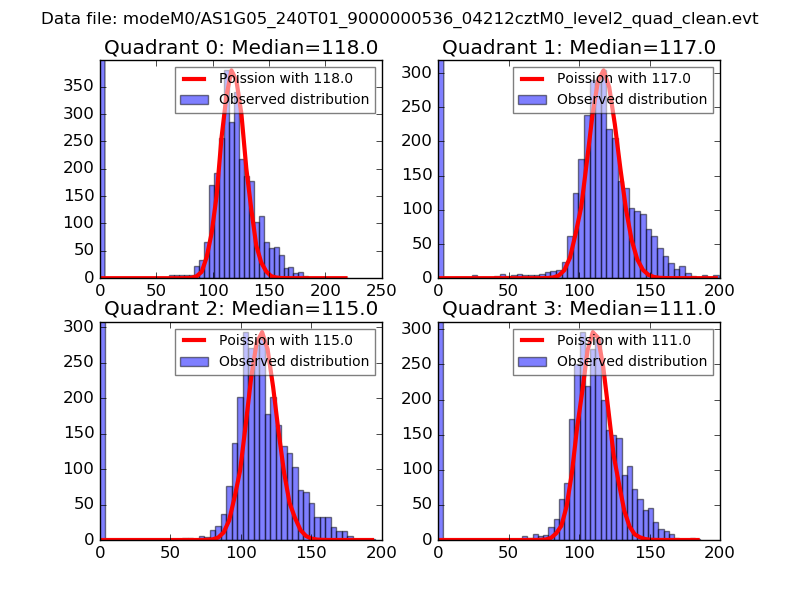 |
 |
| Quadrant-wise count rates Data is divided into 100 sec bins |
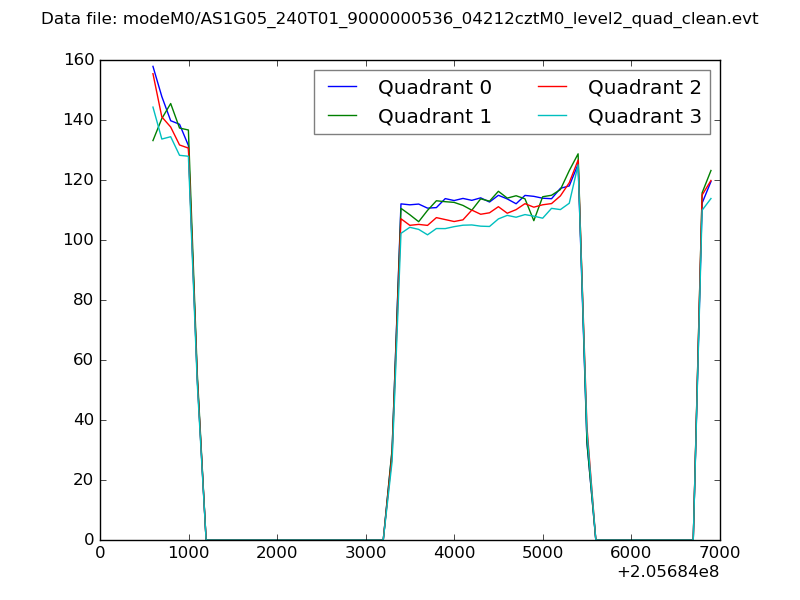 |
|
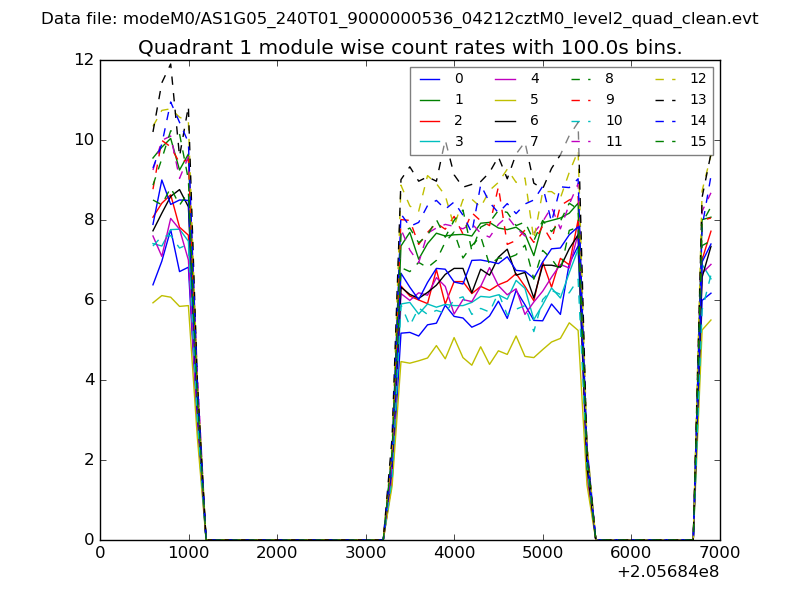
| Module-wise count rates for Quadrant A Data is divided into 100 sec bins |
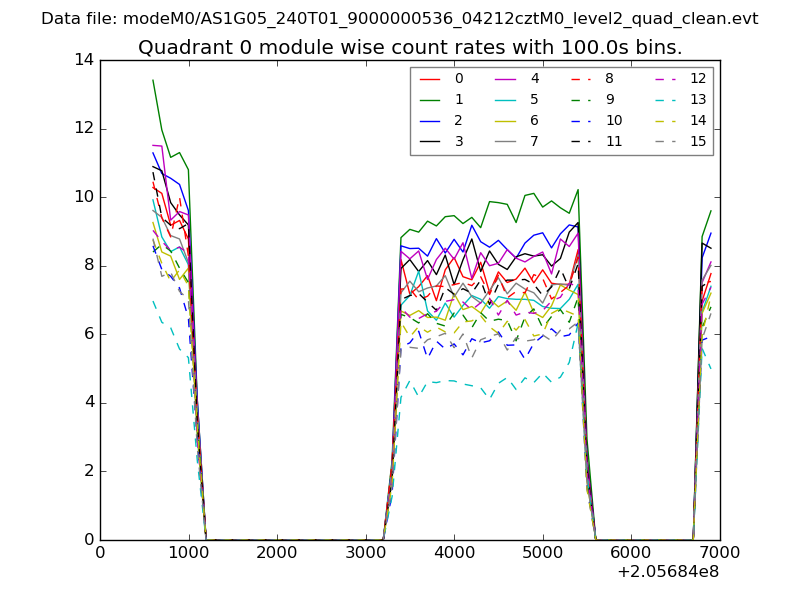 |
 |
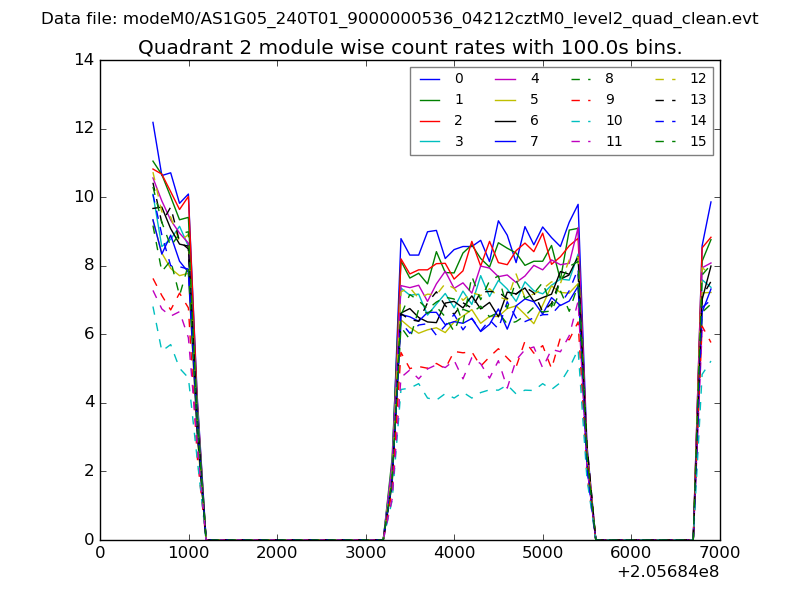
| Module-wise count rates for Quadrant B Data is divided into 100 sec bins |
 |
 |
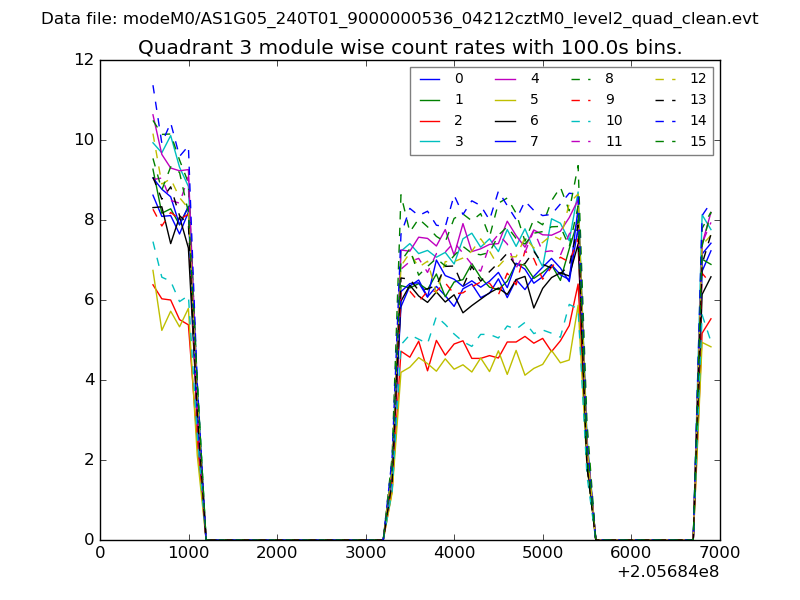
| Module-wise count rates for Quadrant C Data is divided into 100 sec bins |
 |
 |
| Module-wise count rates for Quadrant D Data is divided into 100 sec bins |
 |
 |
| Parameter | Plot |
|---|---|
| CZT HV Monitor | 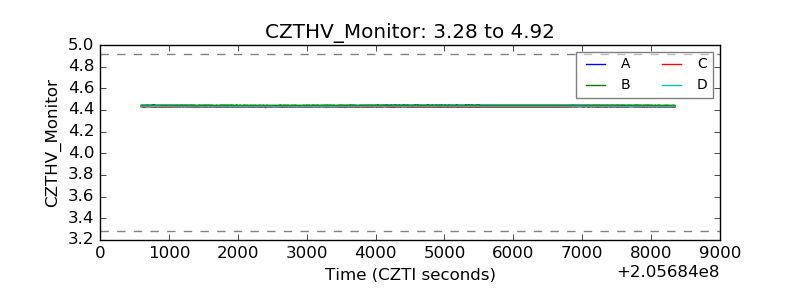 |
| D_VDD | 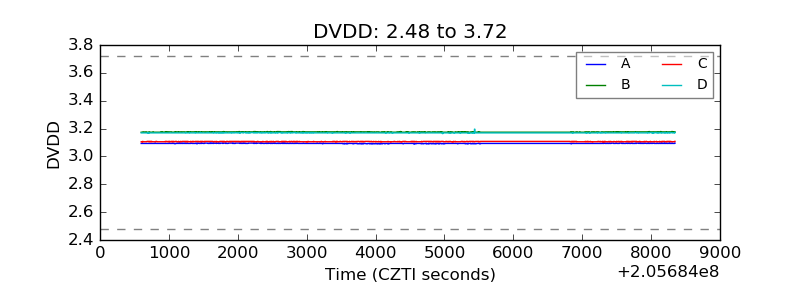 |
| Temperature 1 | 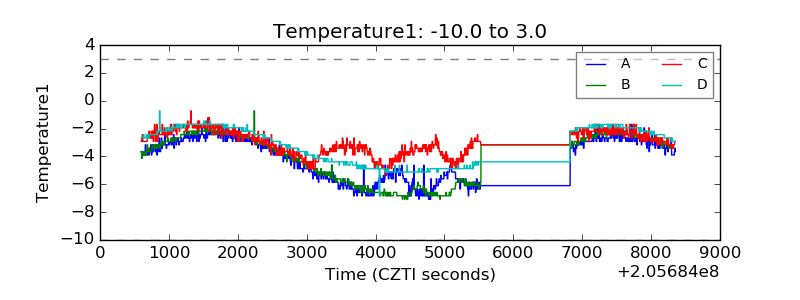 |
| Veto HV Monitor | 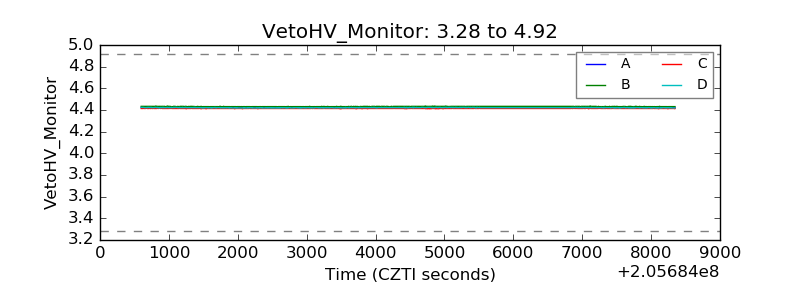 |
| Veto LLD | 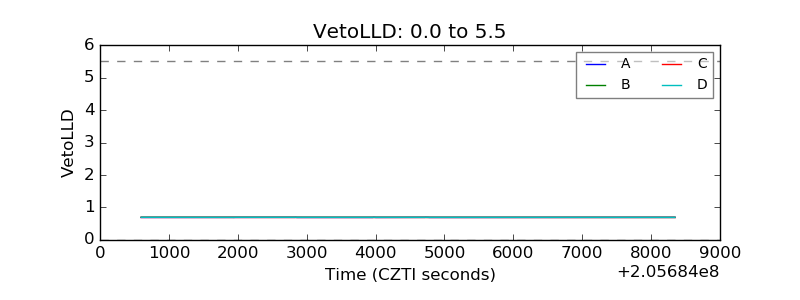 |
| Alpha Counter | 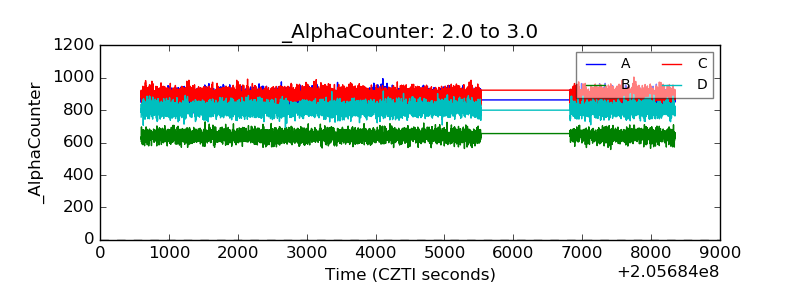 |
| _CPM_Rate | 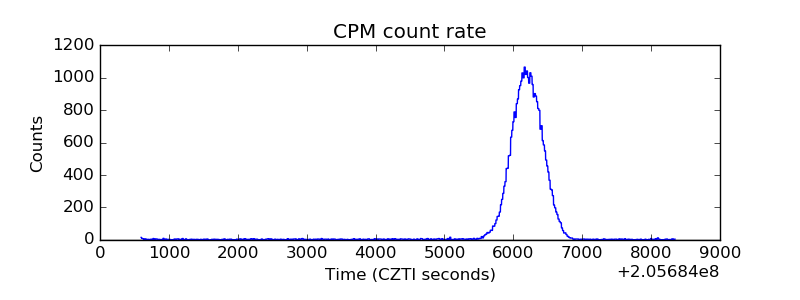 |
| CZT Counter | 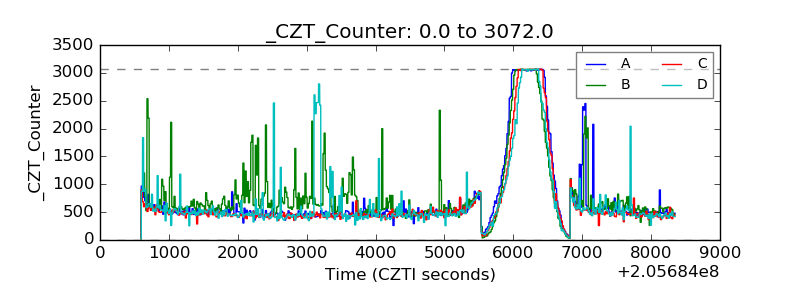 |
| +2.5 Volts monitor | 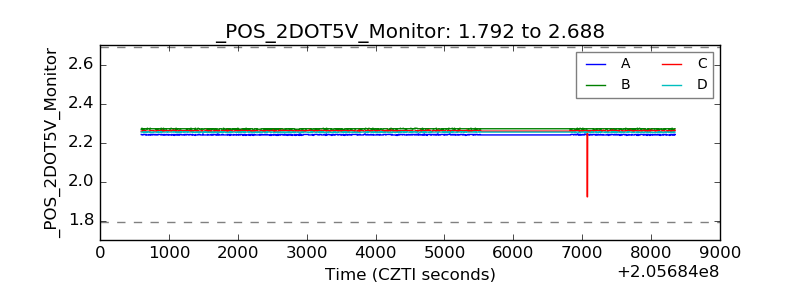 |
| +5 Volts monitor |  |
| _ROLL_ROT | 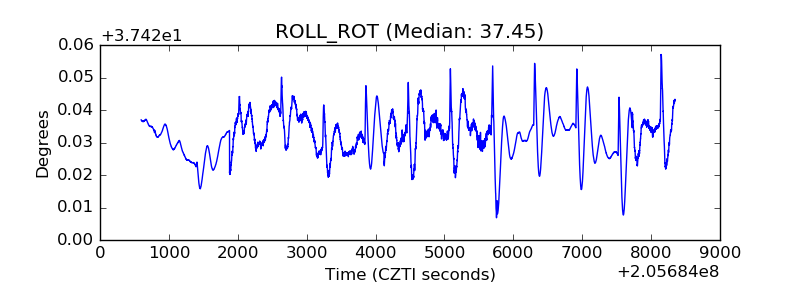 |
| _Roll_DEC | 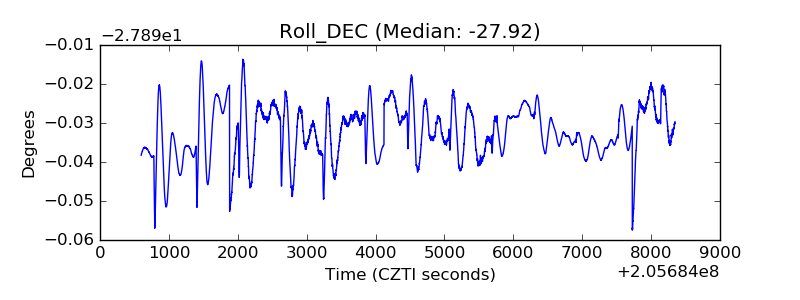 |
| _Roll_RA | 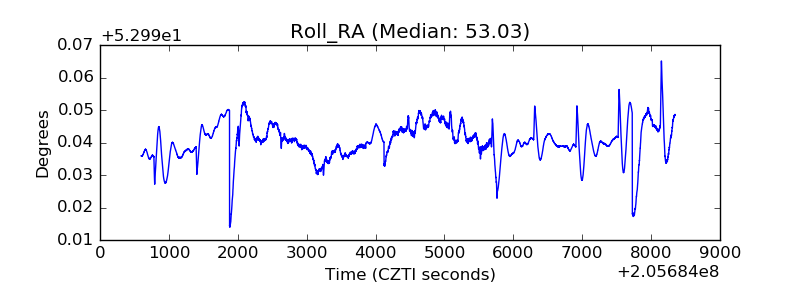 |
| Veto Counter | 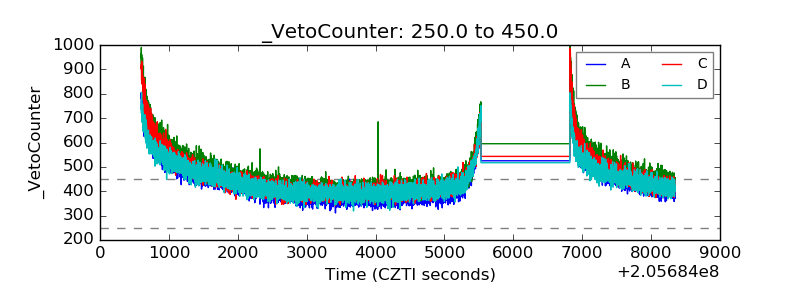 |