| Param | Original file | Final file |
|---|---|---|
| Filename | modeM0/AS1G05_240T01_9000000536_04213cztM0_level2.evt | modeM0/AS1G05_240T01_9000000536_04213cztM0_level2_quad_clean.evt |
| Size (bytes) | 457,064,640 | 55,471,680 |
| Size | 435.9 MB | 52.9 MB |
| Events in quadrant A | 3,306,082 | 314,881 |
| Events in quadrant B | 3,452,326 | 318,357 |
| Events in quadrant C | 2,990,131 | 307,521 |
| Events in quadrant D | 3,663,489 | 296,856 |
| Mode SS | |||
|---|---|---|---|
| Quadrant | BADHDUFLAG | Total packets | Discarded packets |
| A | 0 | 128 | 0 |
| B | 0 | 128 | 0 |
| C | 0 | 128 | 0 |
| D | 0 | 128 | 0 |
| Mode M9 | |||
|---|---|---|---|
| Quadrant | BADHDUFLAG | Total packets | Discarded packets |
| A | 0 | 12 | 0 |
| B | 0 | 12 | 0 |
| C | 0 | 12 | 0 |
| D | 0 | 12 | 0 |
| Mode M0 | |||
|---|---|---|---|
| Quadrant | BADHDUFLAG | Total packets | Discarded packets |
| A | 0 | 13807 | 3 |
| B | 0 | 14169 | 2 |
| C | 0 | 13089 | 2 |
| D | 0 | 15252 | 2 |
| Quadrant | Total seconds | Saturated seconds | Saturation percentage |
|---|---|---|---|
| A | 6329 | 177 | 2.796650% |
| B | 6329 | 192 | 3.033655% |
| C | 6329 | 92 | 1.453626% |
| D | 6329 | 304 | 4.803286% |
Noise dominated data is calculated using 1-second bins in cleaned event files. If a bin has >2000 counts, and if more than 50% of those come from <1% of pixels, then it is considered to be noise-dominated and hence unusable.
| Quadrant | # 1 sec bins | Bins with >0 counts | Bins with >2000 counts | High rate bins dominated by noise | Noise dominated (total time) | Noise dominated (detector-on time) | Marked lightcurve |
|---|---|---|---|---|---|---|---|
| A | 7509 | 6330 | 33 | 33 | 0.44% | 0.52% | 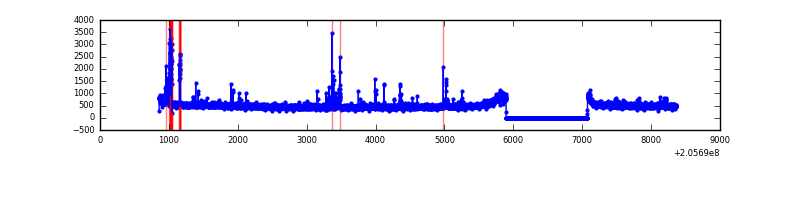 |
| B | 7509 | 6330 | 44 | 44 | 0.59% | 0.70% | 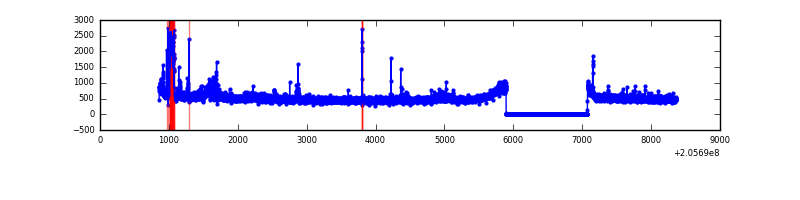 |
| C | 7509 | 6330 | 0 | 0 | 0.00% | 0.00% | 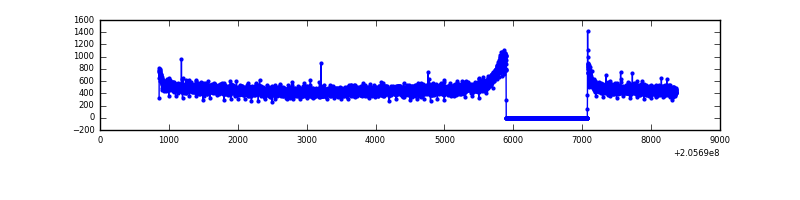 |
| D | 7509 | 6330 | 149 | 149 | 1.98% | 2.35% | 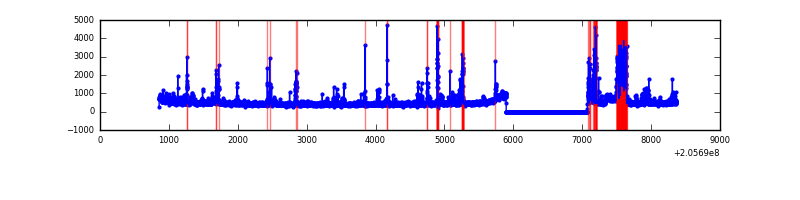 |
Top three noisy pixels from each quadrant. If the there are fewer than three noisy pixels in the level2.evt file, extra rows are filled as -1
| Pixel properties | Quadrant properties | ||||||
|---|---|---|---|---|---|---|---|
| Quadrant | DetID | PixID | Counts | Sigma | Mean | Median | Sigma |
| A | 15 | 234 | 124246 | 769.01 | 791 | 773 | 160.6 |
| A | 0 | 50 | 73204 | 451.11 | 791 | 773 | 160.6 |
| A | 14 | 111 | 19192 | 114.72 | 791 | 773 | 160.6 |
| B | 3 | 0 | 165932 | 1079.98 | 798 | 782 | 152.9 |
| B | 8 | 3 | 69113 | 446.84 | 798 | 782 | 152.9 |
| B | 15 | 204 | 49208 | 316.68 | 798 | 782 | 152.9 |
| C | 9 | 144 | 13610 | 72.52 | 761 | 763 | 177.2 |
| C | 13 | 61 | 6276 | 31.12 | 761 | 763 | 177.2 |
| C | 12 | 4 | 2705 | 10.96 | 761 | 763 | 177.2 |
| D | 2 | 232 | 522097 | 2848.72 | 751 | 729 | 183.0 |
| D | 13 | 239 | 111801 | 606.89 | 751 | 729 | 183.0 |
| D | 10 | 172 | 72772 | 393.64 | 751 | 729 | 183.0 |
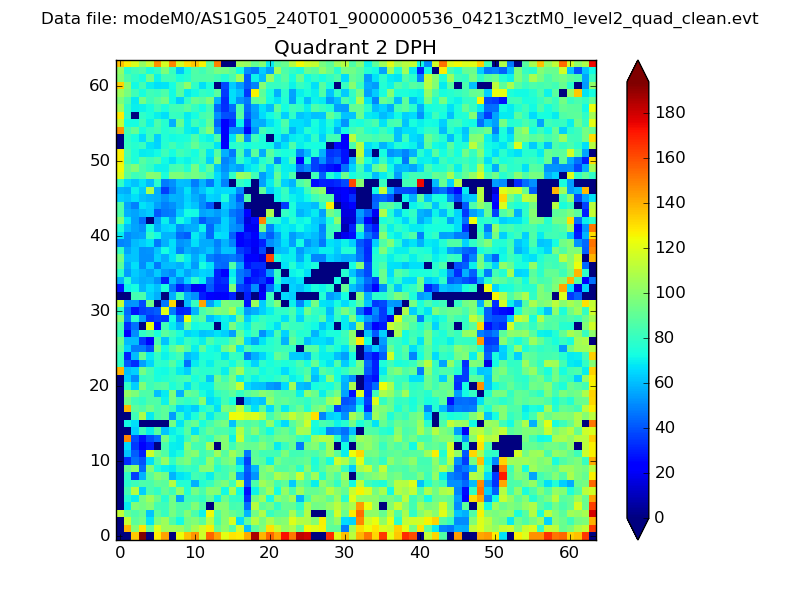
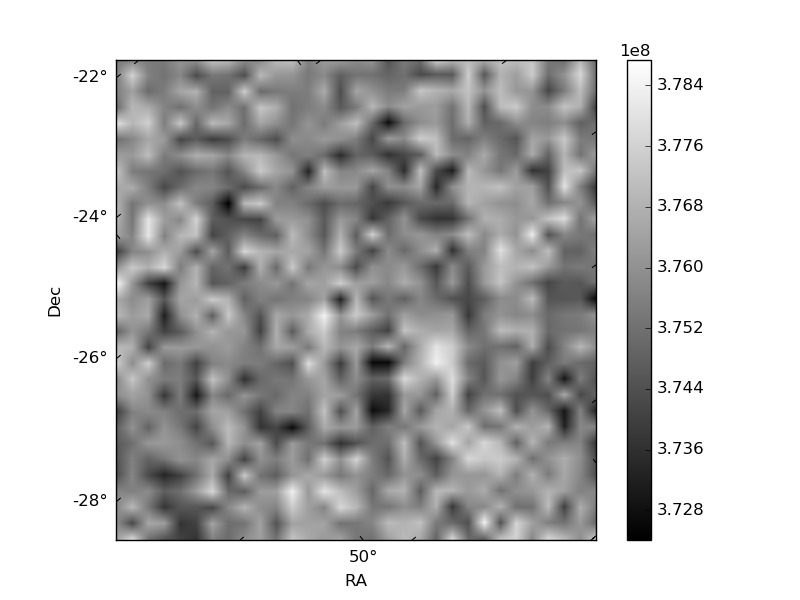
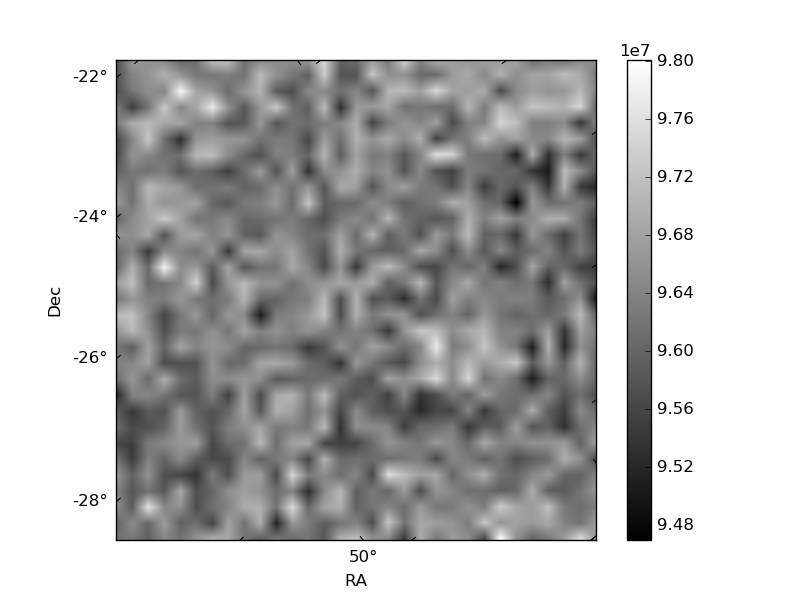
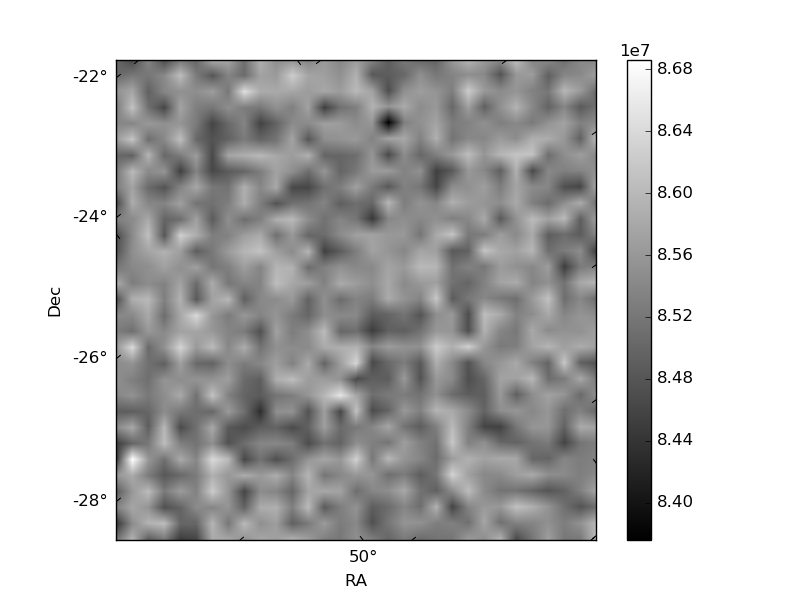
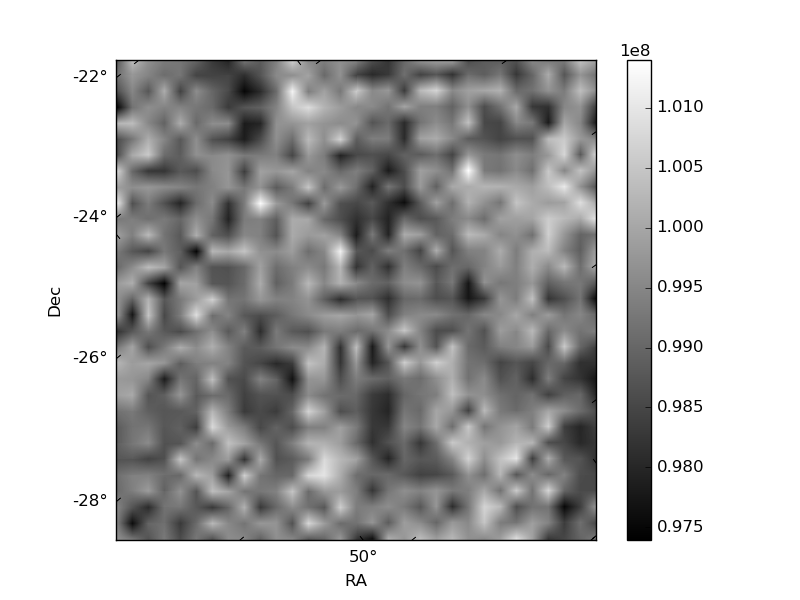
Histogram calculated using DETX and DETY for each event in the final _common_clean file
| Quadrant A | 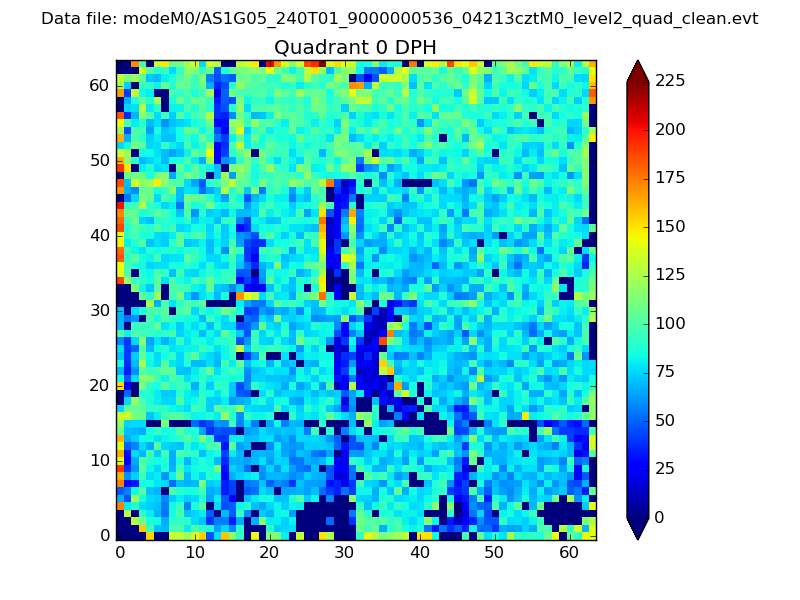 |
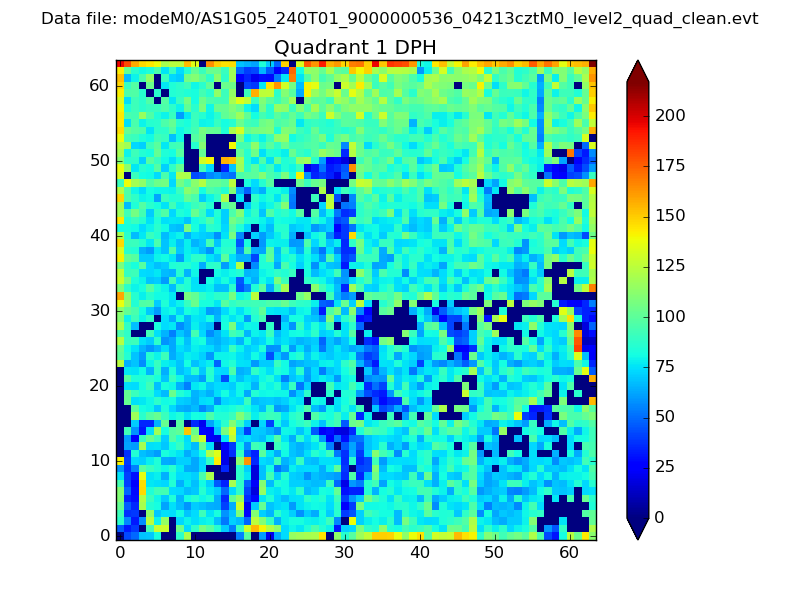 |
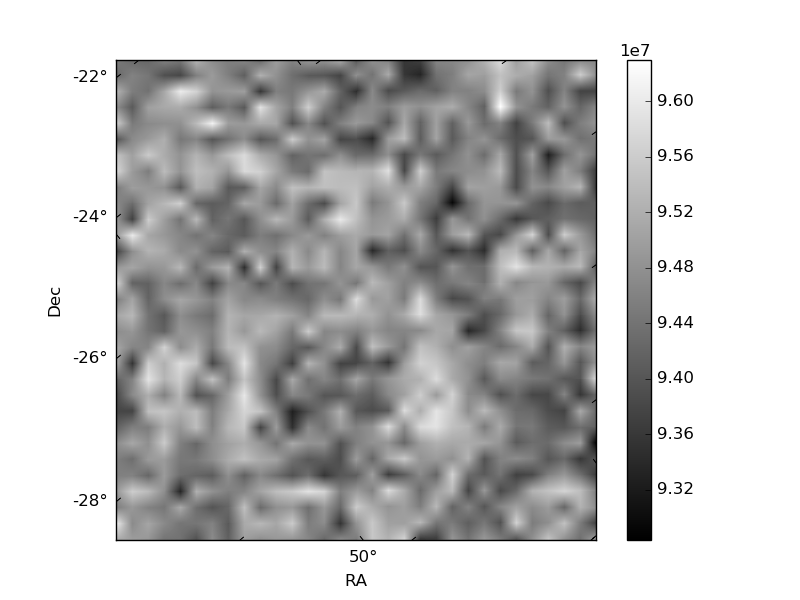
Quadrant B |
|---|---|---|---|
| Quadrant D | 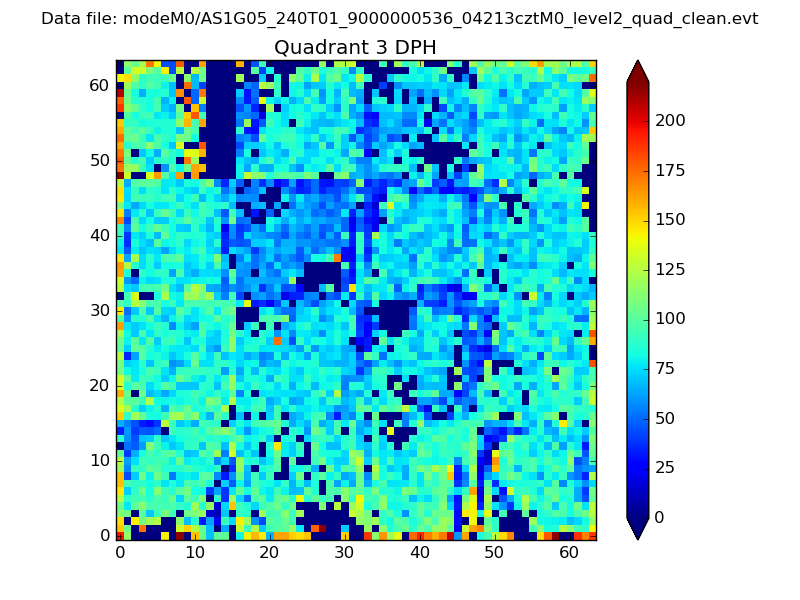 |
 |
Quadrant C |
| Plot type | Count rate plots | Images |
|---|---|---|
| Comparison with Poisson distribution Blue bars denote a histogram of data divided into 1 sec bins. Red curve is a Poisson curve with rate = median count rate of data. |
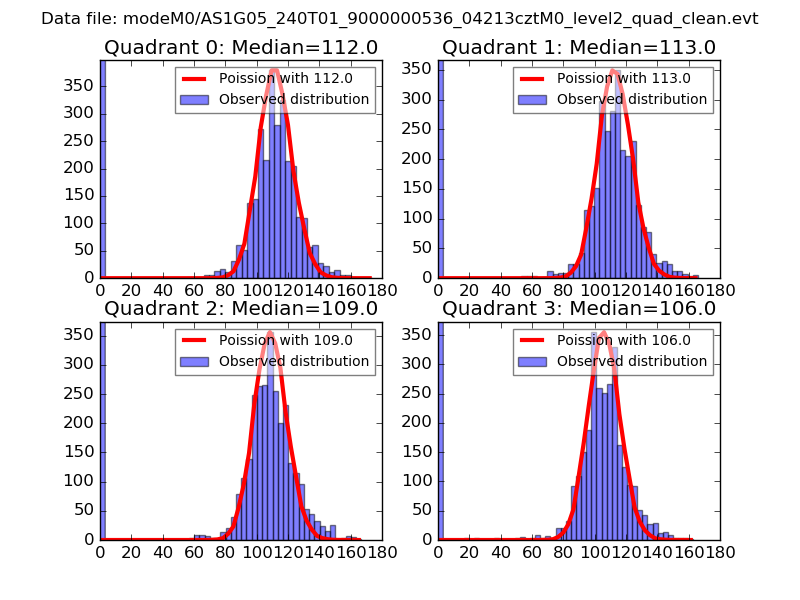 |
 |
| Quadrant-wise count rates Data is divided into 100 sec bins |
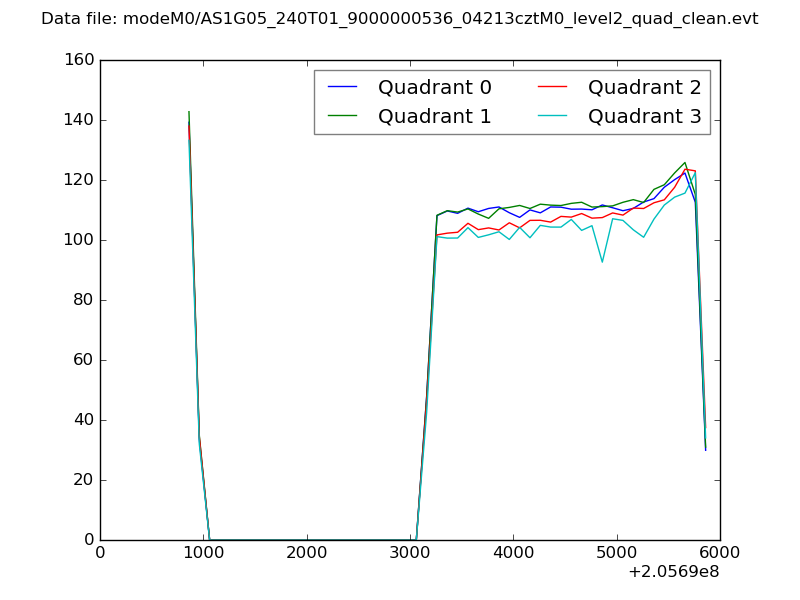 |
|
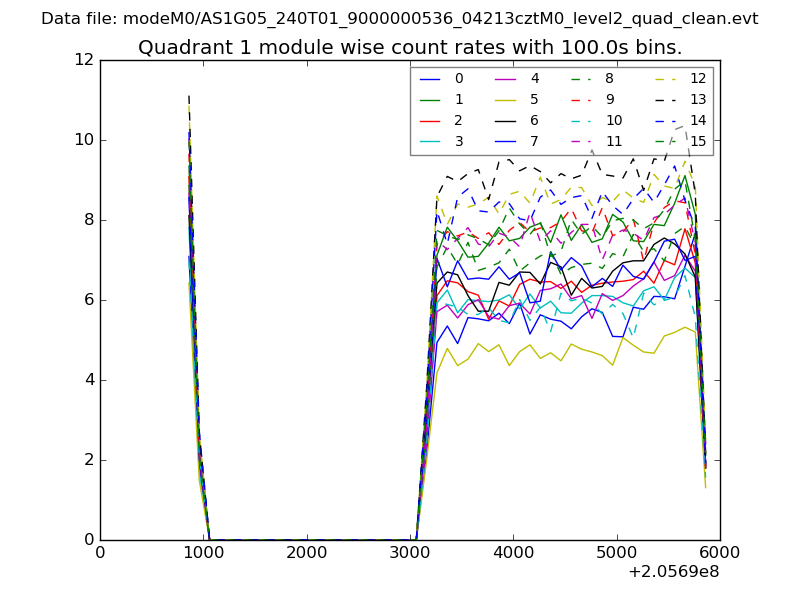
| Module-wise count rates for Quadrant A Data is divided into 100 sec bins |
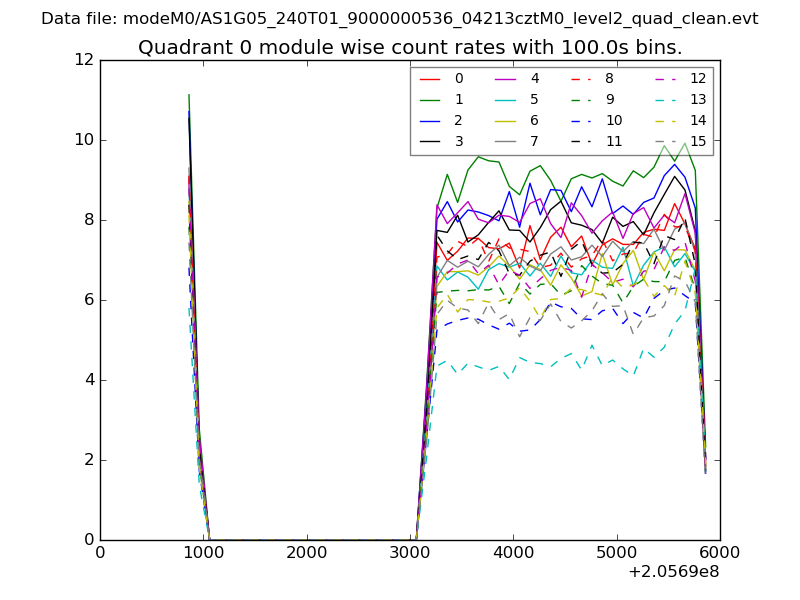 |
 |
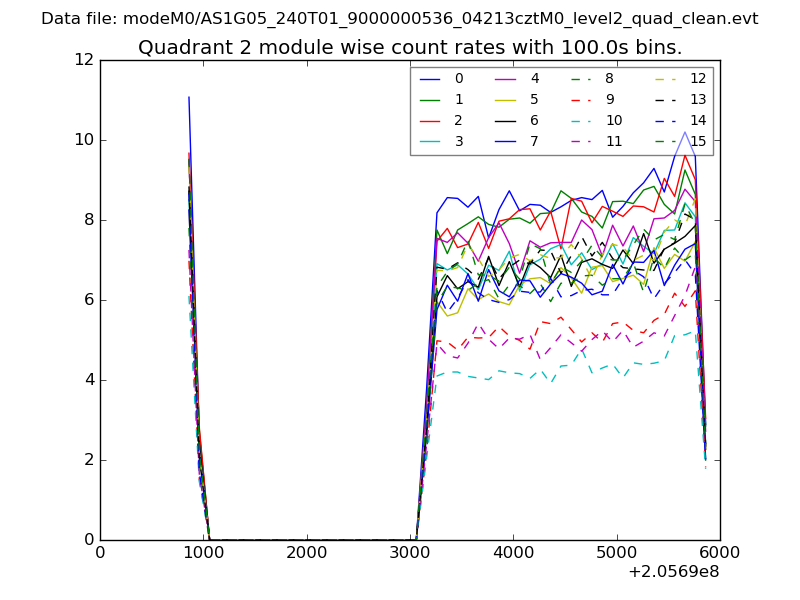
| Module-wise count rates for Quadrant B Data is divided into 100 sec bins |
 |
 |
| Module-wise count rates for Quadrant C Data is divided into 100 sec bins |
 |
 |
| Module-wise count rates for Quadrant D Data is divided into 100 sec bins |
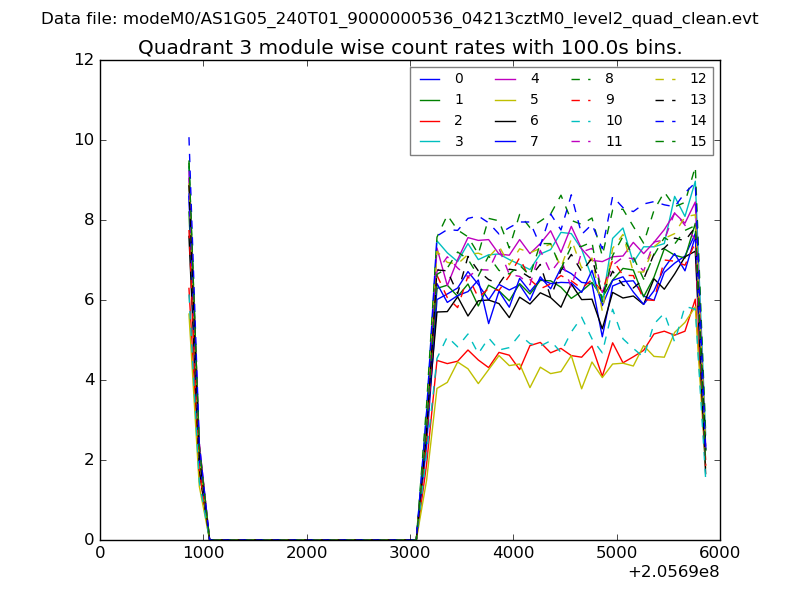 |
 |
| Parameter | Plot |
|---|---|
| CZT HV Monitor | 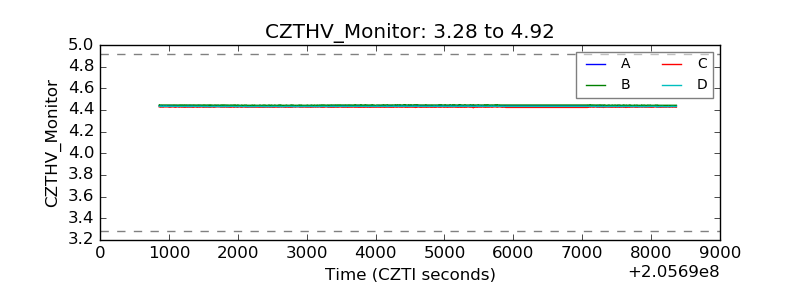 |
| D_VDD | 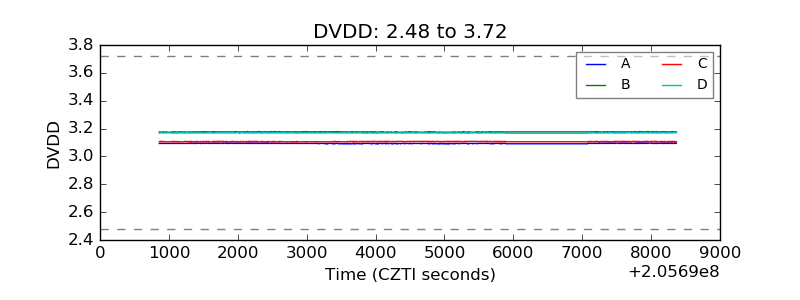 |
| Temperature 1 |  |
| Veto HV Monitor | 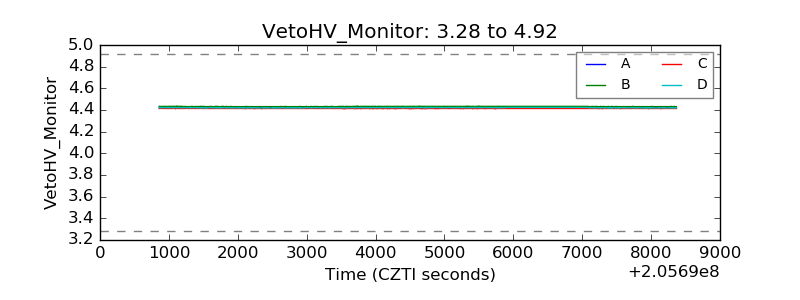 |
| Veto LLD |  |
| Alpha Counter | 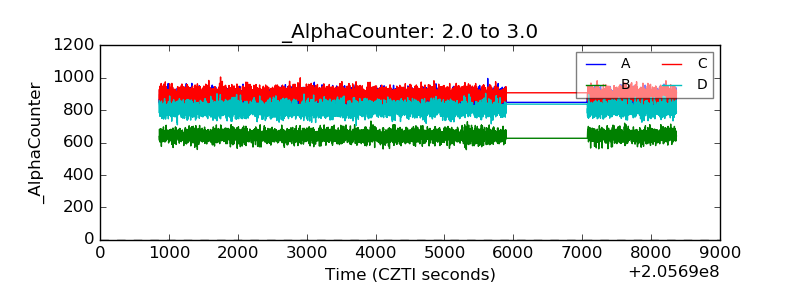 |
| _CPM_Rate | 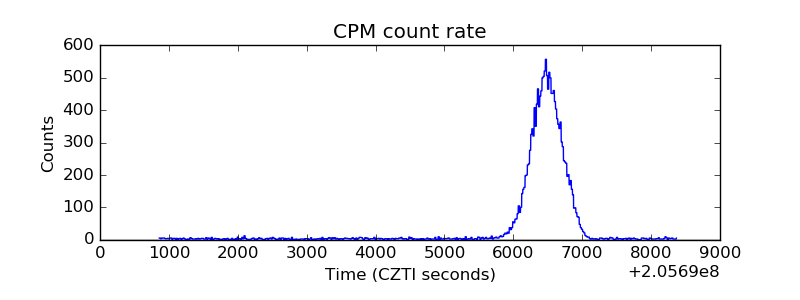 |
| CZT Counter | 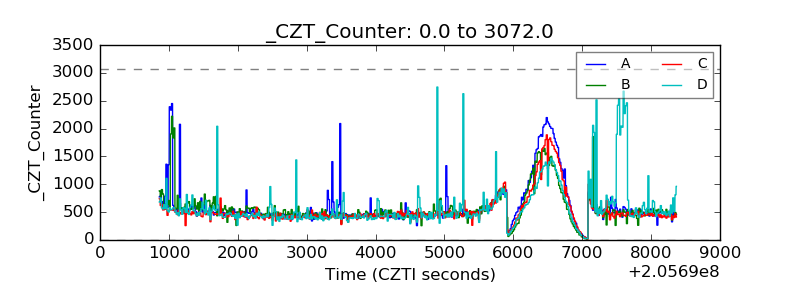 |
| +2.5 Volts monitor |  |
| +5 Volts monitor | 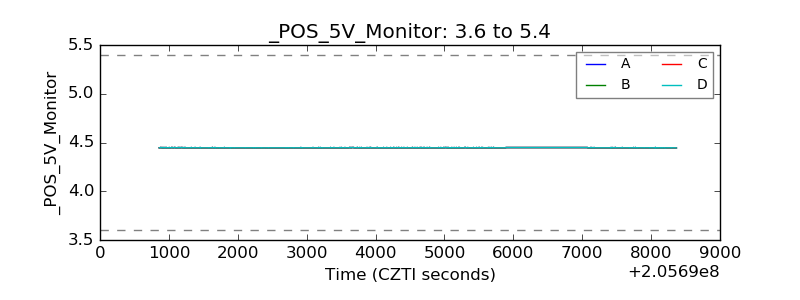 |
| _ROLL_ROT |  |
| _Roll_DEC | 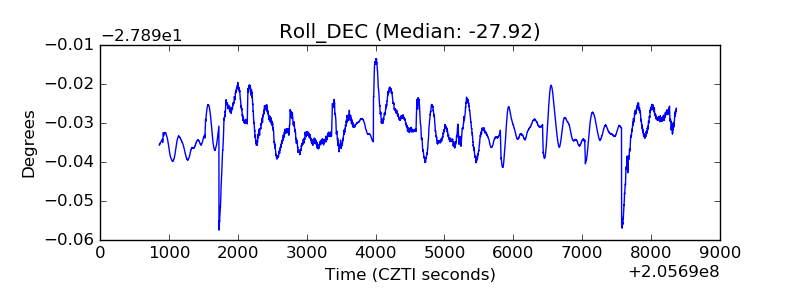 |
| _Roll_RA | 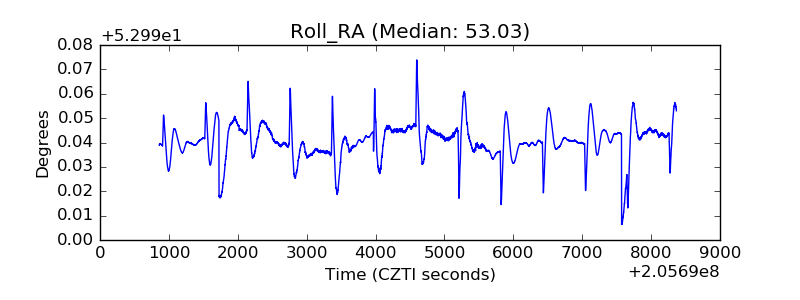 |
| Veto Counter | 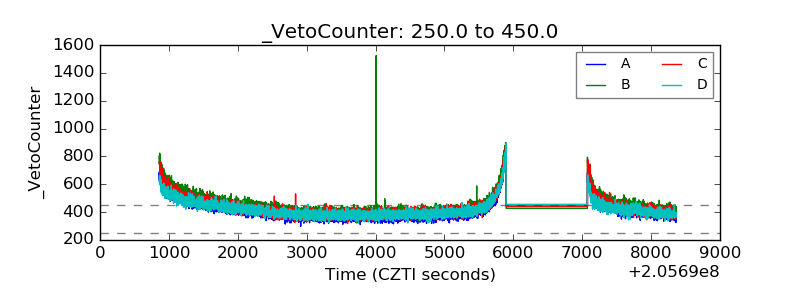 |