| Param | Original file | Final file |
|---|---|---|
| Filename | modeM0/AS1G05_240T01_9000000536_04214cztM0_level2.evt | modeM0/AS1G05_240T01_9000000536_04214cztM0_level2_quad_clean.evt |
| Size (bytes) | 551,145,600 | 61,459,200 |
| Size | 525.6 MB | 58.6 MB |
| Events in quadrant A | 4,732,684 | 339,432 |
| Events in quadrant B | 3,284,933 | 361,458 |
| Events in quadrant C | 3,079,345 | 351,148 |
| Events in quadrant D | 5,142,039 | 343,278 |
| Mode SS | |||
|---|---|---|---|
| Quadrant | BADHDUFLAG | Total packets | Discarded packets |
| A | 0 | 136 | 0 |
| B | 0 | 136 | 0 |
| C | 0 | 136 | 0 |
| D | 0 | 136 | 0 |
| Mode M9 | |||
|---|---|---|---|
| Quadrant | BADHDUFLAG | Total packets | Discarded packets |
| A | 0 | 18 | 0 |
| B | 0 | 18 | 0 |
| C | 0 | 18 | 0 |
| D | 0 | 19 | 0 |
| Mode M0 | |||
|---|---|---|---|
| Quadrant | BADHDUFLAG | Total packets | Discarded packets |
| A | 0 | 18495 | 3 |
| B | 0 | 14060 | 2 |
| C | 0 | 13758 | 2 |
| D | 0 | 19976 | 2 |
| Quadrant | Total seconds | Saturated seconds | Saturation percentage |
|---|---|---|---|
| A | 6670 | 455 | 6.821589% |
| B | 6670 | 97 | 1.454273% |
| C | 6670 | 48 | 0.719640% |
| D | 6670 | 598 | 8.965517% |
Noise dominated data is calculated using 1-second bins in cleaned event files. If a bin has >2000 counts, and if more than 50% of those come from <1% of pixels, then it is considered to be noise-dominated and hence unusable.
| Quadrant | # 1 sec bins | Bins with >0 counts | Bins with >2000 counts | High rate bins dominated by noise | Noise dominated (total time) | Noise dominated (detector-on time) | Marked lightcurve |
|---|---|---|---|---|---|---|---|
| A | 7635 | 6671 | 240 | 240 | 3.14% | 3.60% | 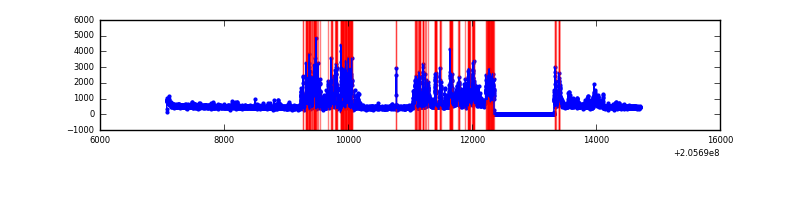 |
| B | 7635 | 6671 | 0 | 0 | 0.00% | 0.00% | 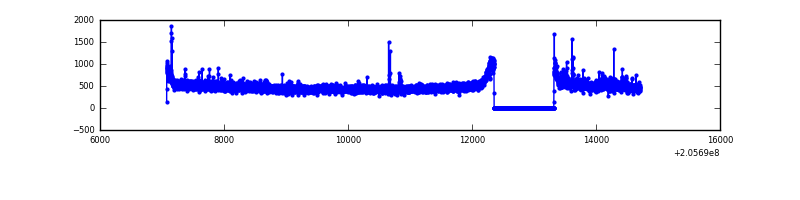 |
| C | 7635 | 6671 | 0 | 0 | 0.00% | 0.00% | 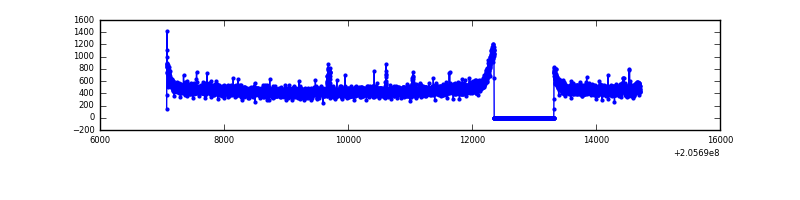 |
| D | 7634 | 6670 | 406 | 406 | 5.32% | 6.09% | 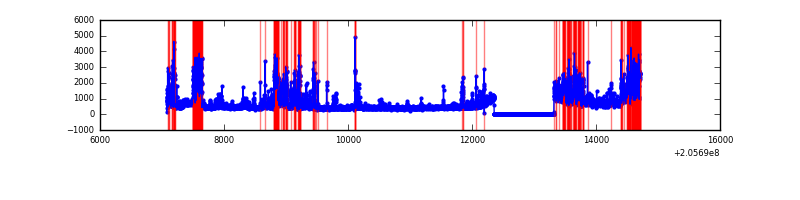 |
Top three noisy pixels from each quadrant. If the there are fewer than three noisy pixels in the level2.evt file, extra rows are filled as -1
| Pixel properties | Quadrant properties | ||||||
|---|---|---|---|---|---|---|---|
| Quadrant | DetID | PixID | Counts | Sigma | Mean | Median | Sigma |
| A | 0 | 50 | 1328599 | 8305.48 | 783 | 765 | 159.9 |
| A | 0 | 199 | 225069 | 1403.0 | 783 | 765 | 159.9 |
| A | 3 | 1 | 57061 | 352.13 | 783 | 765 | 159.9 |
| B | 15 | 204 | 53043 | 335.94 | 812 | 795 | 155.5 |
| B | 14 | 167 | 35402 | 222.52 | 812 | 795 | 155.5 |
| B | 3 | 0 | 22656 | 140.56 | 812 | 795 | 155.5 |
| C | 9 | 144 | 46219 | 251.15 | 772 | 775 | 180.9 |
| C | 10 | 65 | 6688 | 32.68 | 772 | 775 | 180.9 |
| C | 13 | 61 | 6463 | 31.44 | 772 | 775 | 180.9 |
| D | 2 | 232 | 1438581 | 7899.34 | 751 | 729 | 182.0 |
| D | 11 | 132 | 305747 | 1675.72 | 751 | 729 | 182.0 |
| D | 9 | 85 | 196146 | 1073.59 | 751 | 729 | 182.0 |
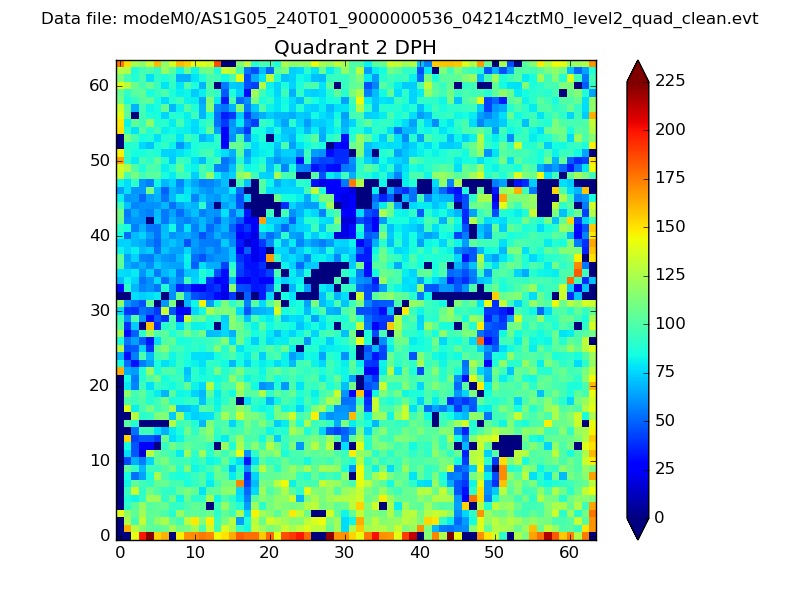
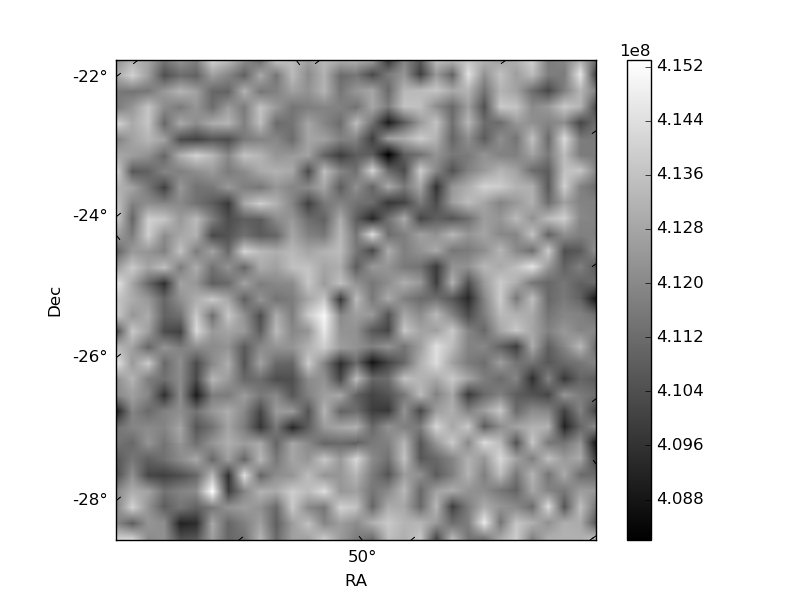
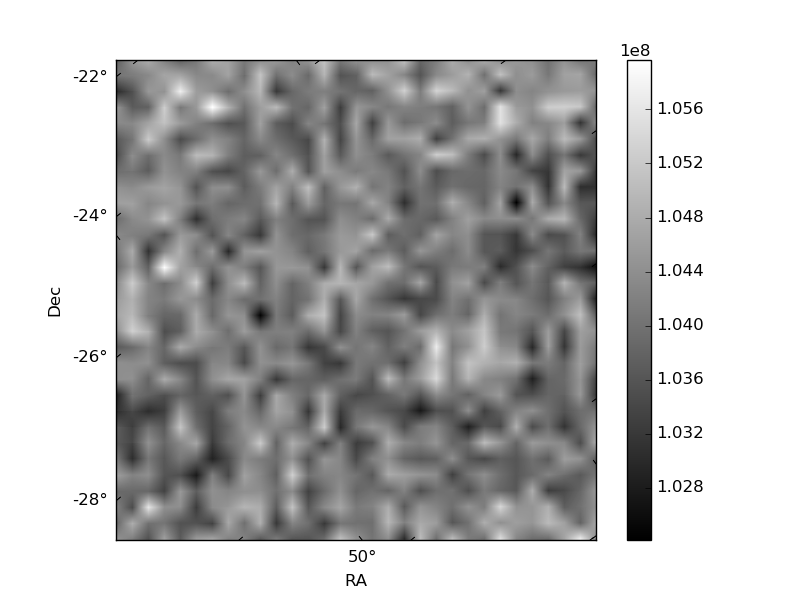
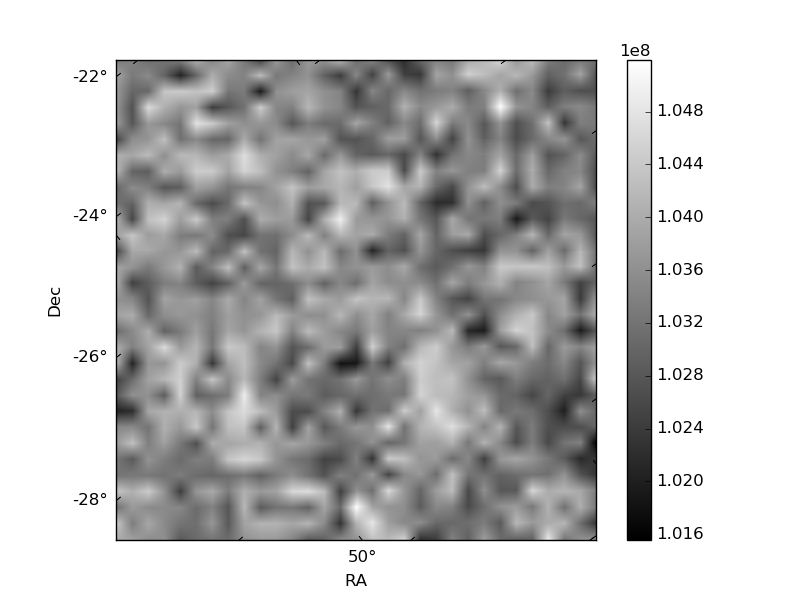
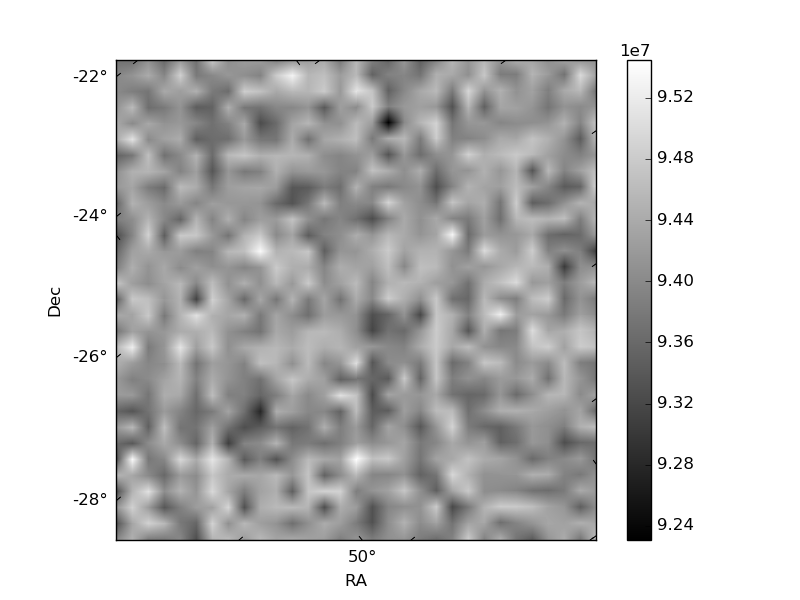
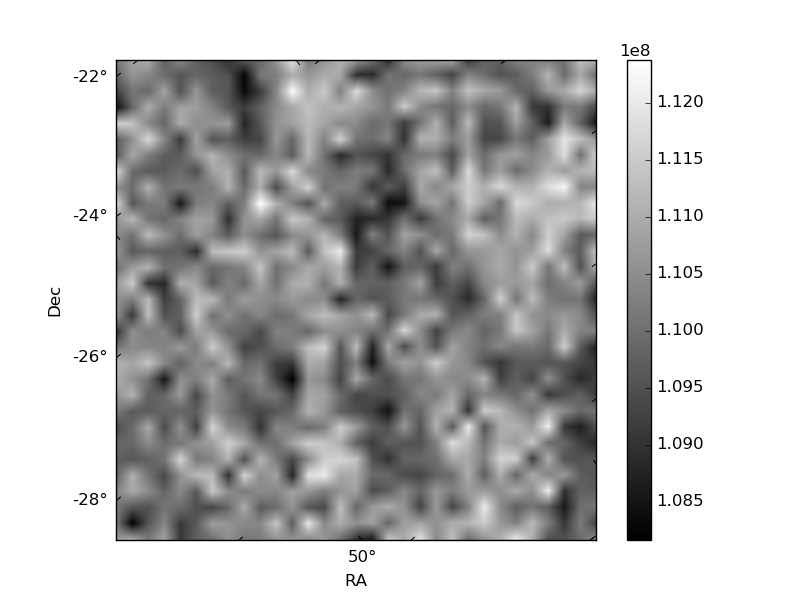
Histogram calculated using DETX and DETY for each event in the final _common_clean file
| Quadrant A | 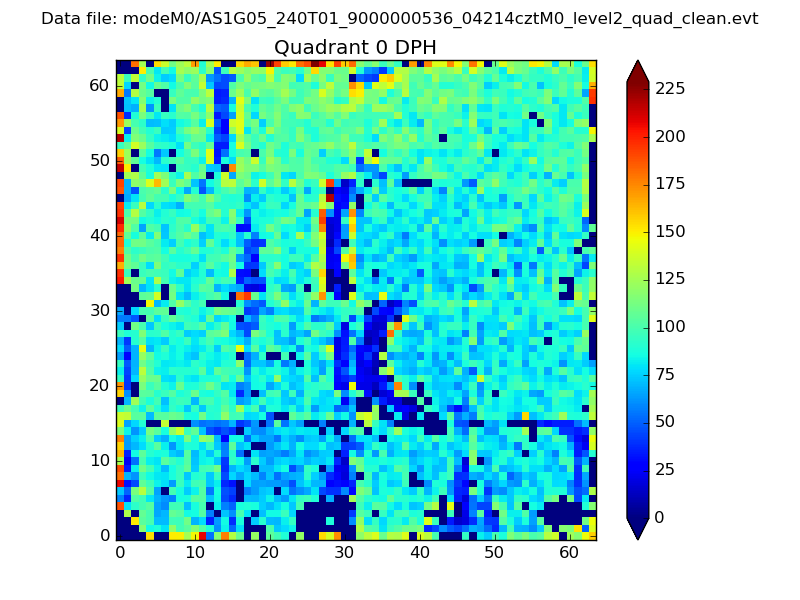 |
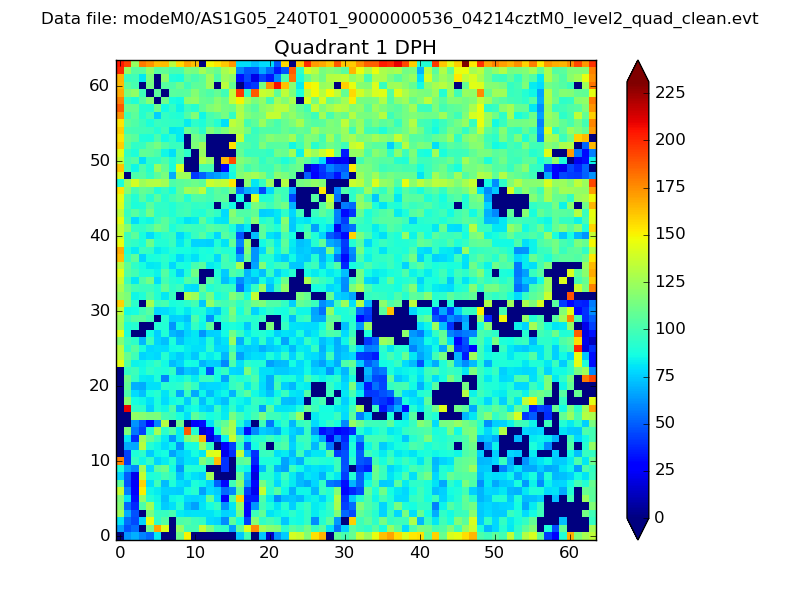 |
Quadrant B |
|---|---|---|---|
| Quadrant D | 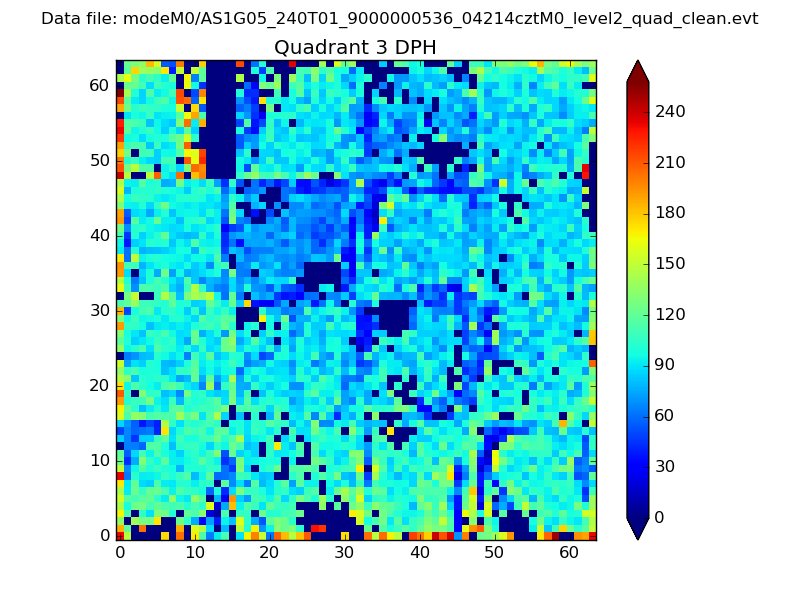 |
 |
Quadrant C |
| Plot type | Count rate plots | Images |
|---|---|---|
| Comparison with Poisson distribution Blue bars denote a histogram of data divided into 1 sec bins. Red curve is a Poisson curve with rate = median count rate of data. |
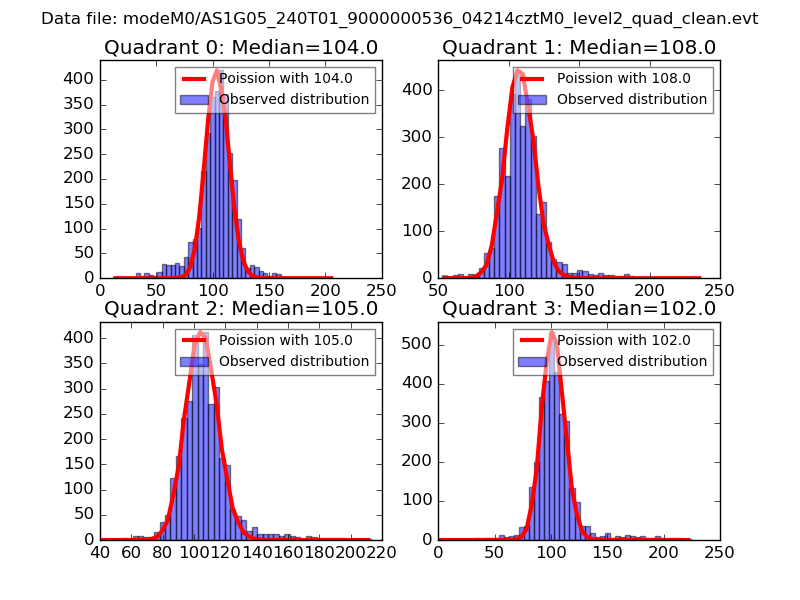 |
 |
| Quadrant-wise count rates Data is divided into 100 sec bins |
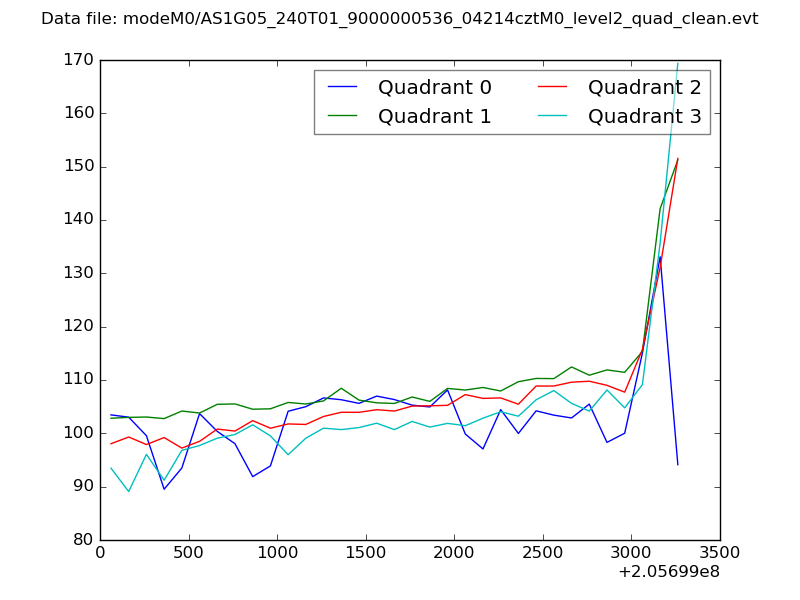 |
|
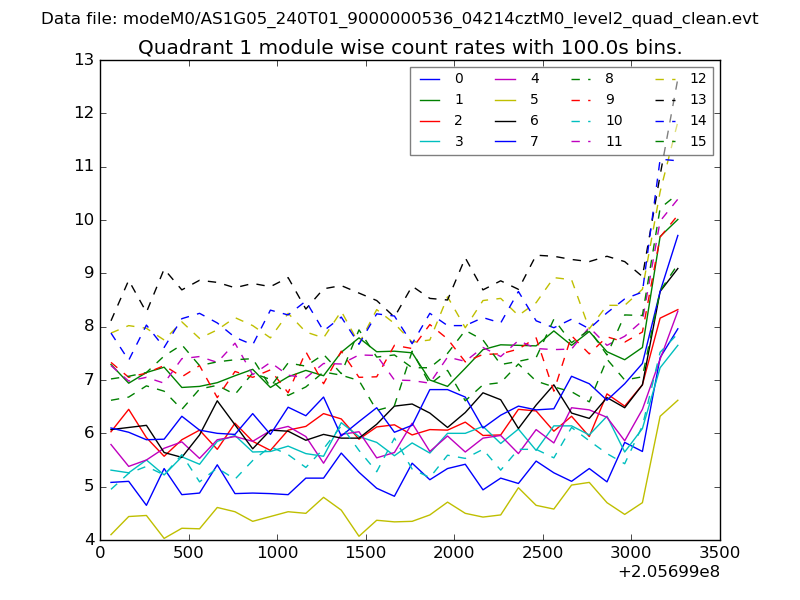
| Module-wise count rates for Quadrant A Data is divided into 100 sec bins |
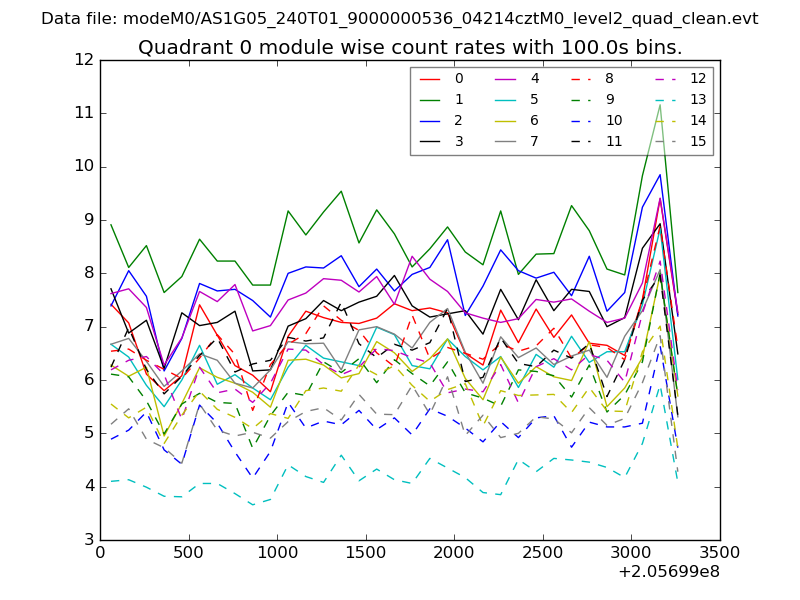 |
 |
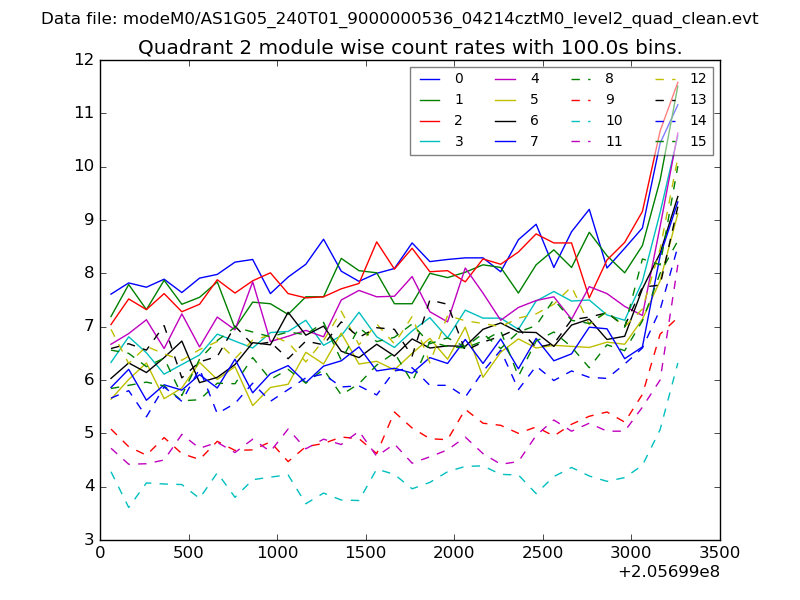
| Module-wise count rates for Quadrant B Data is divided into 100 sec bins |
 |
 |
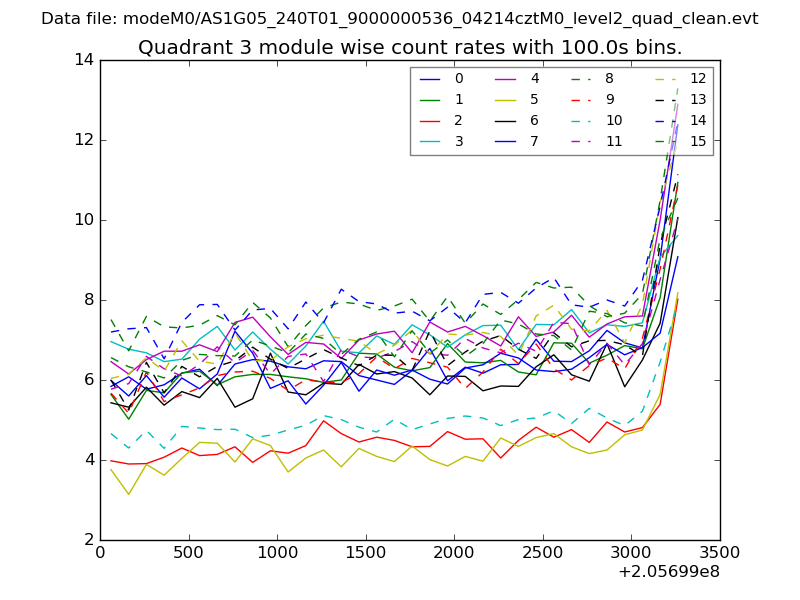
| Module-wise count rates for Quadrant C Data is divided into 100 sec bins |
 |
 |
| Module-wise count rates for Quadrant D Data is divided into 100 sec bins |
 |
 |
| Parameter | Plot |
|---|---|
| CZT HV Monitor | 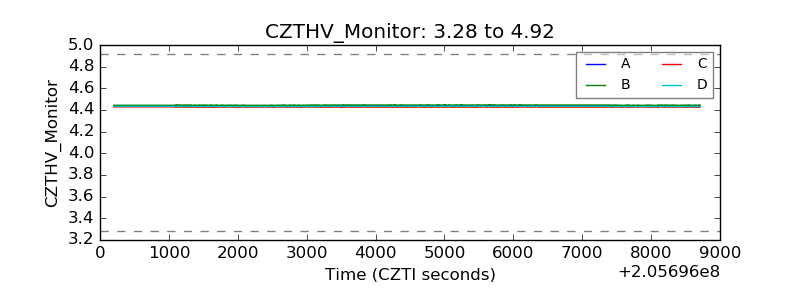 |
| D_VDD | 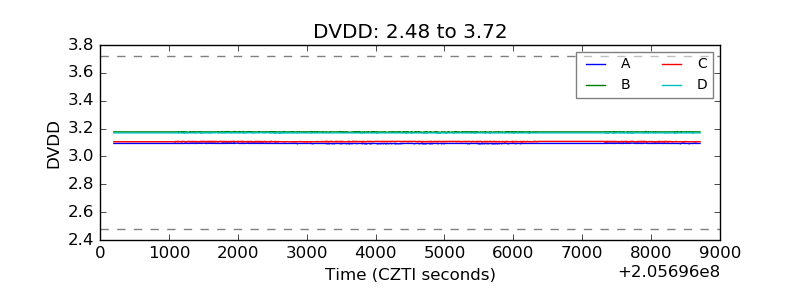 |
| Temperature 1 | 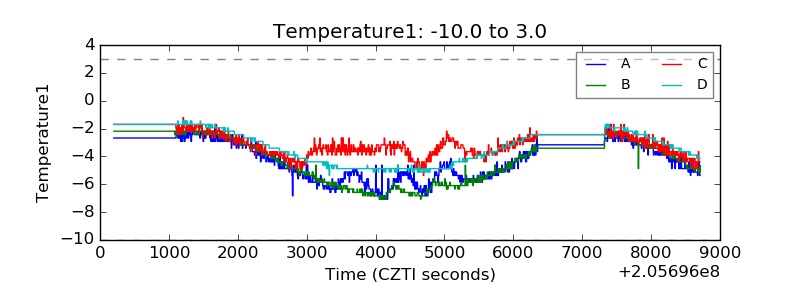 |
| Veto HV Monitor |  |
| Veto LLD | 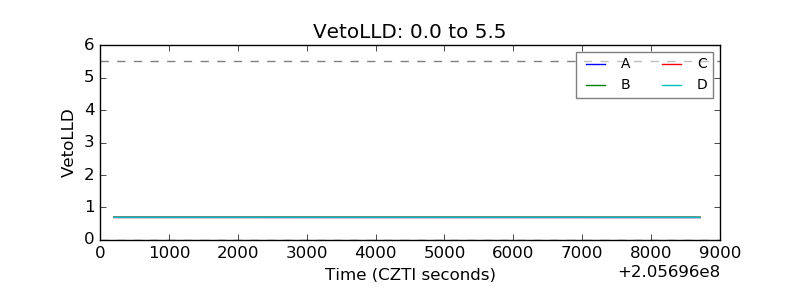 |
| Alpha Counter | 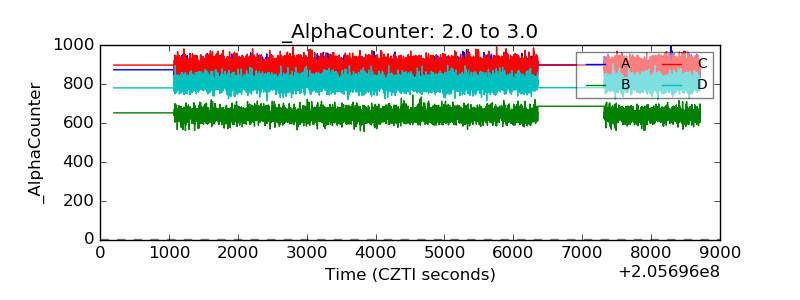 |
| _CPM_Rate | 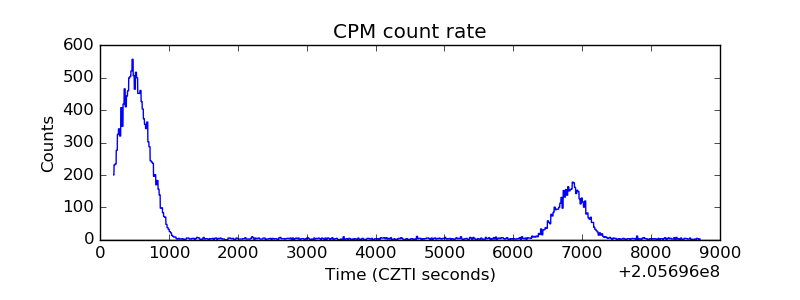 |
| CZT Counter | 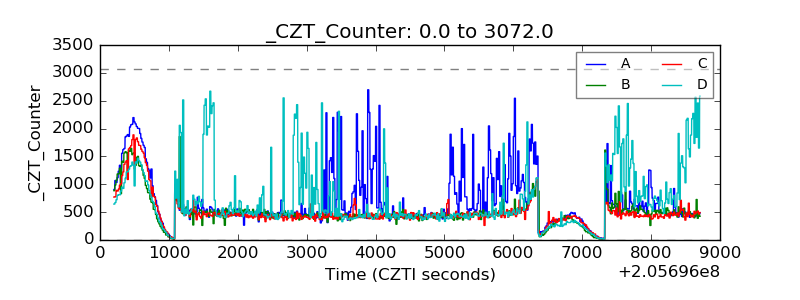 |
| +2.5 Volts monitor | 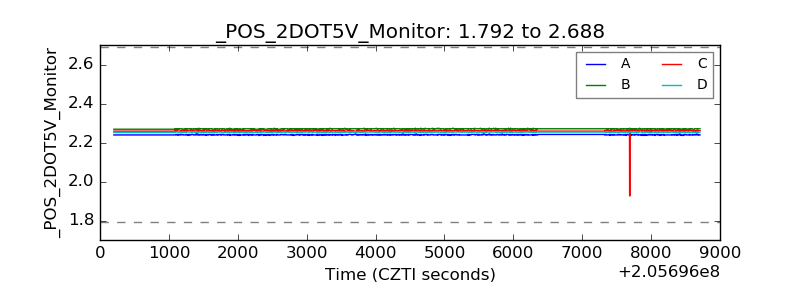 |
| +5 Volts monitor | 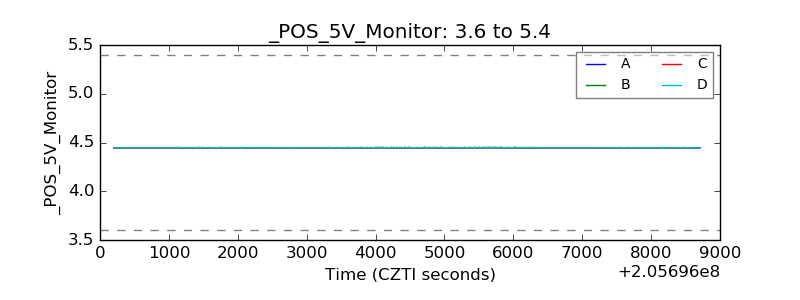 |
| _ROLL_ROT | 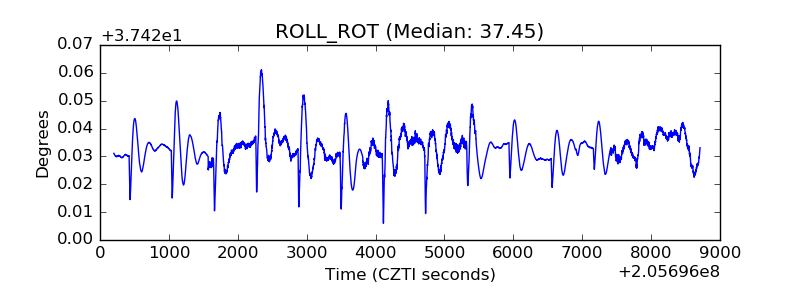 |
| _Roll_DEC | 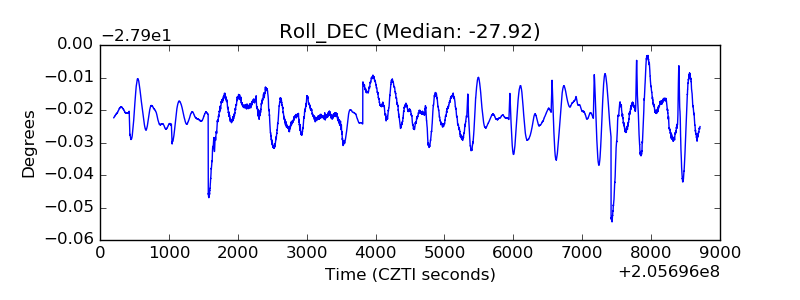 |
| _Roll_RA | 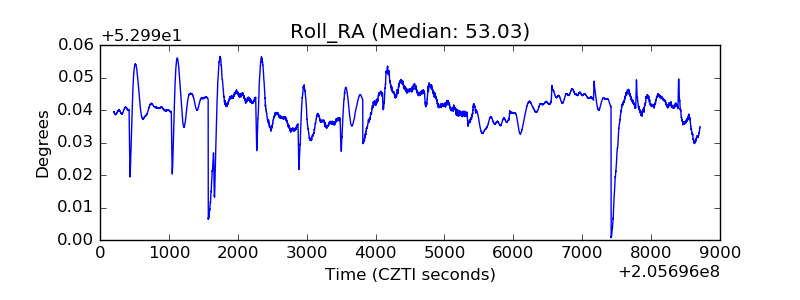 |
| Veto Counter | 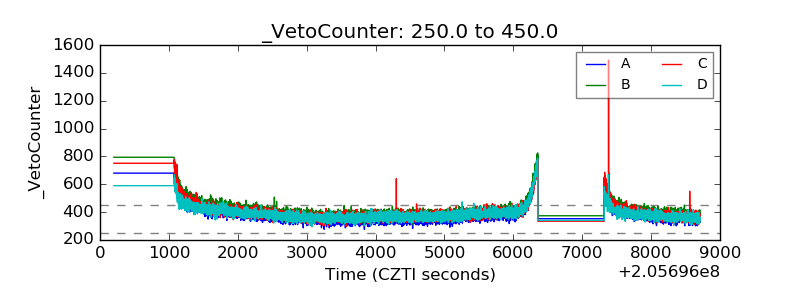 |