| Param | Original file | Final file |
|---|---|---|
| Filename | modeM0/AS1G05_240T01_9000000536_04215cztM0_level2.evt | modeM0/AS1G05_240T01_9000000536_04215cztM0_level2_quad_clean.evt |
| Size (bytes) | 649,252,800 | 66,911,040 |
| Size | 619.2 MB | 63.8 MB |
| Events in quadrant A | 5,950,637 | 363,011 |
| Events in quadrant B | 3,579,563 | 399,911 |
| Events in quadrant C | 3,317,346 | 390,622 |
| Events in quadrant D | 6,331,652 | 374,836 |
| Mode SS | |||
|---|---|---|---|
| Quadrant | BADHDUFLAG | Total packets | Discarded packets |
| A | 0 | 148 | 0 |
| B | 0 | 148 | 0 |
| C | 0 | 148 | 0 |
| D | 0 | 148 | 0 |
| Mode M9 | |||
|---|---|---|---|
| Quadrant | BADHDUFLAG | Total packets | Discarded packets |
| A | 0 | 16 | 0 |
| B | 0 | 16 | 0 |
| C | 0 | 16 | 0 |
| D | 0 | 16 | 0 |
| Mode M0 | |||
|---|---|---|---|
| Quadrant | BADHDUFLAG | Total packets | Discarded packets |
| A | 0 | 22579 | 3 |
| B | 0 | 15241 | 2 |
| C | 0 | 14822 | 2 |
| D | 0 | 23978 | 8 |
| Quadrant | Total seconds | Saturated seconds | Saturation percentage |
|---|---|---|---|
| A | 7142 | 792 | 11.089331% |
| B | 7142 | 165 | 2.310277% |
| C | 7142 | 101 | 1.414170% |
| D | 7141 | 839 | 11.749055% |
Noise dominated data is calculated using 1-second bins in cleaned event files. If a bin has >2000 counts, and if more than 50% of those come from <1% of pixels, then it is considered to be noise-dominated and hence unusable.
| Quadrant | # 1 sec bins | Bins with >0 counts | Bins with >2000 counts | High rate bins dominated by noise | Noise dominated (total time) | Noise dominated (detector-on time) | Marked lightcurve |
|---|---|---|---|---|---|---|---|
| A | 8627 | 7144 | 508 | 508 | 5.89% | 7.11% | 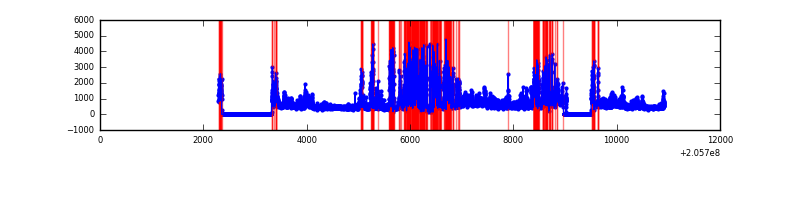 |
| B | 8627 | 7145 | 3 | 3 | 0.03% | 0.04% | 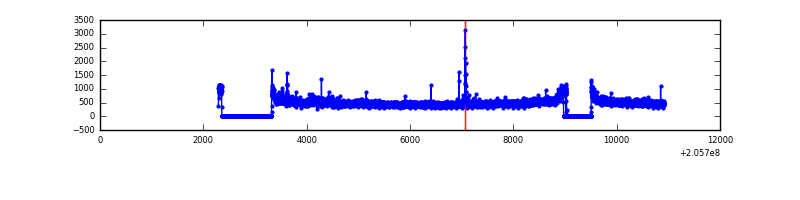 |
| C | 8627 | 7145 | 0 | 0 | 0.00% | 0.00% | 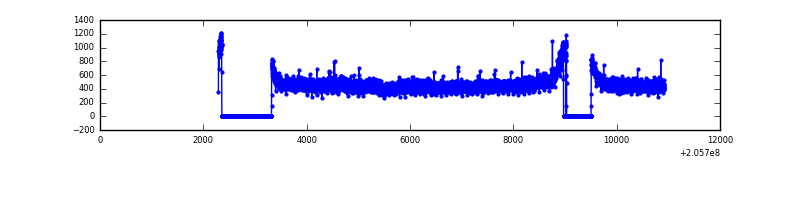 |
| D | 8627 | 7145 | 583 | 583 | 6.76% | 8.16% | 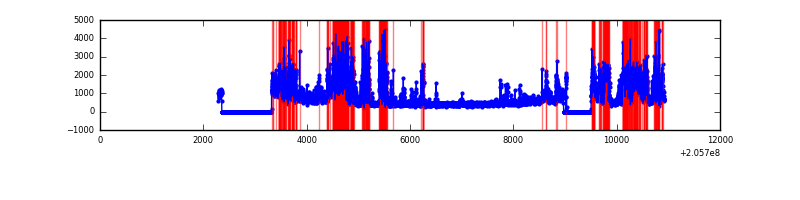 |
Top three noisy pixels from each quadrant. If the there are fewer than three noisy pixels in the level2.evt file, extra rows are filled as -1
| Pixel properties | Quadrant properties | ||||||
|---|---|---|---|---|---|---|---|
| Quadrant | DetID | PixID | Counts | Sigma | Mean | Median | Sigma |
| A | 12 | 247 | 1613088 | 9652.88 | 809 | 790 | 167.0 |
| A | 15 | 234 | 553676 | 3310.15 | 809 | 790 | 167.0 |
| A | 0 | 50 | 474909 | 2838.56 | 809 | 790 | 167.0 |
| B | 15 | 204 | 147597 | 878.06 | 857 | 837 | 167.1 |
| B | 14 | 167 | 56777 | 334.69 | 857 | 837 | 167.1 |
| B | 0 | 183 | 25143 | 145.42 | 857 | 837 | 167.1 |
| C | 9 | 144 | 96939 | 496.37 | 821 | 824 | 193.6 |
| C | 10 | 65 | 10957 | 52.33 | 821 | 824 | 193.6 |
| C | 13 | 61 | 6676 | 30.22 | 821 | 824 | 193.6 |
| D | 2 | 232 | 2151600 | 11102.14 | 794 | 771 | 193.7 |
| D | 11 | 132 | 507125 | 2613.7 | 794 | 771 | 193.7 |
| D | 9 | 85 | 284874 | 1466.48 | 794 | 771 | 193.7 |
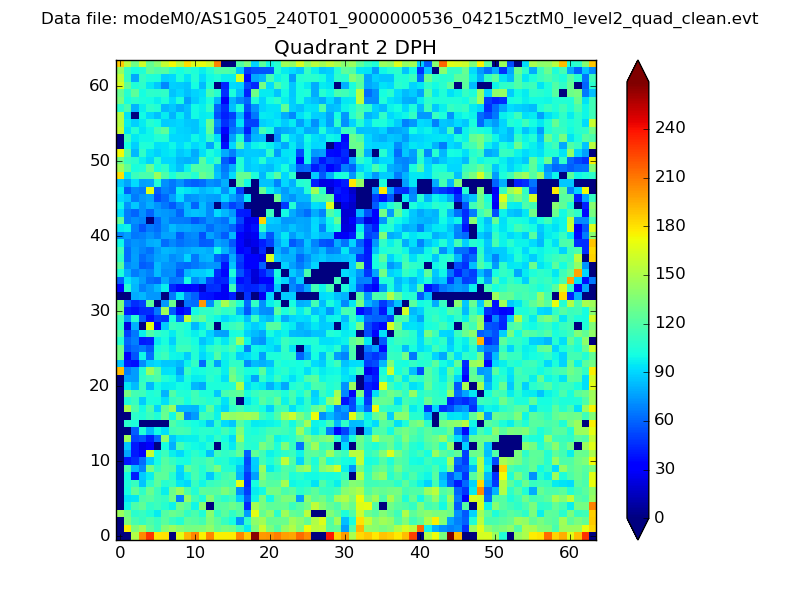
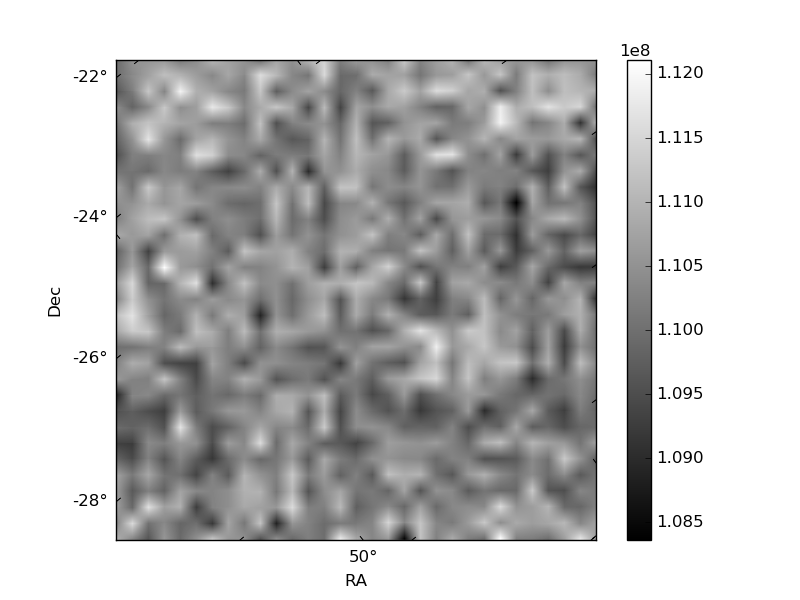
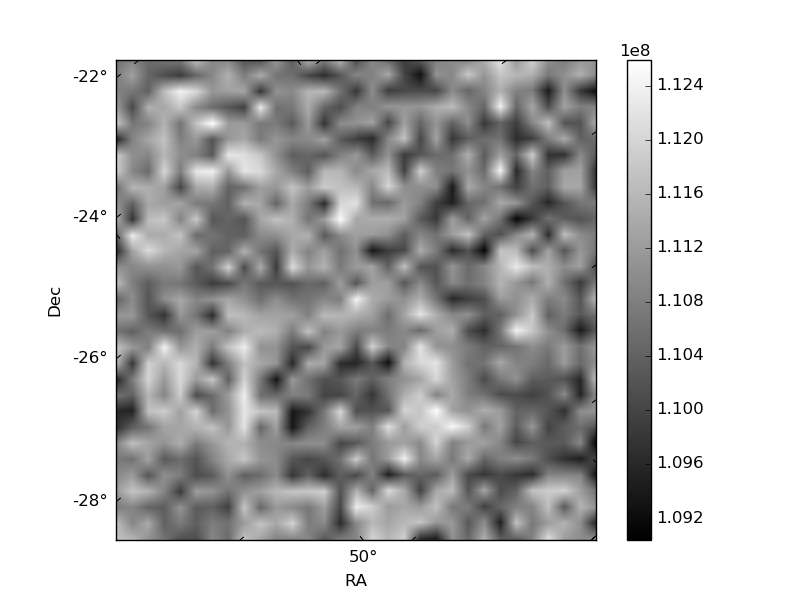
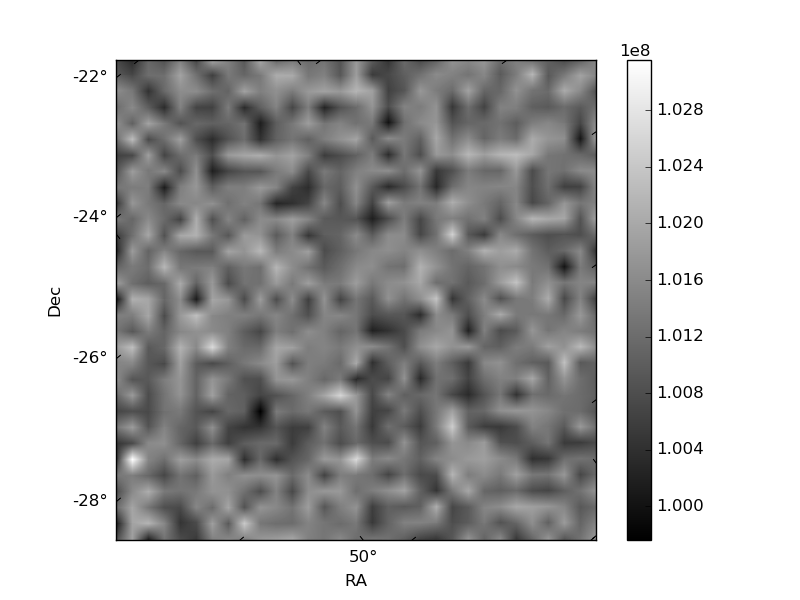
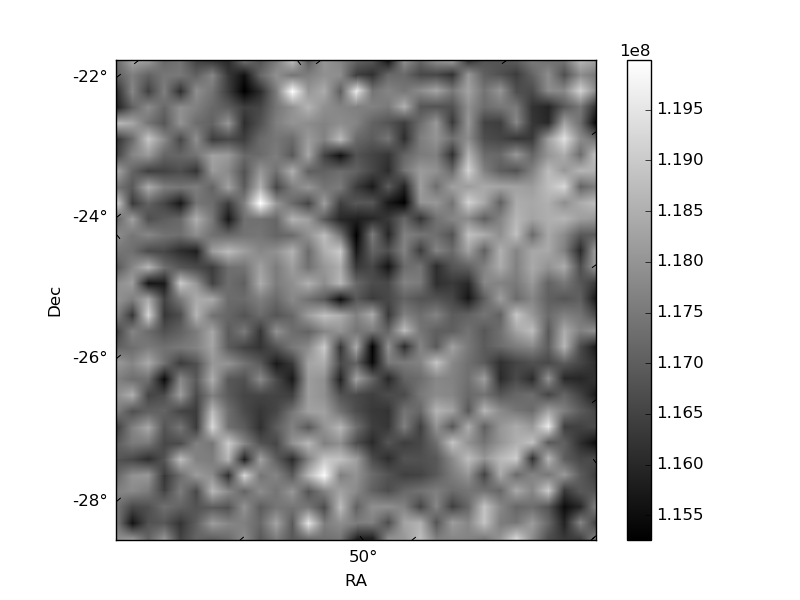
Histogram calculated using DETX and DETY for each event in the final _common_clean file
| Quadrant A | 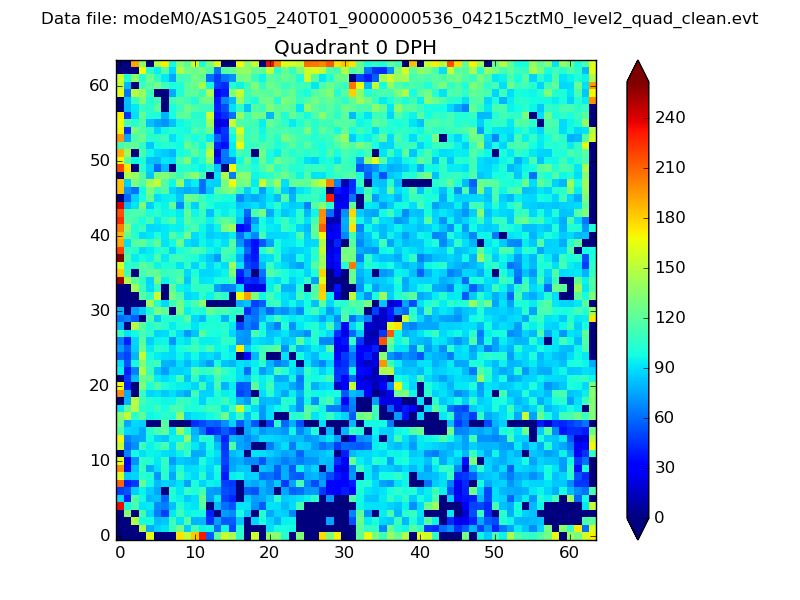 |
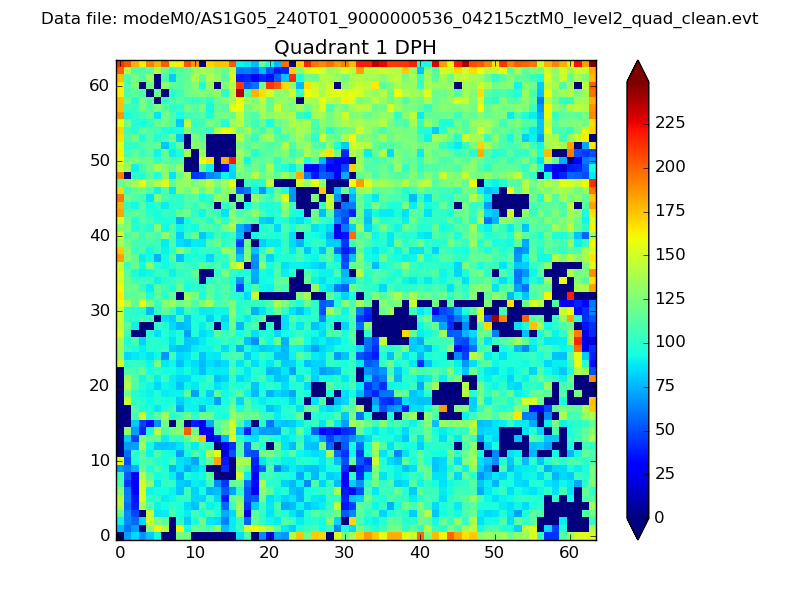 |
Quadrant B |
|---|---|---|---|
| Quadrant D | 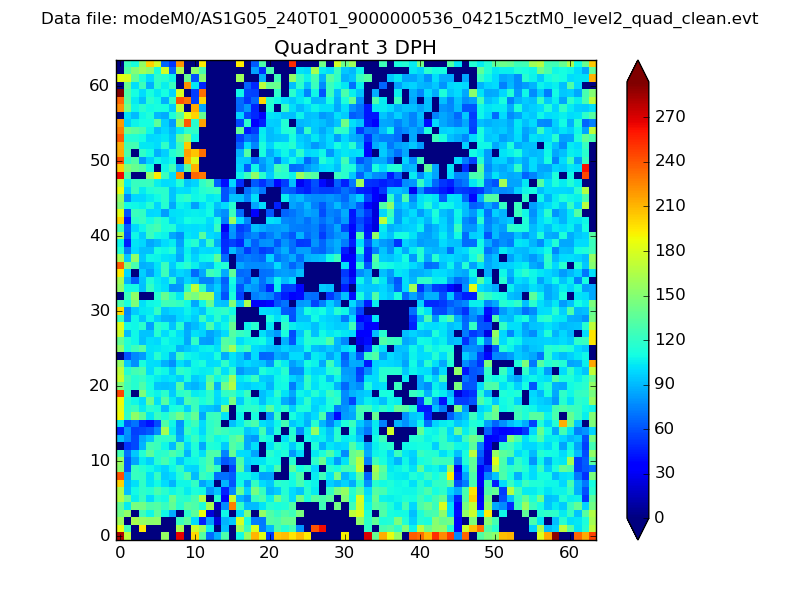 |
 |
Quadrant C |
| Plot type | Count rate plots | Images |
|---|---|---|
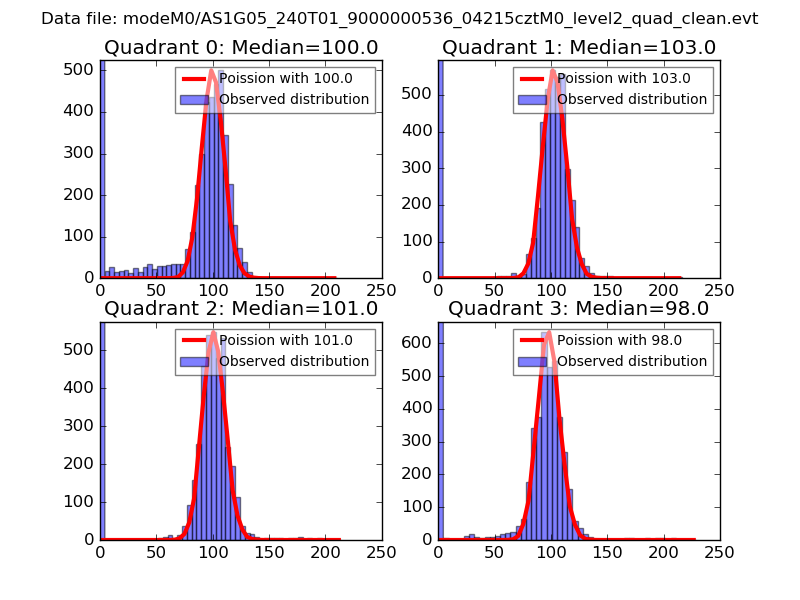
| Comparison with Poisson distribution Blue bars denote a histogram of data divided into 1 sec bins. Red curve is a Poisson curve with rate = median count rate of data. |
 |
 |
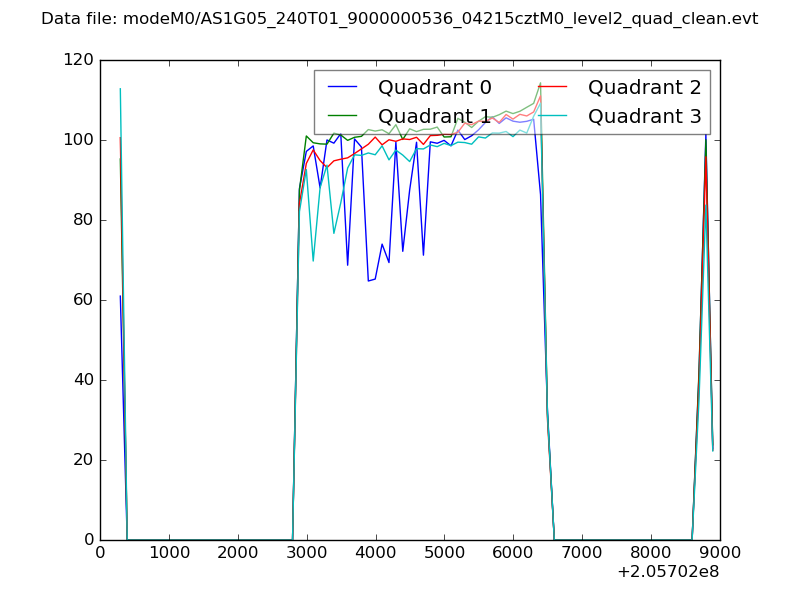
| Quadrant-wise count rates Data is divided into 100 sec bins |
 |
|
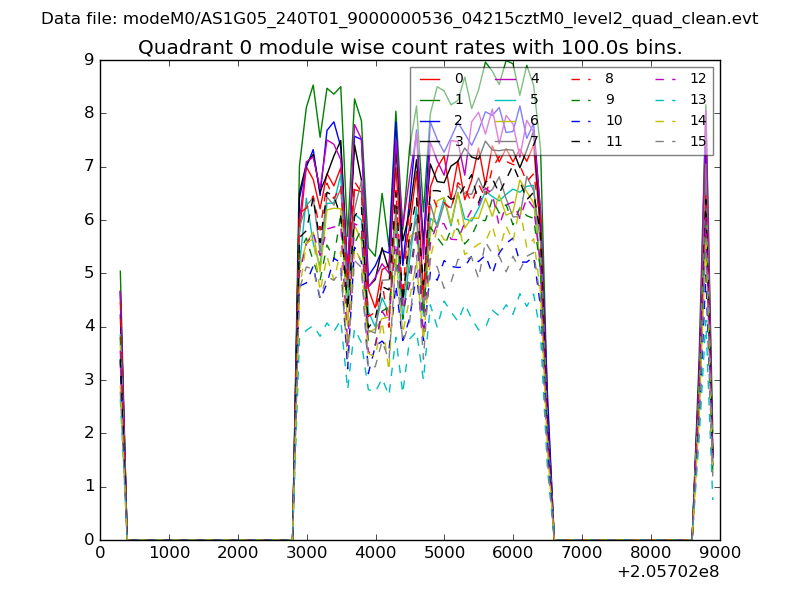
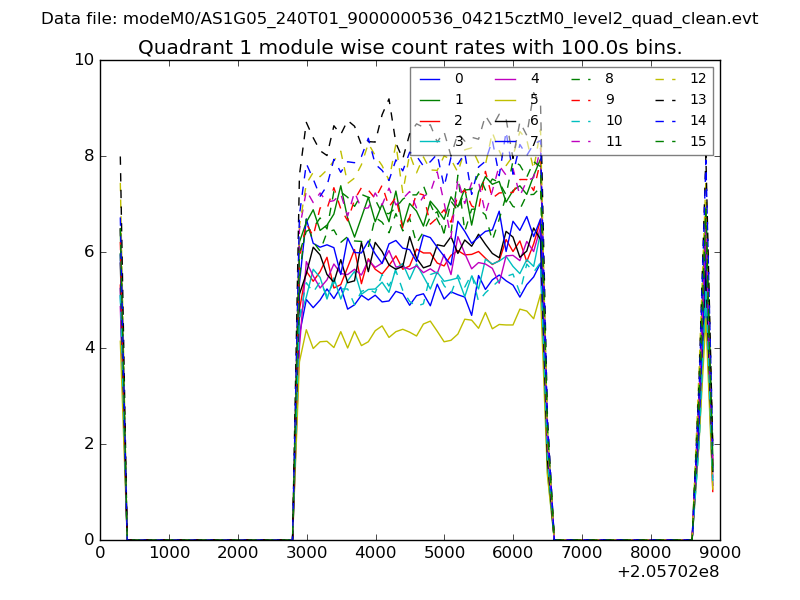
| Module-wise count rates for Quadrant A Data is divided into 100 sec bins |
 |
 |
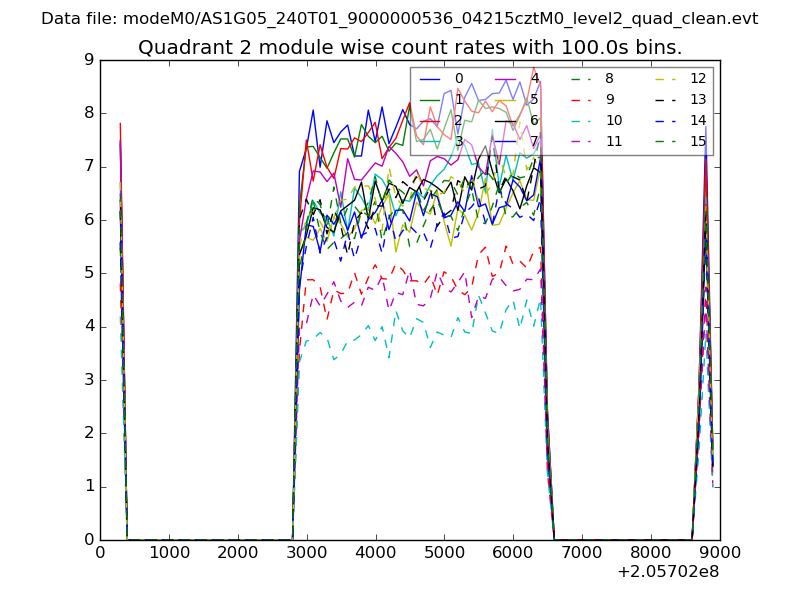
| Module-wise count rates for Quadrant B Data is divided into 100 sec bins |
 |
 |
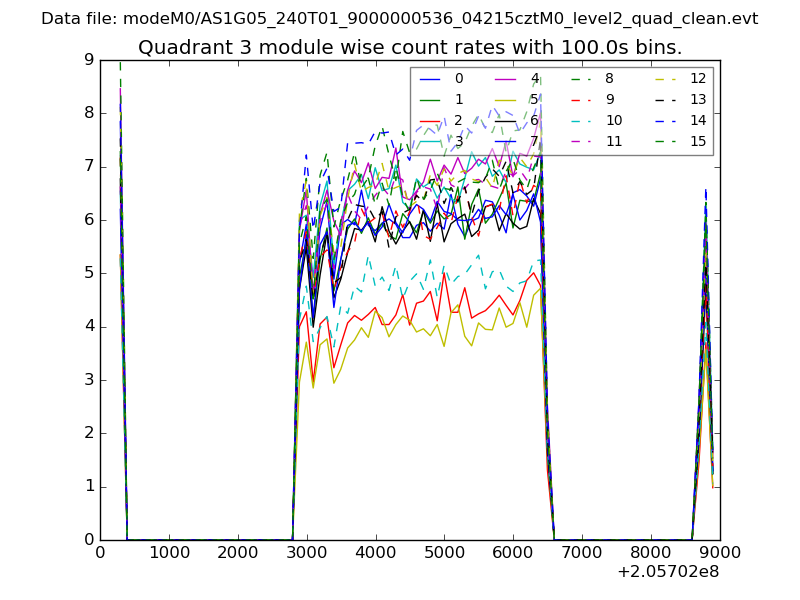
| Module-wise count rates for Quadrant C Data is divided into 100 sec bins |
 |
 |
| Module-wise count rates for Quadrant D Data is divided into 100 sec bins |
 |
 |
| Parameter | Plot |
|---|---|
| CZT HV Monitor | 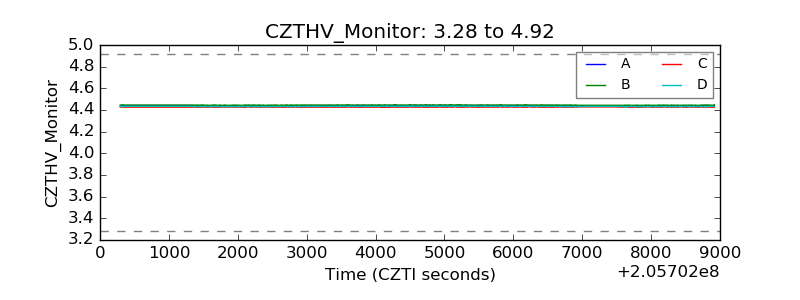 |
| D_VDD | 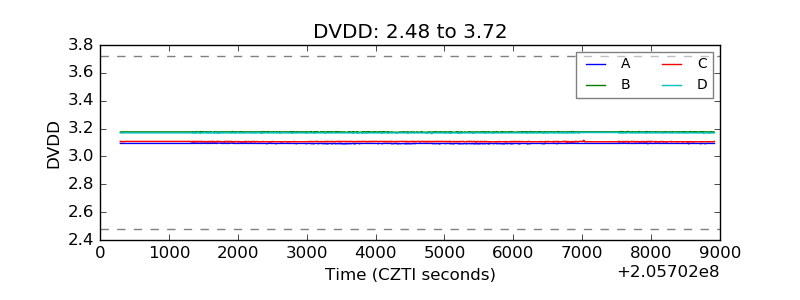 |
| Temperature 1 | 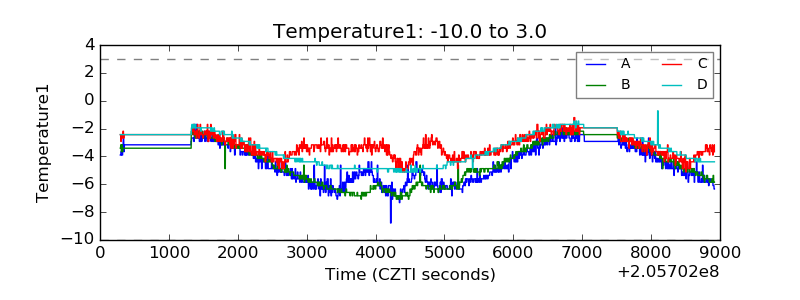 |
| Veto HV Monitor |  |
| Veto LLD | 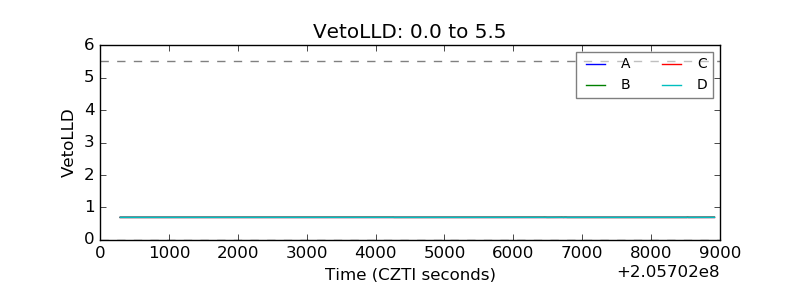 |
| Alpha Counter | 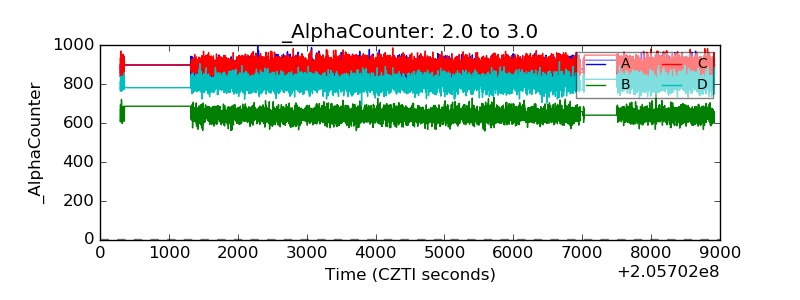 |
| _CPM_Rate | 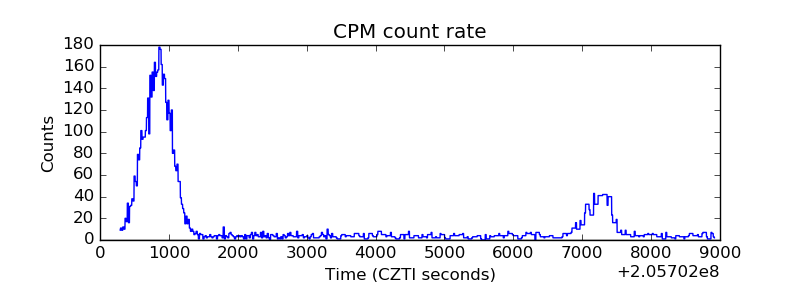 |
| CZT Counter | 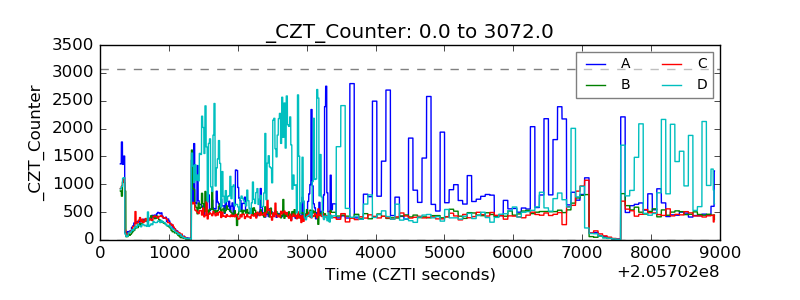 |
| +2.5 Volts monitor |  |
| +5 Volts monitor |  |
| _ROLL_ROT | 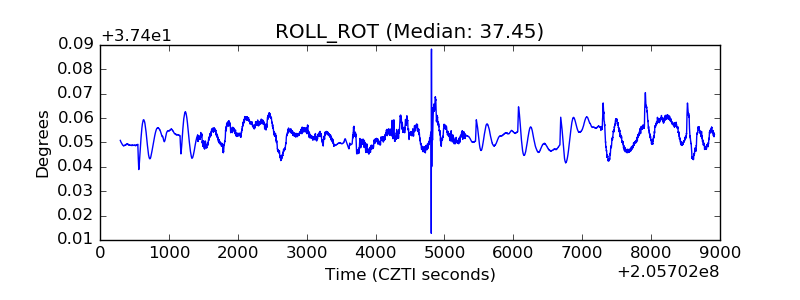 |
| _Roll_DEC | 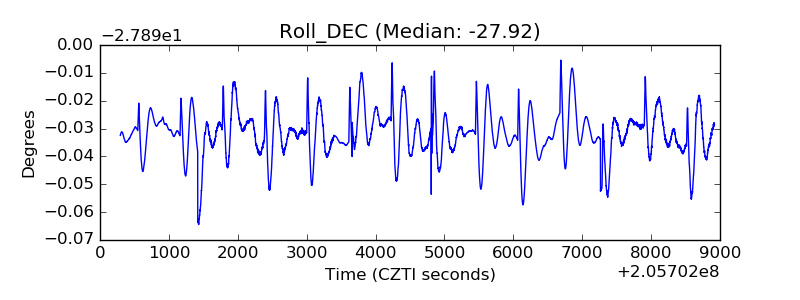 |
| _Roll_RA | 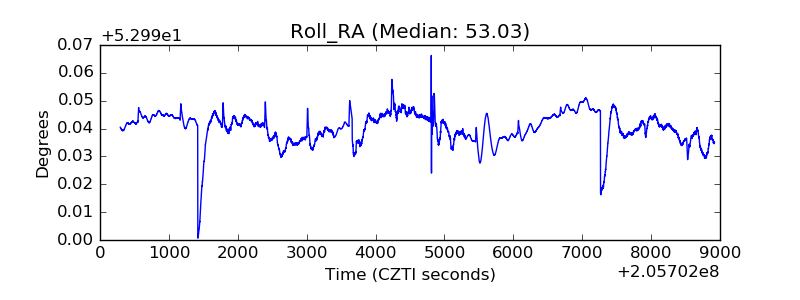 |
| Veto Counter | 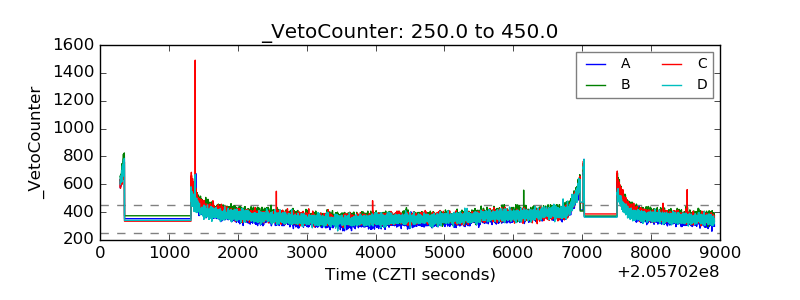 |