| Param | Original file | Final file |
|---|---|---|
| Filename | modeM0/AS1G05_240T01_9000000536_04217cztM0_level2.evt | modeM0/AS1G05_240T01_9000000536_04217cztM0_level2_quad_clean.evt |
| Size (bytes) | 659,050,560 | 79,427,520 |
| Size | 628.5 MB | 75.7 MB |
| Events in quadrant A | 4,444,606 | 472,773 |
| Events in quadrant B | 3,936,540 | 475,912 |
| Events in quadrant C | 3,640,775 | 466,550 |
| Events in quadrant D | 7,391,121 | 428,883 |
| Mode SS | |||
|---|---|---|---|
| Quadrant | BADHDUFLAG | Total packets | Discarded packets |
| A | 0 | 168 | 0 |
| B | 0 | 168 | 0 |
| C | 0 | 168 | 0 |
| D | 0 | 168 | 0 |
| Mode M9 | |||
|---|---|---|---|
| Quadrant | BADHDUFLAG | Total packets | Discarded packets |
| A | 0 | 4 | 0 |
| B | 0 | 4 | 0 |
| C | 0 | 4 | 0 |
| D | 0 | 4 | 0 |
| Mode M0 | |||
|---|---|---|---|
| Quadrant | BADHDUFLAG | Total packets | Discarded packets |
| A | 0 | 18853 | 3 |
| B | 0 | 17138 | 2 |
| C | 0 | 16588 | 2 |
| D | 0 | 27620 | 2 |
| Quadrant | Total seconds | Saturated seconds | Saturation percentage |
|---|---|---|---|
| A | 8063 | 238 | 2.951755% |
| B | 8063 | 99 | 1.227831% |
| C | 8063 | 72 | 0.892968% |
| D | 8063 | 863 | 10.703212% |
Noise dominated data is calculated using 1-second bins in cleaned event files. If a bin has >2000 counts, and if more than 50% of those come from <1% of pixels, then it is considered to be noise-dominated and hence unusable.
| Quadrant | # 1 sec bins | Bins with >0 counts | Bins with >2000 counts | High rate bins dominated by noise | Noise dominated (total time) | Noise dominated (detector-on time) | Marked lightcurve |
|---|---|---|---|---|---|---|---|
| A | 8508 | 8067 | 116 | 116 | 1.36% | 1.44% | 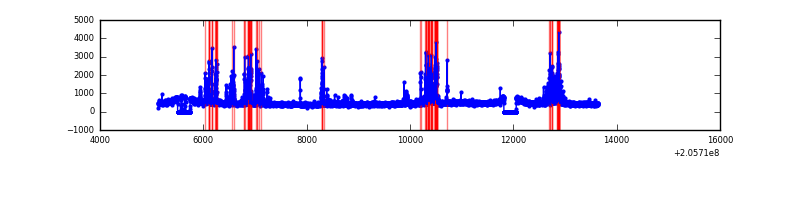 |
| B | 8508 | 8067 | 1 | 1 | 0.01% | 0.01% | 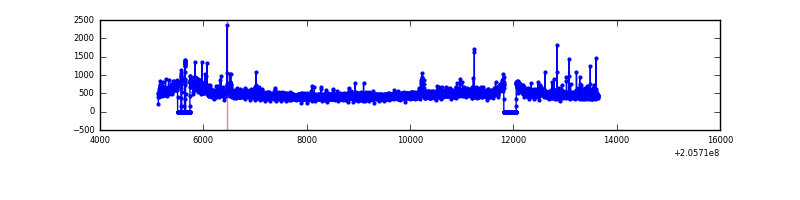 |
| C | 8508 | 8067 | 0 | 0 | 0.00% | 0.00% |  |
| D | 8508 | 8067 | 618 | 618 | 7.26% | 7.66% |  |
Top three noisy pixels from each quadrant. If the there are fewer than three noisy pixels in the level2.evt file, extra rows are filled as -1
| Pixel properties | Quadrant properties | ||||||
|---|---|---|---|---|---|---|---|
| Quadrant | DetID | PixID | Counts | Sigma | Mean | Median | Sigma |
| A | 0 | 50 | 809430 | 4143.36 | 939 | 917 | 195.1 |
| A | 12 | 247 | 9973 | 46.41 | 939 | 917 | 195.1 |
| A | 0 | 226 | 9609 | 44.54 | 939 | 917 | 195.1 |
| B | 15 | 204 | 104552 | 556.66 | 956 | 931 | 186.1 |
| B | 3 | 0 | 83712 | 444.7 | 956 | 931 | 186.1 |
| B | 14 | 167 | 32551 | 169.86 | 956 | 931 | 186.1 |
| C | 8 | 128 | 20136 | 89.61 | 918 | 920 | 214.4 |
| C | 9 | 144 | 15637 | 68.63 | 918 | 920 | 214.4 |
| C | 8 | 112 | 8640 | 36.0 | 918 | 920 | 214.4 |
| D | 2 | 232 | 1947940 | 9016.5 | 875 | 847 | 215.9 |
| D | 11 | 132 | 1110667 | 5139.3 | 875 | 847 | 215.9 |
| D | 8 | 112 | 342261 | 1581.0 | 875 | 847 | 215.9 |
Histogram calculated using DETX and DETY for each event in the final _common_clean file
| Quadrant A | 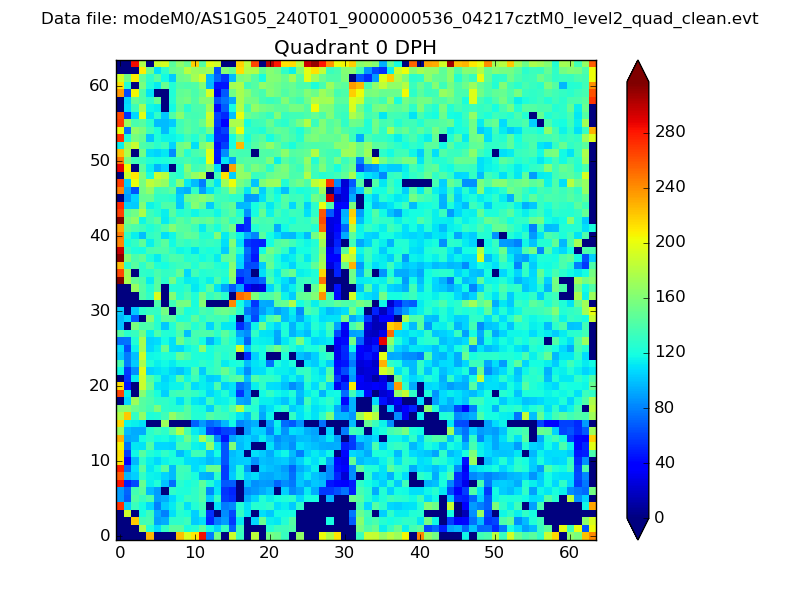 |
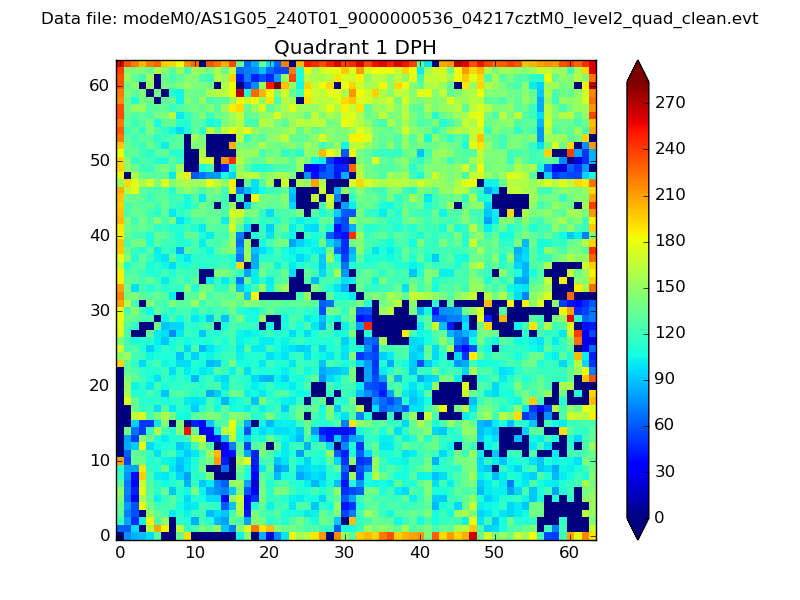 |
Quadrant B |
|---|---|---|---|
| Quadrant D | 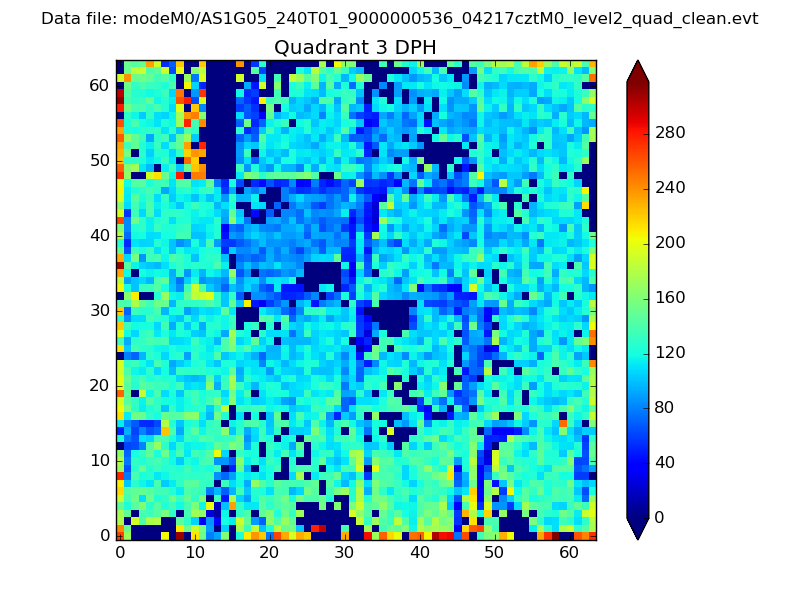 |
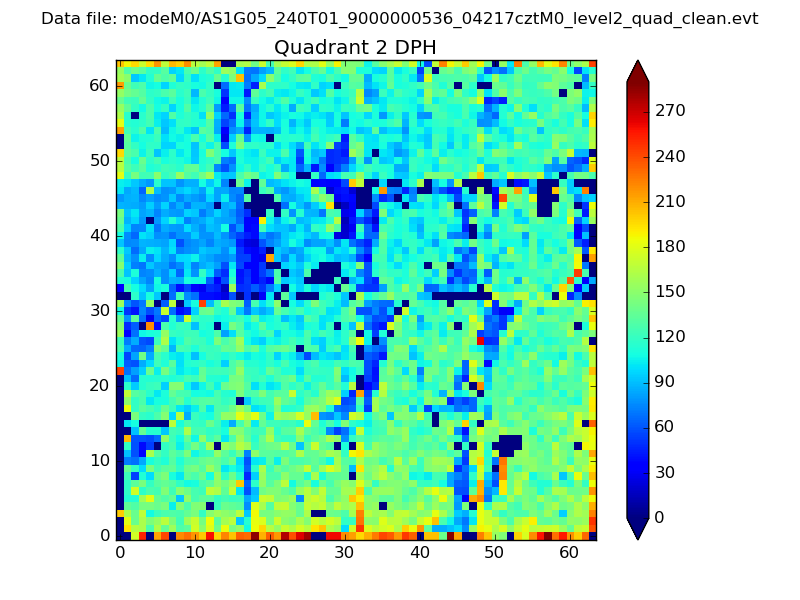 |
Quadrant C |
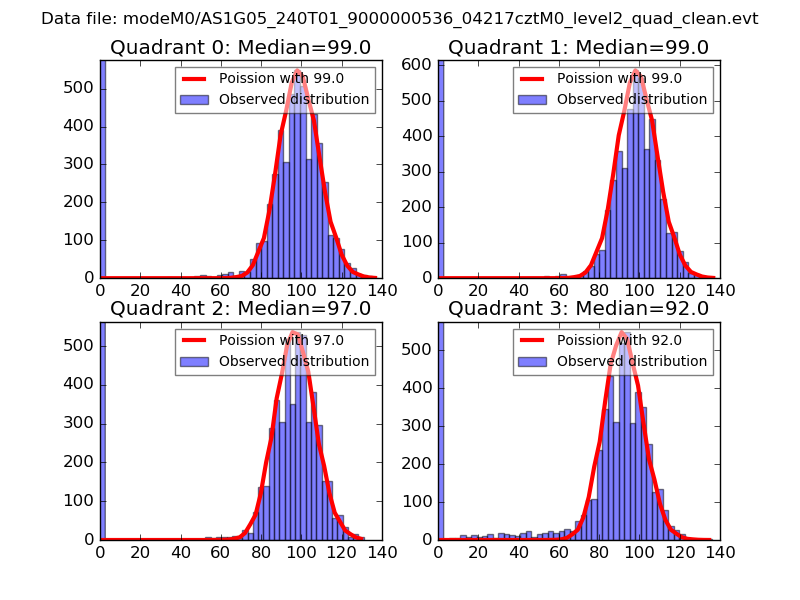
| Plot type | Count rate plots | Images |
|---|---|---|
| Comparison with Poisson distribution Blue bars denote a histogram of data divided into 1 sec bins. Red curve is a Poisson curve with rate = median count rate of data. |
 |
 |
| Quadrant-wise count rates Data is divided into 100 sec bins |
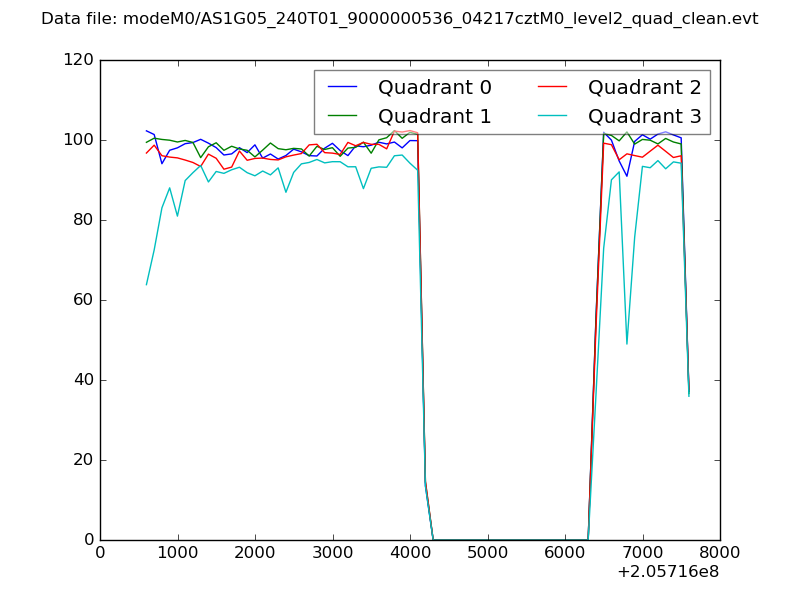 |
|
| Module-wise count rates for Quadrant A Data is divided into 100 sec bins |
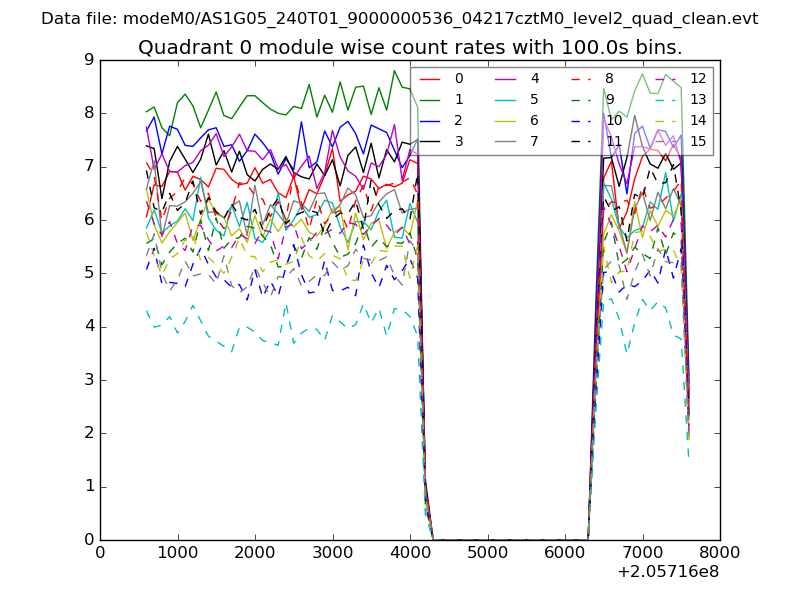 |
 |
| Module-wise count rates for Quadrant B Data is divided into 100 sec bins |
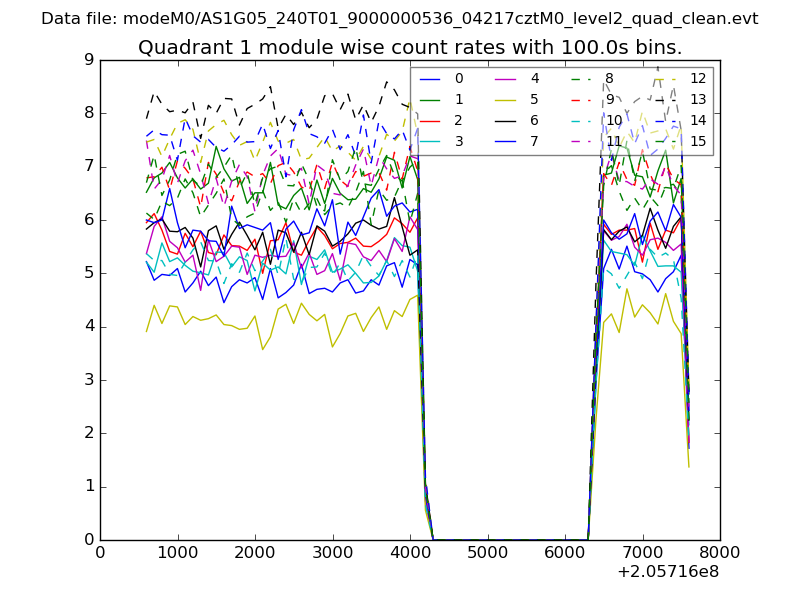 |
 |
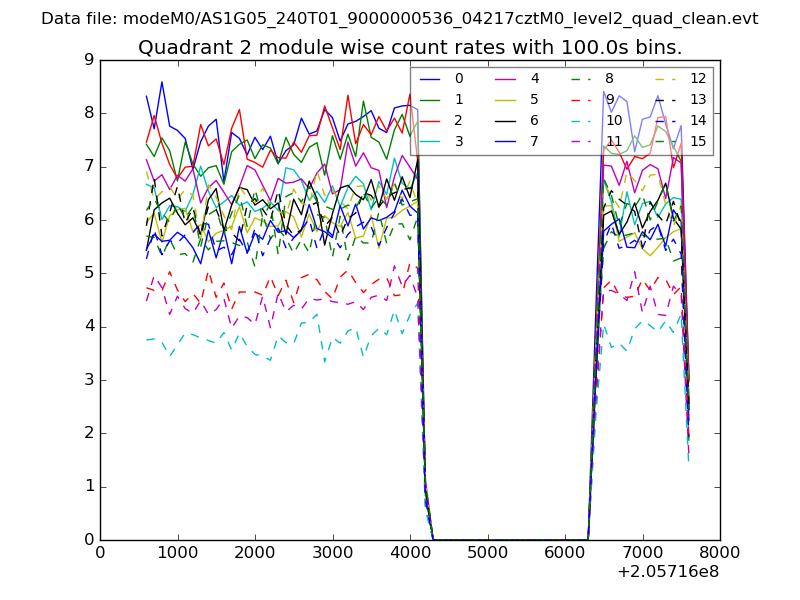
| Module-wise count rates for Quadrant C Data is divided into 100 sec bins |
 |
 |
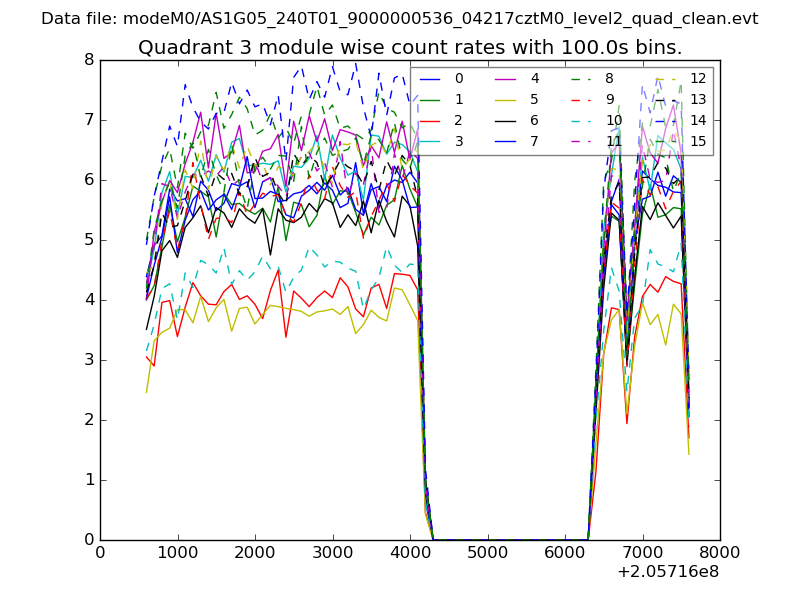
| Module-wise count rates for Quadrant D Data is divided into 100 sec bins |
 |
 |
| Parameter | Plot |
|---|---|
| CZT HV Monitor | 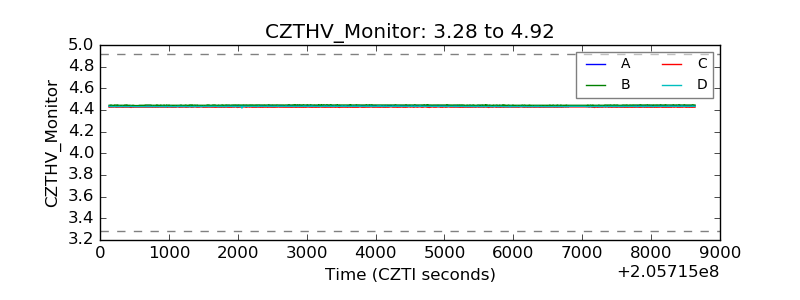 |
| D_VDD | 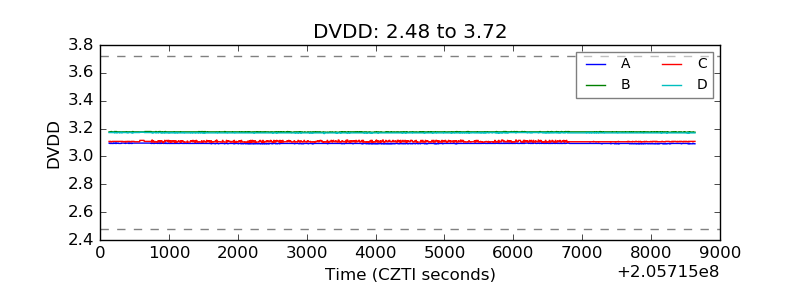 |
| Temperature 1 | 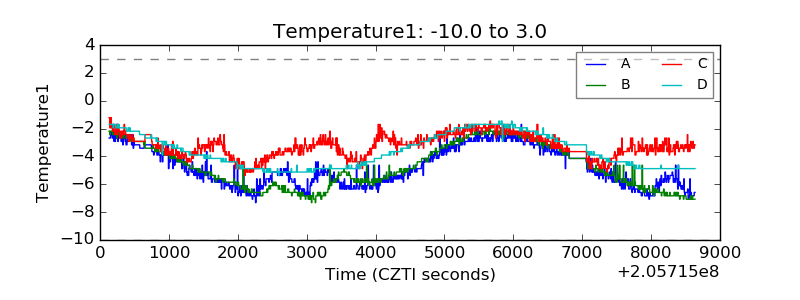 |
| Veto HV Monitor | 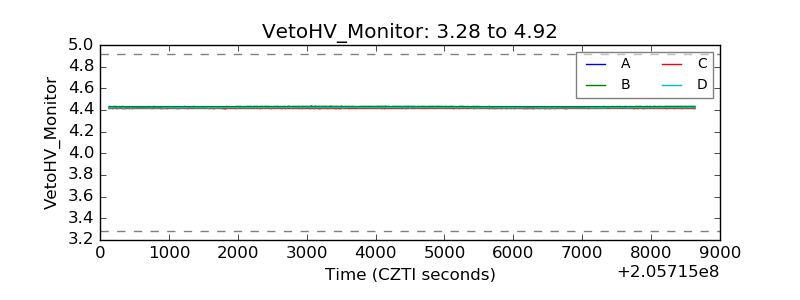 |
| Veto LLD | 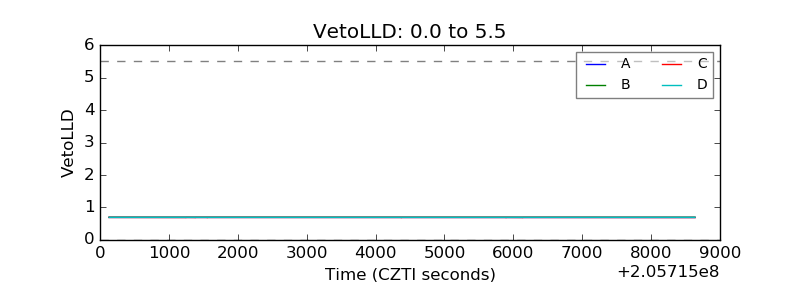 |
| Alpha Counter | 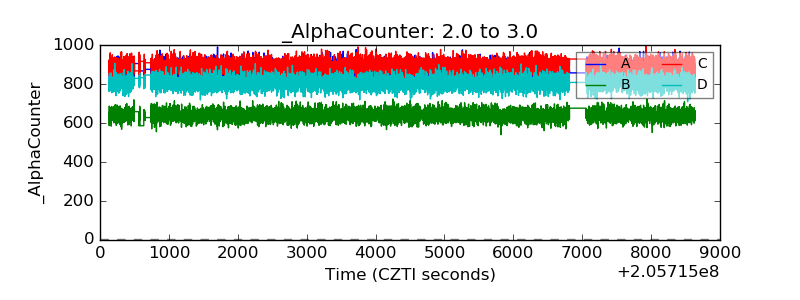 |
| _CPM_Rate | 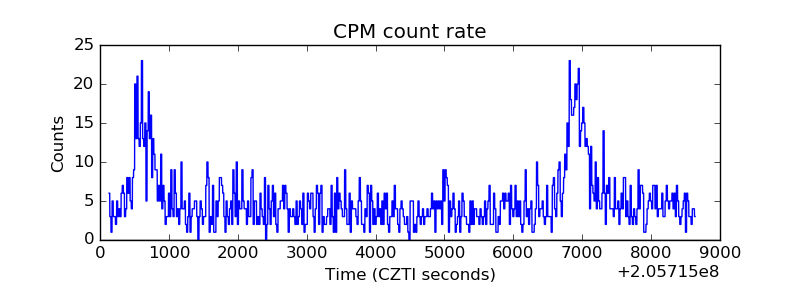 |
| CZT Counter | 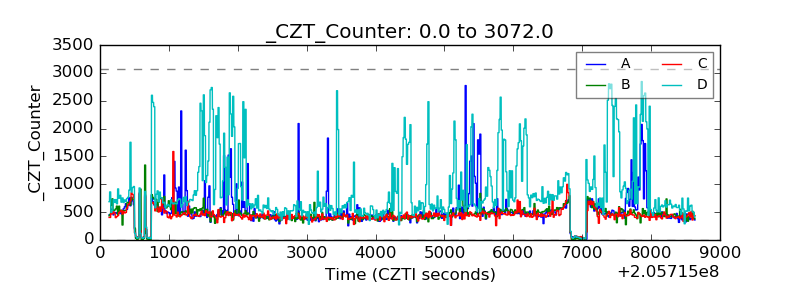 |
| +2.5 Volts monitor |  |
| +5 Volts monitor |  |
| _ROLL_ROT | 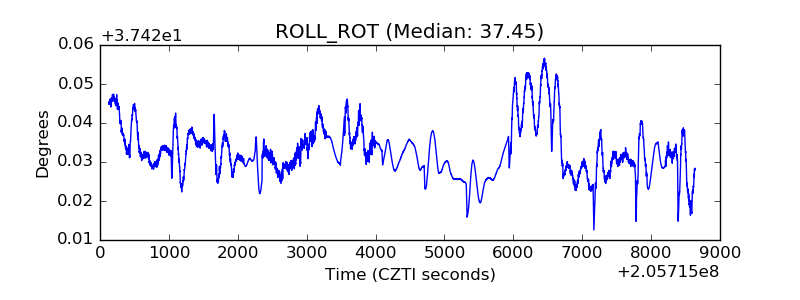 |
| _Roll_DEC | 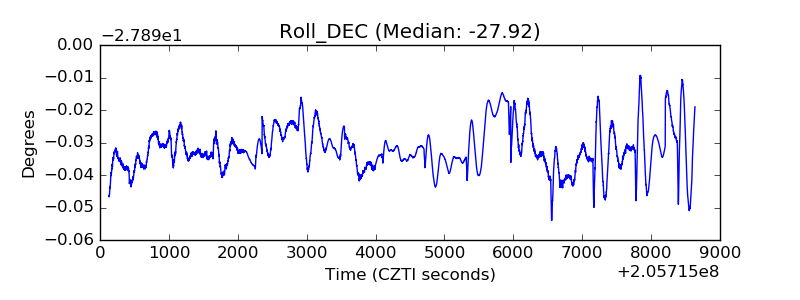 |
| _Roll_RA | 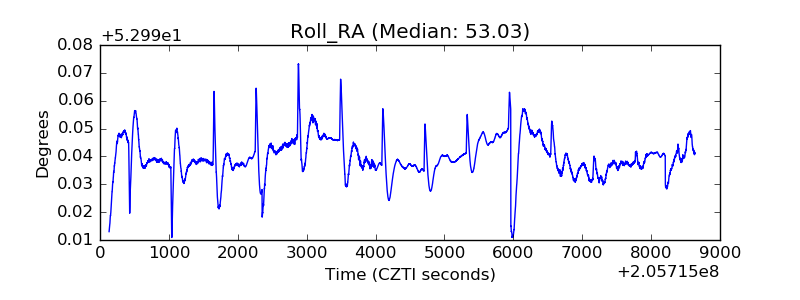 |
| Veto Counter | 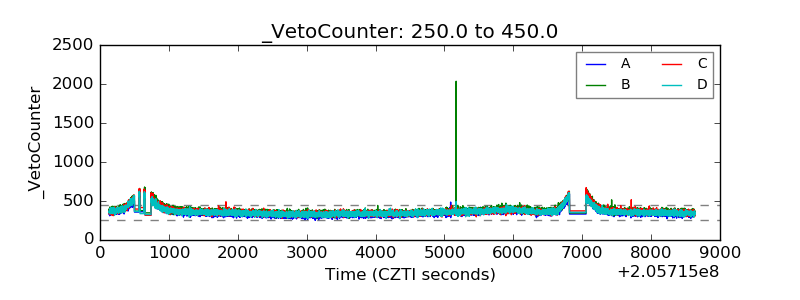 |