| Param | Original file | Final file |
|---|---|---|
| Filename | modeM0/AS1G05_240T01_9000000536_04220cztM0_level2.evt | modeM0/AS1G05_240T01_9000000536_04220cztM0_level2_quad_clean.evt |
| Size (bytes) | 1,379,992,320 | 165,349,440 |
| Size | 1.3 GB | 157.7 MB |
| Events in quadrant A | 9,071,711 | 1,000,309 |
| Events in quadrant B | 8,979,238 | 1,005,231 |
| Events in quadrant C | 10,129,076 | 972,716 |
| Events in quadrant D | 12,505,102 | 898,814 |
| Mode SS | |||
|---|---|---|---|
| Quadrant | BADHDUFLAG | Total packets | Discarded packets |
| A | 0 | 400 | 58 |
| B | 0 | 399 | 57 |
| C | 0 | 400 | 62 |
| D | 0 | 398 | 44 |
| Mode M9 | |||
|---|---|---|---|
| Quadrant | BADHDUFLAG | Total packets | Discarded packets |
| A | 0 | 19 | 0 |
| B | 0 | 19 | 2 |
| C | 0 | 19 | 1 |
| D | 0 | 19 | 1 |
| Mode M0 | |||
|---|---|---|---|
| Quadrant | BADHDUFLAG | Total packets | Discarded packets |
| A | 0 | 45843 | 7307 |
| B | 0 | 45184 | 7466 |
| C | 0 | 49447 | 7907 |
| D | 0 | 63453 | 15052 |
| Quadrant | Total seconds | Saturated seconds | Saturation percentage |
|---|---|---|---|
| A | 16550 | 437 | 2.640483% |
| B | 16458 | 342 | 2.078017% |
| C | 16555 | 1101 | 6.650559% |
| D | 15719 | 1202 | 7.646797% |
Noise dominated data is calculated using 1-second bins in cleaned event files. If a bin has >2000 counts, and if more than 50% of those come from <1% of pixels, then it is considered to be noise-dominated and hence unusable.
| Quadrant | # 1 sec bins | Bins with >0 counts | Bins with >2000 counts | High rate bins dominated by noise | Noise dominated (total time) | Noise dominated (detector-on time) | Marked lightcurve |
|---|---|---|---|---|---|---|---|
| A | 21462 | 18490 | 198 | 198 | 0.92% | 1.07% | 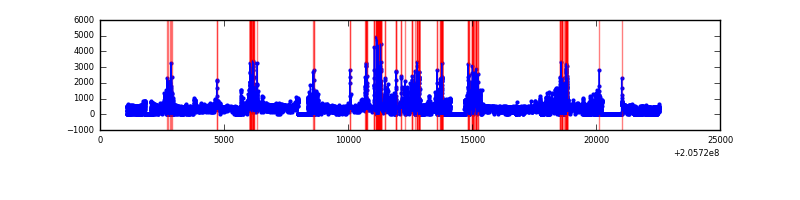 |
| B | 21467 | 18383 | 136 | 136 | 0.63% | 0.74% | 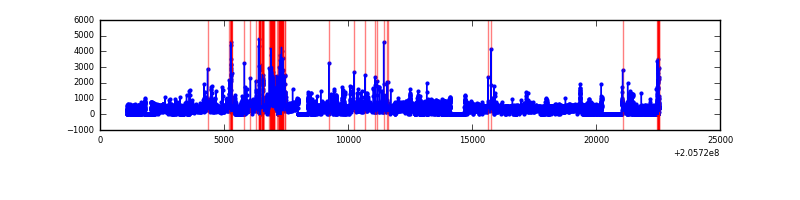 |
| C | 21467 | 18374 | 888 | 888 | 4.14% | 4.83% | 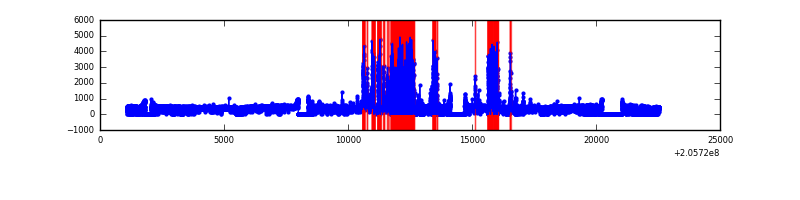 |
| D | 21463 | 17784 | 761 | 761 | 3.55% | 4.28% | 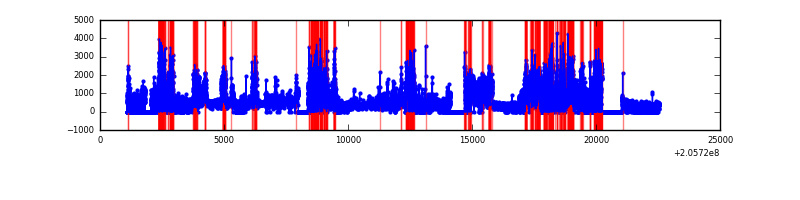 |
Top three noisy pixels from each quadrant. If the there are fewer than three noisy pixels in the level2.evt file, extra rows are filled as -1
| Pixel properties | Quadrant properties | ||||||
|---|---|---|---|---|---|---|---|
| Quadrant | DetID | PixID | Counts | Sigma | Mean | Median | Sigma |
| A | 0 | 50 | 890200 | 2301.02 | 1893 | 1847 | 386.1 |
| A | 12 | 247 | 613313 | 1583.83 | 1893 | 1847 | 386.1 |
| A | 15 | 234 | 131925 | 336.93 | 1893 | 1847 | 386.1 |
| B | 10 | 16 | 560665 | 1516.59 | 1906 | 1859 | 368.5 |
| B | 3 | 0 | 343676 | 927.68 | 1906 | 1859 | 368.5 |
| B | 15 | 204 | 206753 | 556.08 | 1906 | 1859 | 368.5 |
| C | 0 | 239 | 2988601 | 7185.0 | 1786 | 1798 | 415.7 |
| C | 9 | 144 | 128303 | 304.32 | 1786 | 1798 | 415.7 |
| C | 14 | 48 | 19968 | 43.71 | 1786 | 1798 | 415.7 |
| D | 2 | 232 | 2704581 | 6565.5 | 1701 | 1649 | 411.7 |
| D | 8 | 112 | 2266026 | 5500.23 | 1701 | 1649 | 411.7 |
| D | 11 | 132 | 701962 | 1701.08 | 1701 | 1649 | 411.7 |
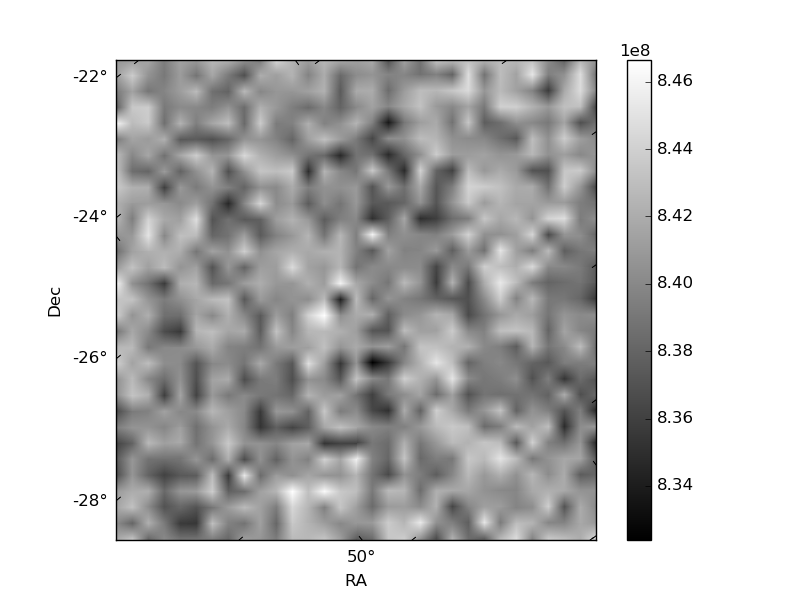
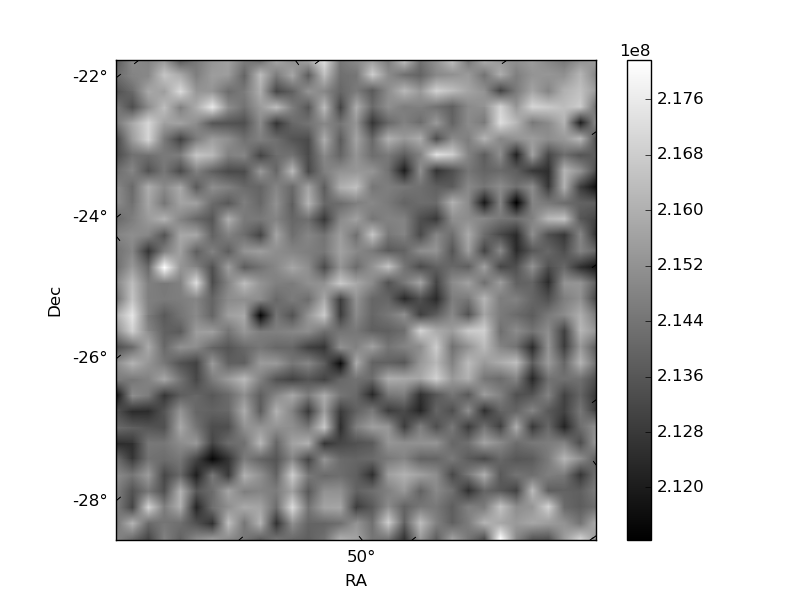
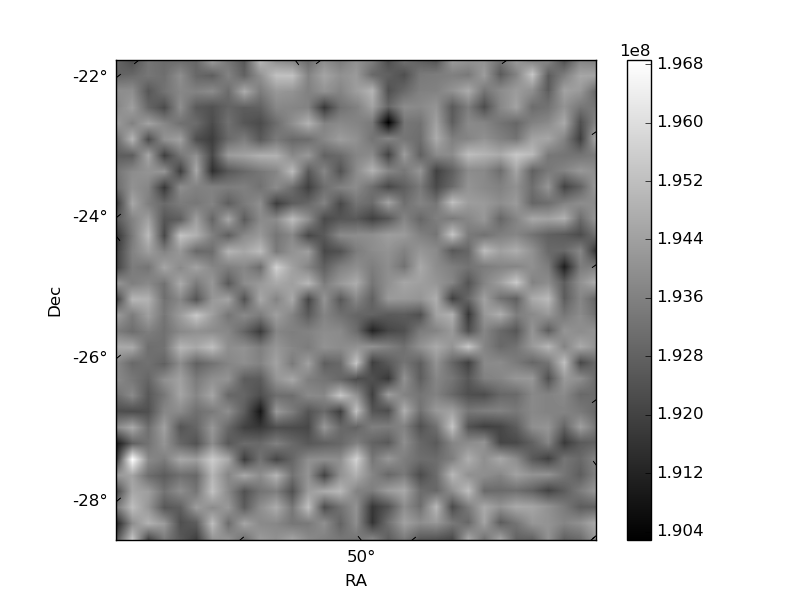
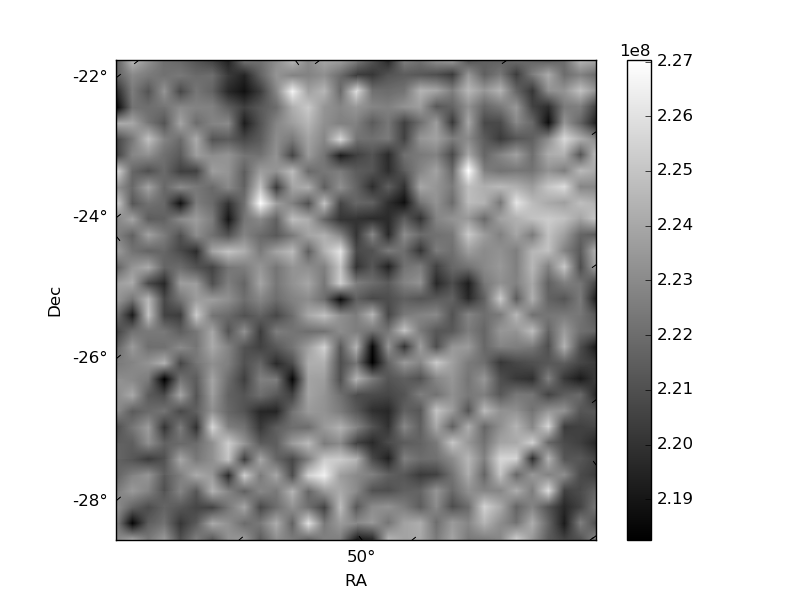
Histogram calculated using DETX and DETY for each event in the final _common_clean file
| Quadrant A | 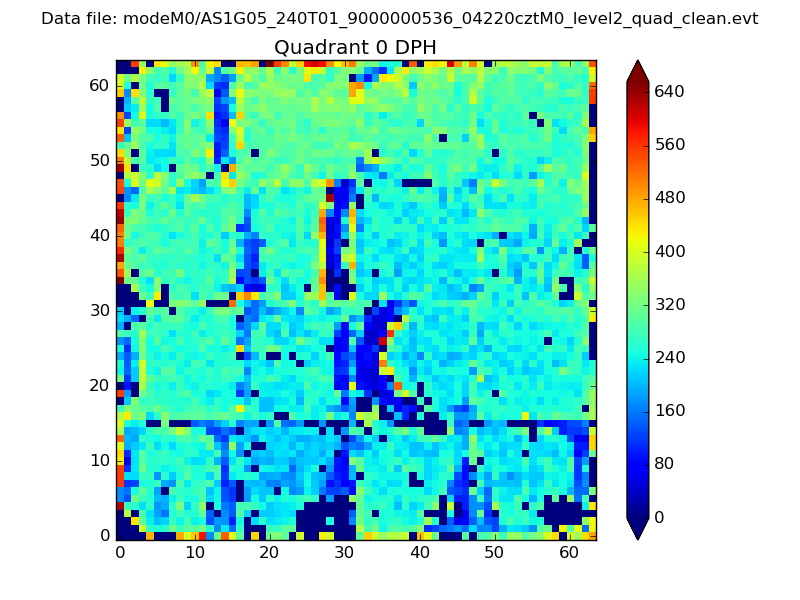 |
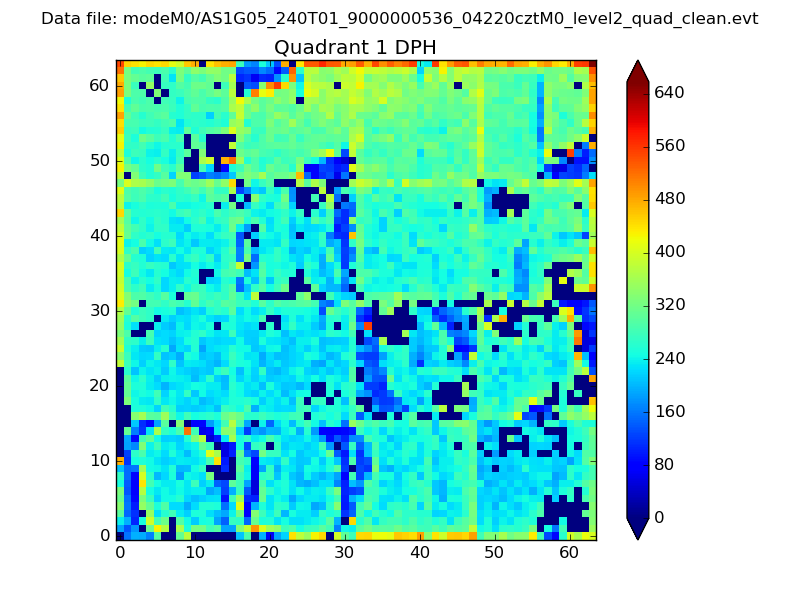 |
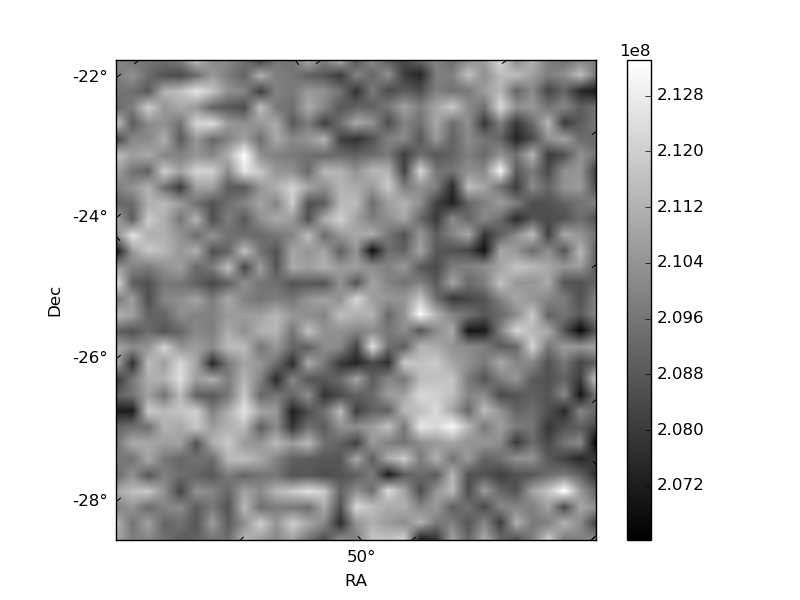
Quadrant B |
|---|---|---|---|
| Quadrant D | 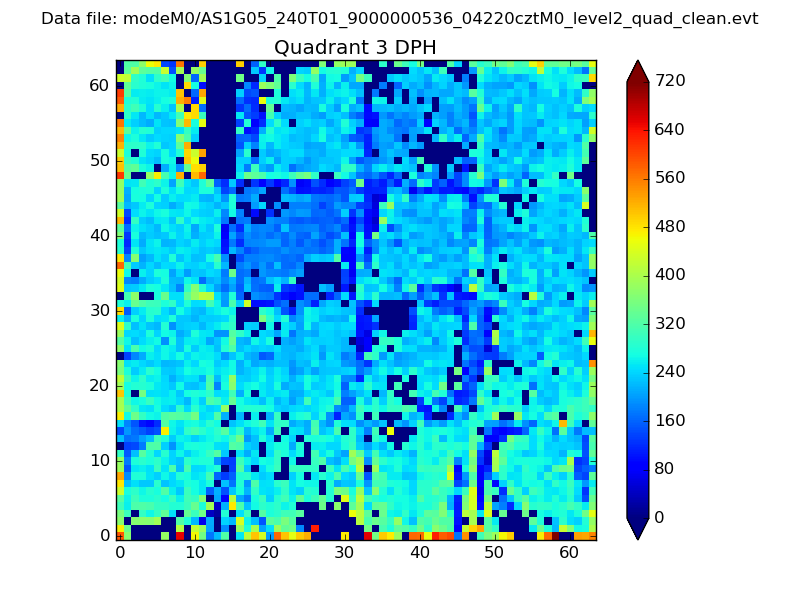 |
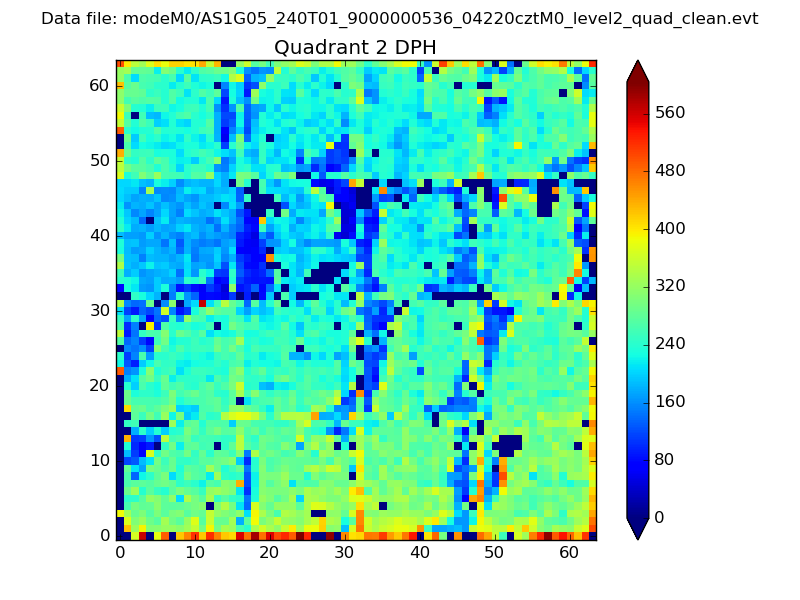 |
Quadrant C |
| Plot type | Count rate plots | Images |
|---|---|---|
| Comparison with Poisson distribution Blue bars denote a histogram of data divided into 1 sec bins. Red curve is a Poisson curve with rate = median count rate of data. |
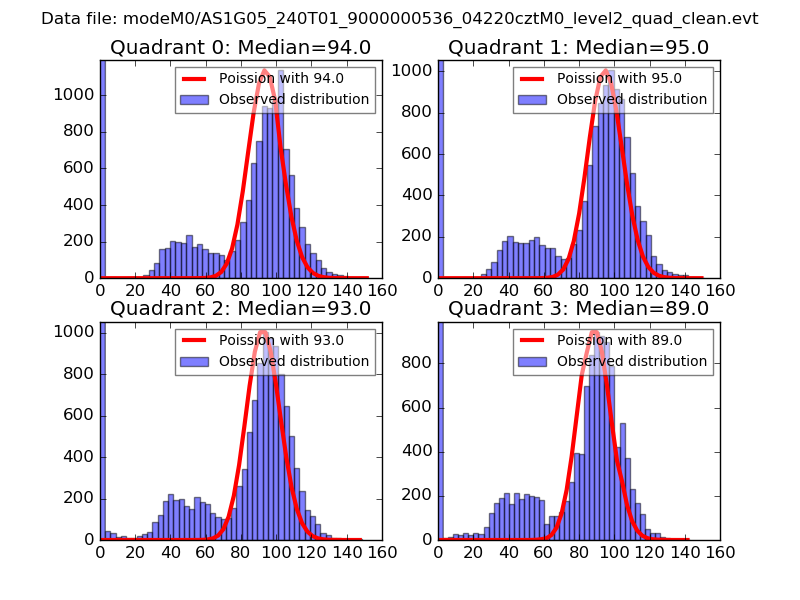 |
 |
| Quadrant-wise count rates Data is divided into 100 sec bins |
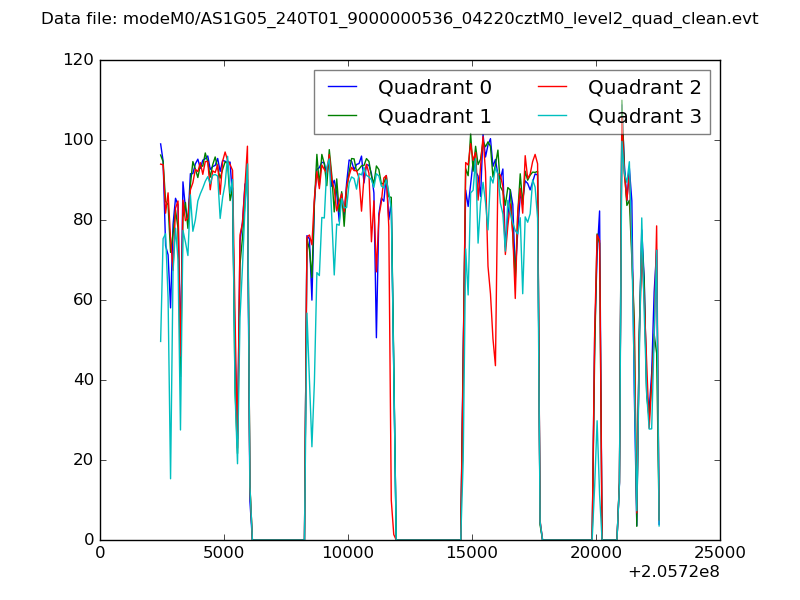 |
|
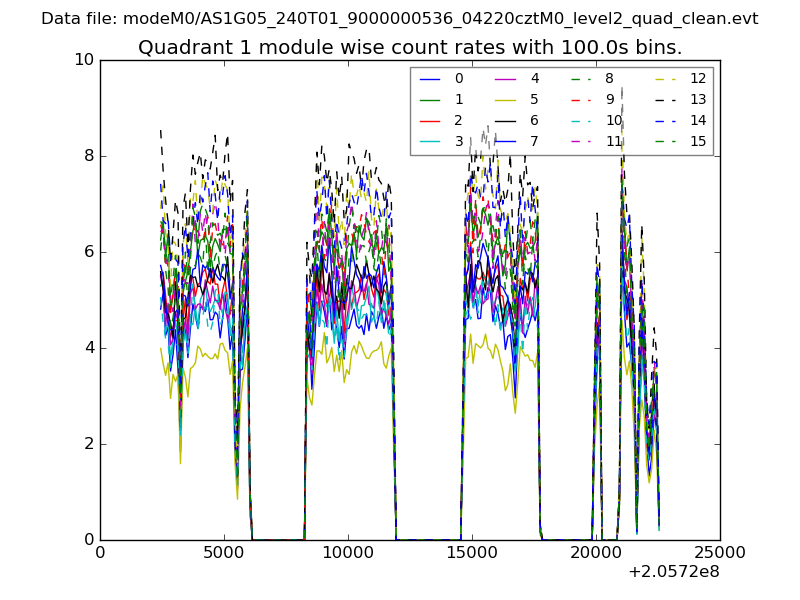
| Module-wise count rates for Quadrant A Data is divided into 100 sec bins |
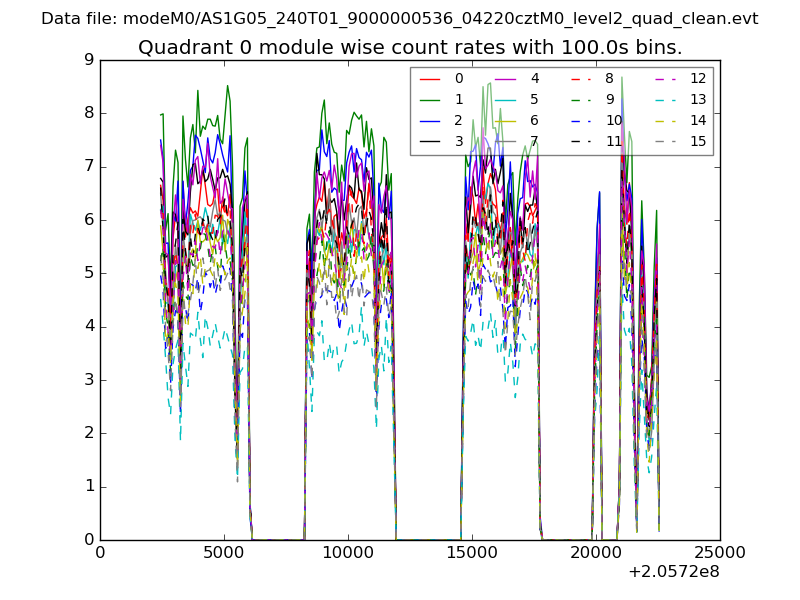 |
 |
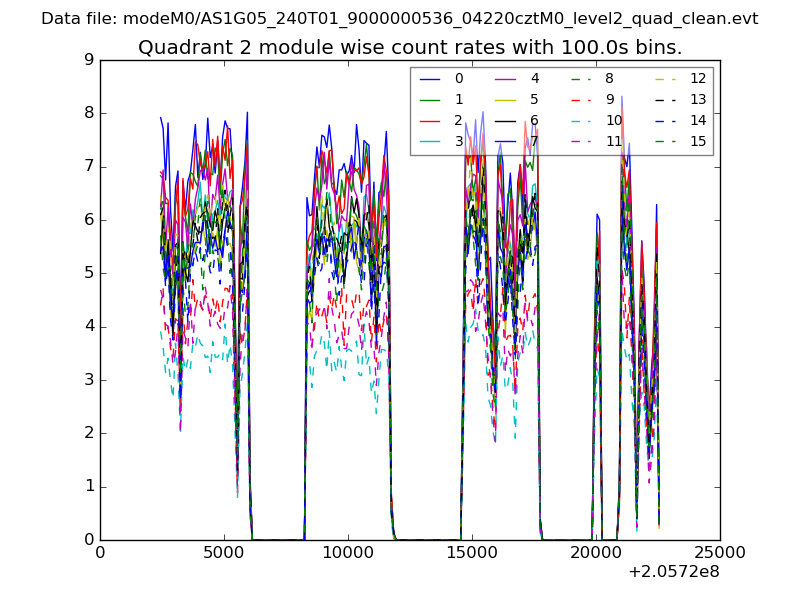
| Module-wise count rates for Quadrant B Data is divided into 100 sec bins |
 |
 |
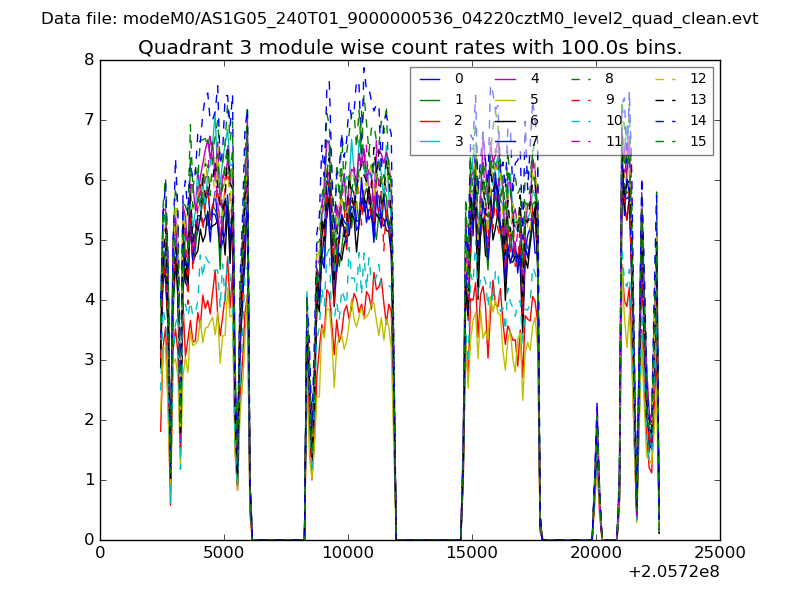
| Module-wise count rates for Quadrant C Data is divided into 100 sec bins |
 |
 |
| Module-wise count rates for Quadrant D Data is divided into 100 sec bins |
 |
 |
| Parameter | Plot |
|---|---|
| CZT HV Monitor | 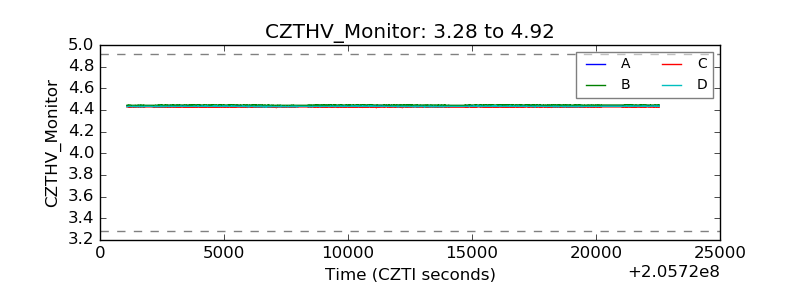 |
| D_VDD |  |
| Temperature 1 | 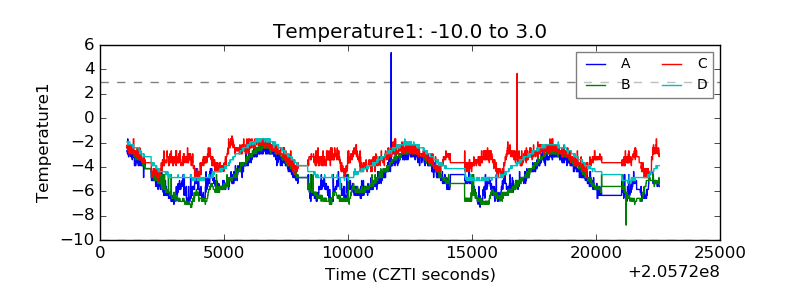 |
| Veto HV Monitor | 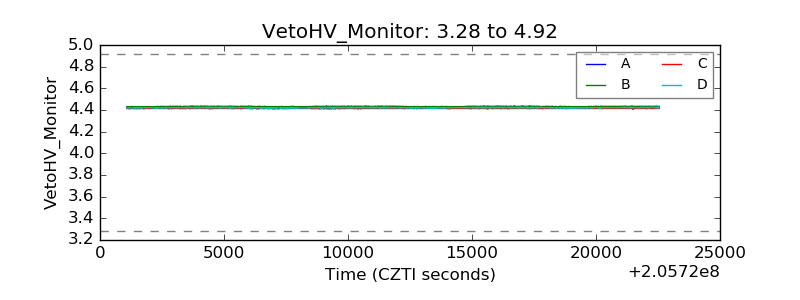 |
| Veto LLD | 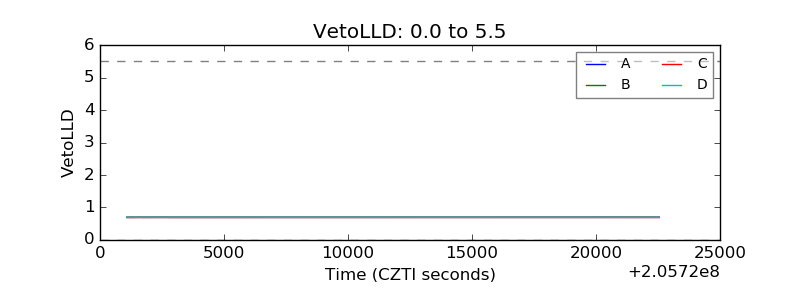 |
| Alpha Counter | 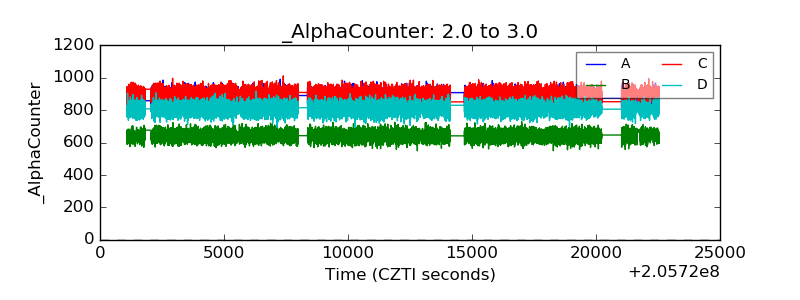 |
| _CPM_Rate | 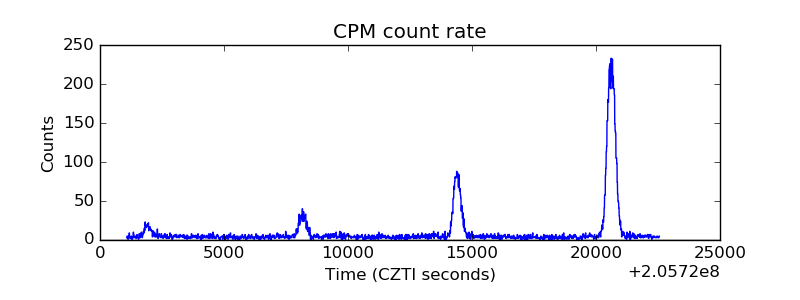 |
| CZT Counter | 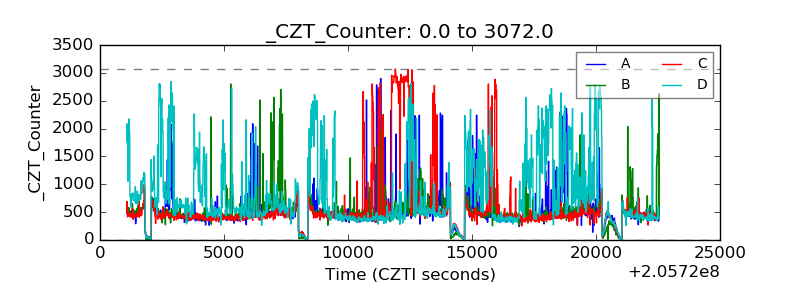 |
| +2.5 Volts monitor |  |
| +5 Volts monitor |  |
| _ROLL_ROT | 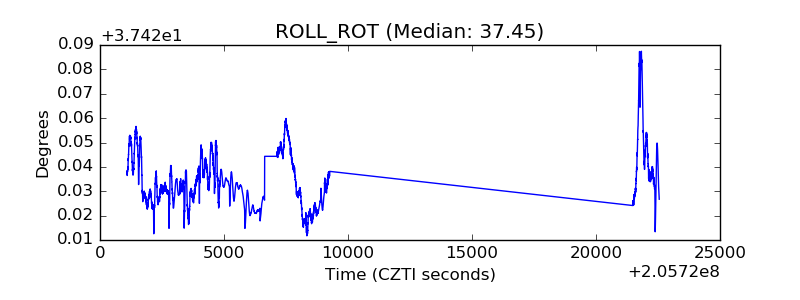 |
| _Roll_DEC | 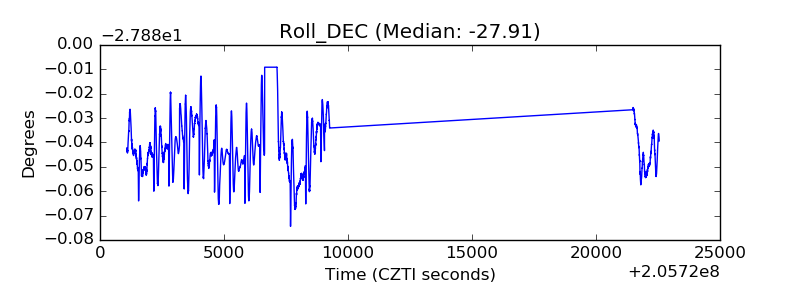 |
| _Roll_RA | 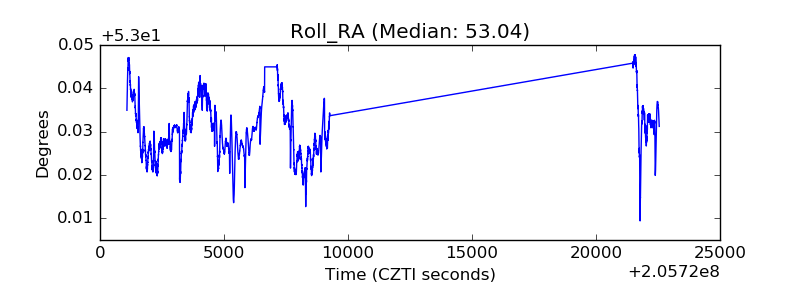 |
| Veto Counter | 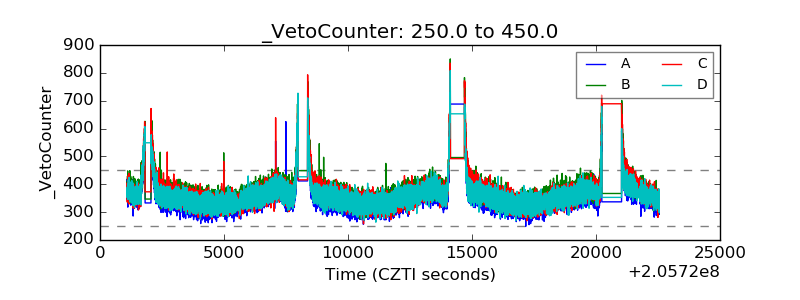 |