| Param | Original file | Final file |
|---|---|---|
| Filename | modeM0/AS1G05_240T01_9000000536_04221cztM0_level2.evt | modeM0/AS1G05_240T01_9000000536_04221cztM0_level2_quad_clean.evt |
| Size (bytes) | 158,915,520 | 31,343,040 |
| Size | 151.6 MB | 29.9 MB |
| Events in quadrant A | 1,006,904 | 135,511 |
| Events in quadrant B | 1,481,361 | 263,701 |
| Events in quadrant C | 1,552,832 | 250,388 |
| Events in quadrant D | 590,296 | 112,461 |
| Mode SS | |||
|---|---|---|---|
| Quadrant | BADHDUFLAG | Total packets | Discarded packets |
| A | 0 | 224764499168 | 0 |
| B | 0 | -1 | -1 |
| C | 0 | -1 | -1 |
| D | 0 | -1 | -1 |
| Mode M9 | |||
|---|---|---|---|
| Quadrant | BADHDUFLAG | Total packets | Discarded packets |
| A | 0 | 3 | 0 |
| B | 0 | 31 | 0 |
| C | 0 | 3 | 0 |
| D | 0 | 31 | 0 |
| Mode M0 | |||
|---|---|---|---|
| Quadrant | BADHDUFLAG | Total packets | Discarded packets |
| A | 0 | 45058 | 40717 |
| B | 0 | 35360 | 29106 |
| C | 0 | 32509 | 25470 |
| D | 0 | 48349 | 45783 |
| Quadrant | Total seconds | Saturated seconds | Saturation percentage |
|---|---|---|---|
| A | 2173 | 5 | 0.230097% |
| B | 3131 | 8 | 0.255509% |
| C | 3521 | 3 | 0.085203% |
| D | 1289 | 7 | 0.543057% |
Noise dominated data is calculated using 1-second bins in cleaned event files. If a bin has >2000 counts, and if more than 50% of those come from <1% of pixels, then it is considered to be noise-dominated and hence unusable.
| Quadrant | # 1 sec bins | Bins with >0 counts | Bins with >2000 counts | High rate bins dominated by noise | Noise dominated (total time) | Noise dominated (detector-on time) | Marked lightcurve |
|---|---|---|---|---|---|---|---|
| A | 46881 | 4342 | 0 | 0 | 0.00% | 0.00% | 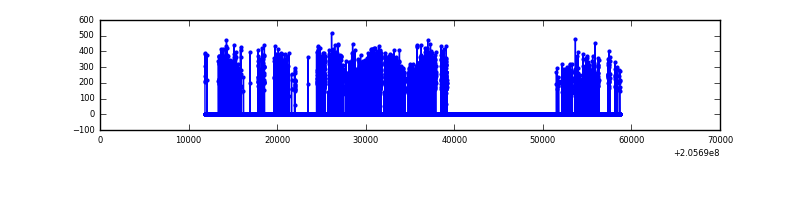 |
| B | 46640 | 6253 | 0 | 0 | 0.00% | 0.00% | 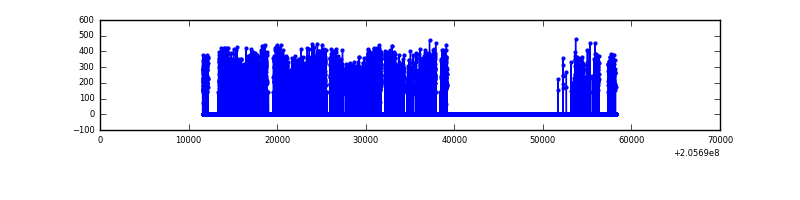 |
| C | 47138 | 7039 | 0 | 0 | 0.00% | 0.00% | 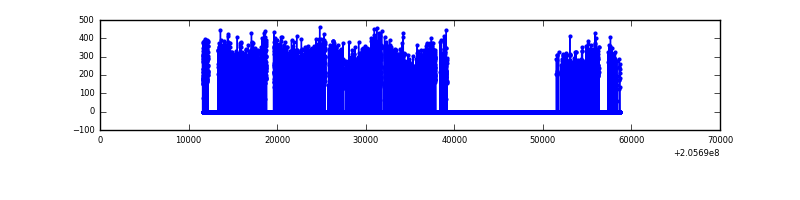 |
| D | 47138 | 2570 | 0 | 0 | 0.00% | 0.00% | 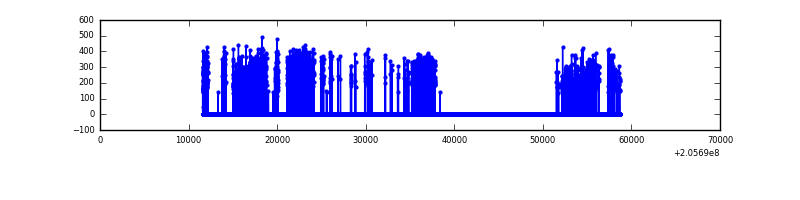 |
Top three noisy pixels from each quadrant. If the there are fewer than three noisy pixels in the level2.evt file, extra rows are filled as -1
| Pixel properties | Quadrant properties | ||||||
|---|---|---|---|---|---|---|---|
| Quadrant | DetID | PixID | Counts | Sigma | Mean | Median | Sigma |
| A | 0 | 50 | 21648 | 398.15 | 251 | 245 | 53.8 |
| A | 15 | 234 | 9901 | 179.63 | 251 | 245 | 53.8 |
| A | 0 | 226 | 2730 | 46.23 | 251 | 245 | 53.8 |
| B | 15 | 204 | 41025 | 568.05 | 361 | 352 | 71.6 |
| B | 3 | 0 | 21674 | 297.79 | 361 | 352 | 71.6 |
| B | 14 | 167 | 9968 | 134.3 | 361 | 352 | 71.6 |
| C | 9 | 144 | 20631 | 218.88 | 390 | 391 | 92.5 |
| C | 8 | 128 | 3792 | 36.78 | 390 | 391 | 92.5 |
| C | 13 | 61 | 3197 | 30.34 | 390 | 391 | 92.5 |
| D | 11 | 132 | 35953 | 1002.59 | 139 | 135 | 35.7 |
| D | 2 | 232 | 8040 | 221.26 | 139 | 135 | 35.7 |
| D | 9 | 85 | 6788 | 186.22 | 139 | 135 | 35.7 |
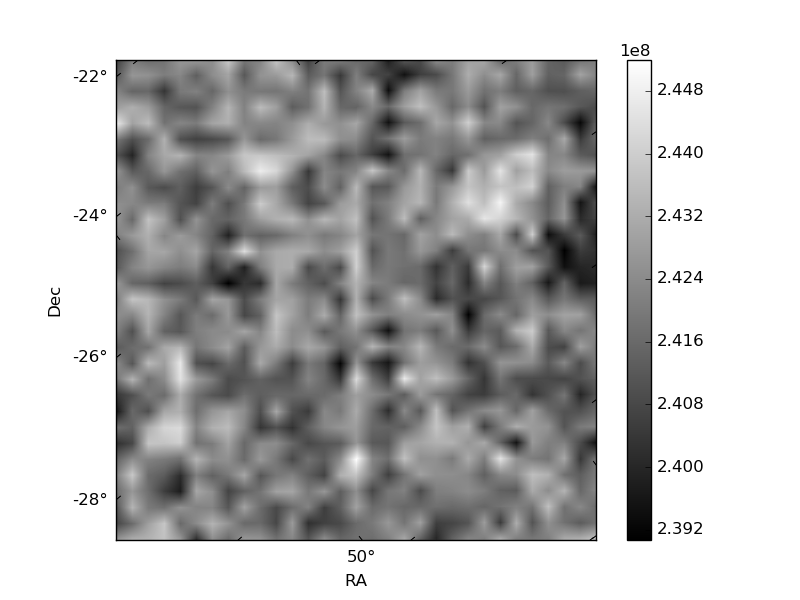
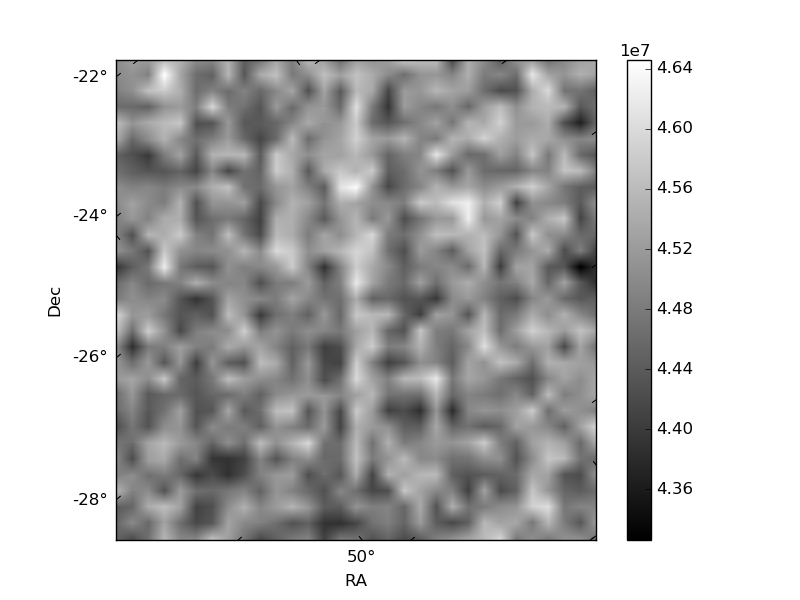
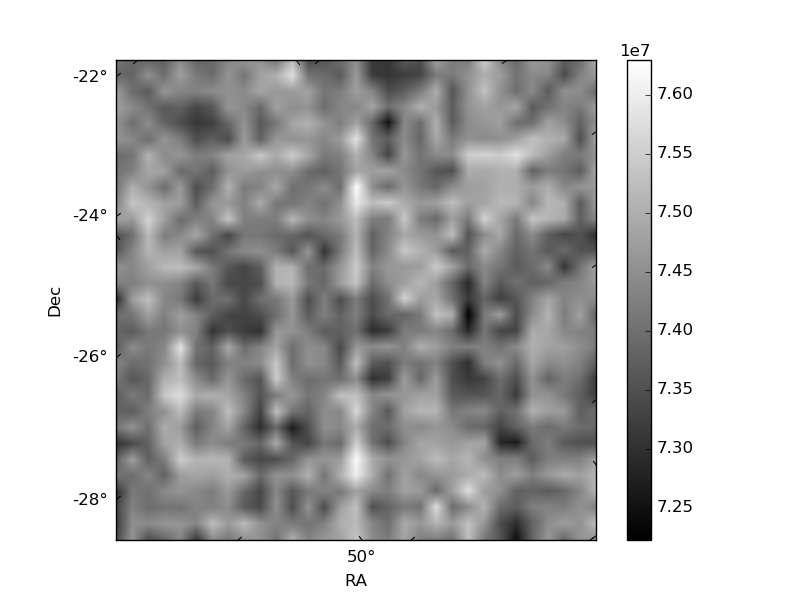
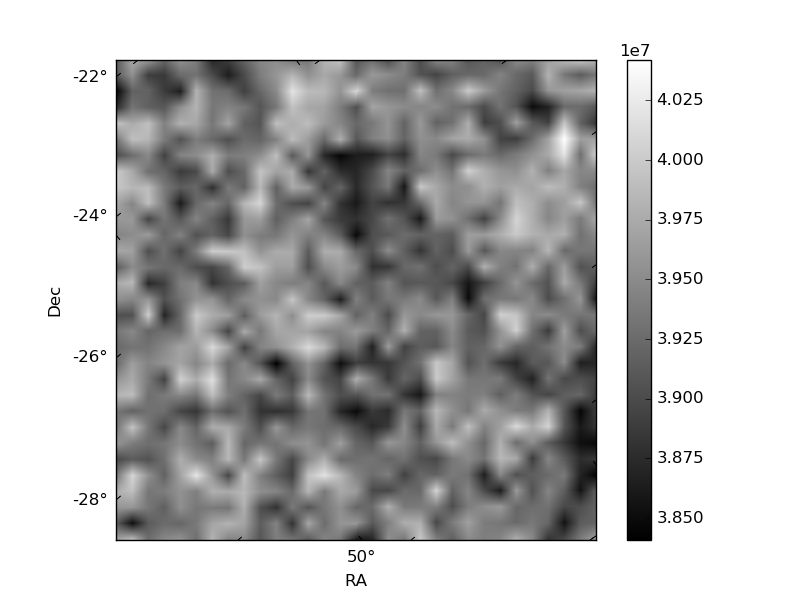
Histogram calculated using DETX and DETY for each event in the final _common_clean file
| Quadrant A | 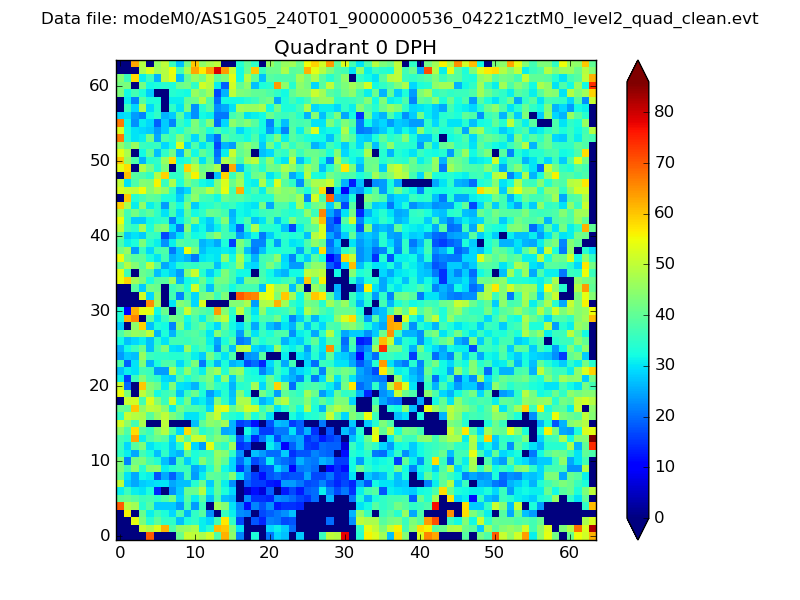 |
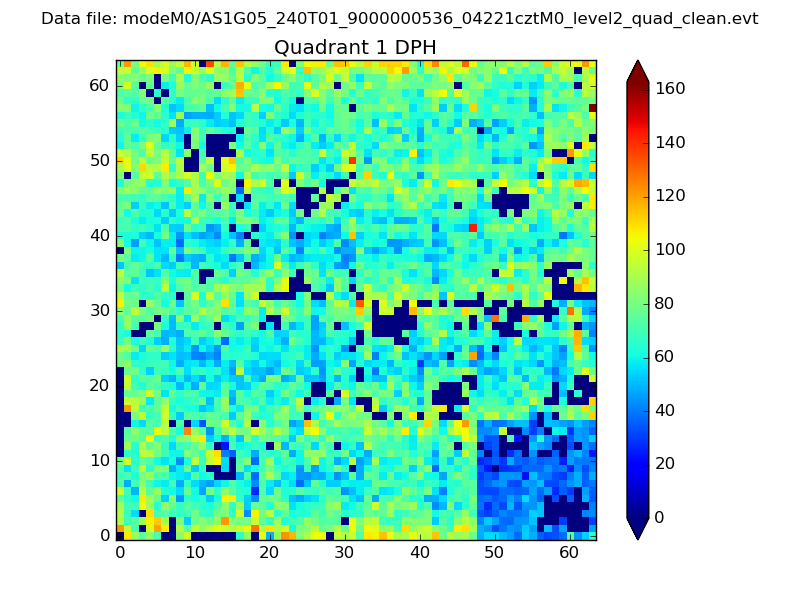 |
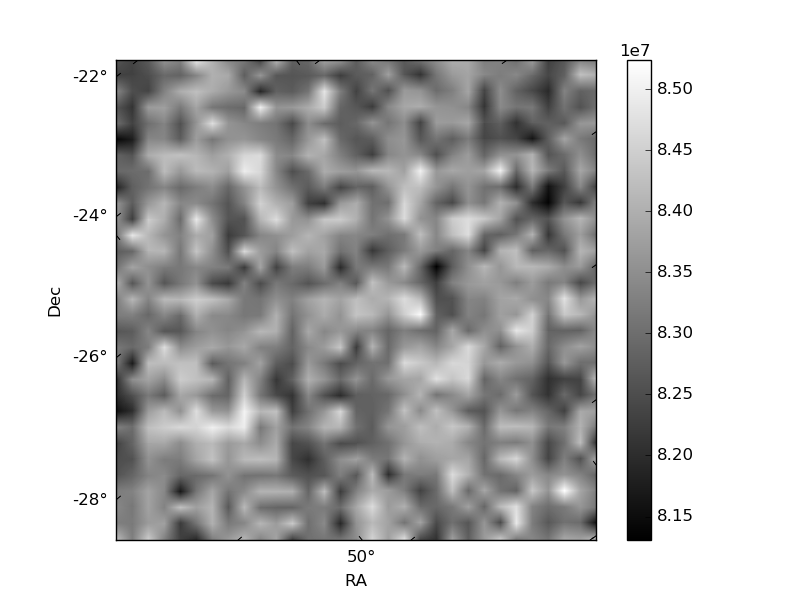
Quadrant B |
|---|---|---|---|
| Quadrant D | 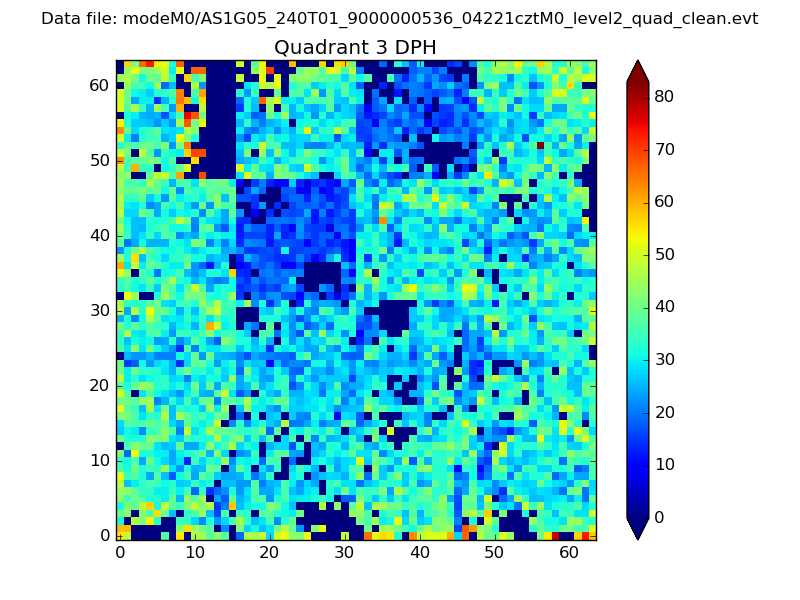 |
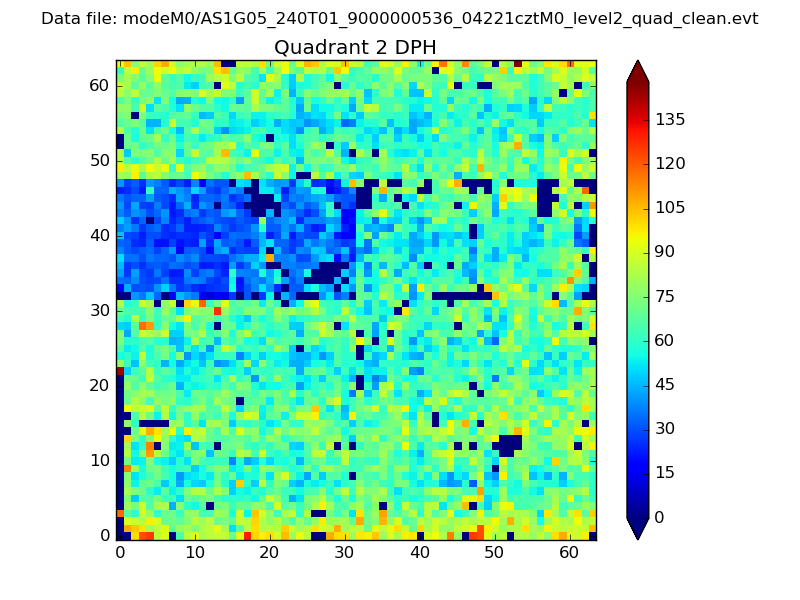 |
Quadrant C |
| Plot type | Count rate plots | Images |
|---|---|---|
| Comparison with Poisson distribution Blue bars denote a histogram of data divided into 1 sec bins. Red curve is a Poisson curve with rate = median count rate of data. |
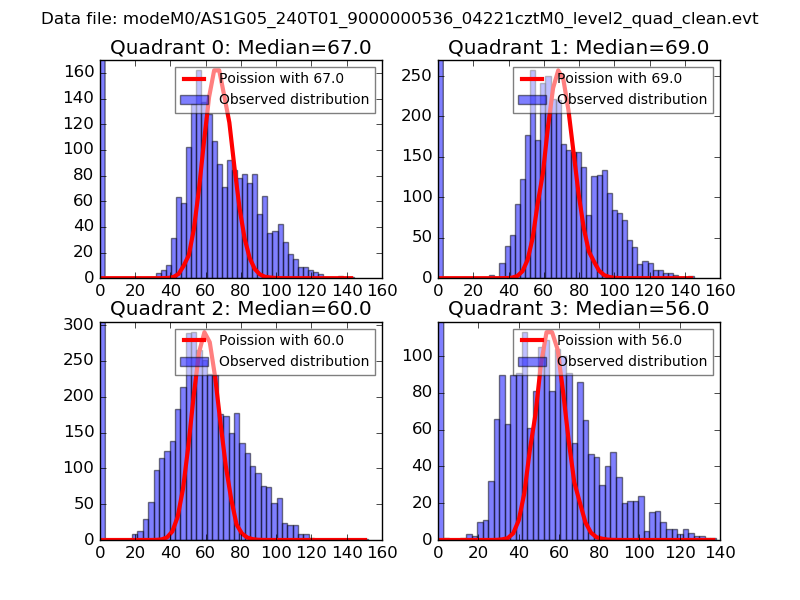 |
 |
| Quadrant-wise count rates Data is divided into 100 sec bins |
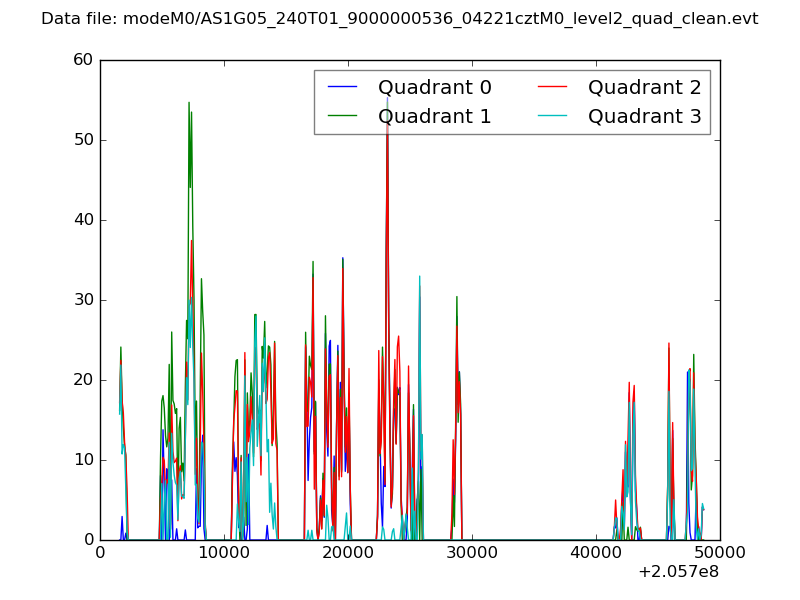 |
|
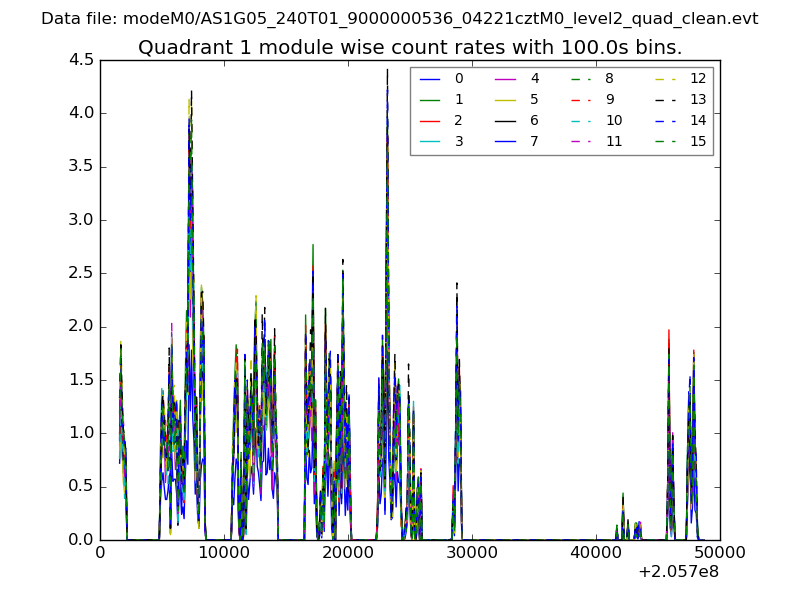
| Module-wise count rates for Quadrant A Data is divided into 100 sec bins |
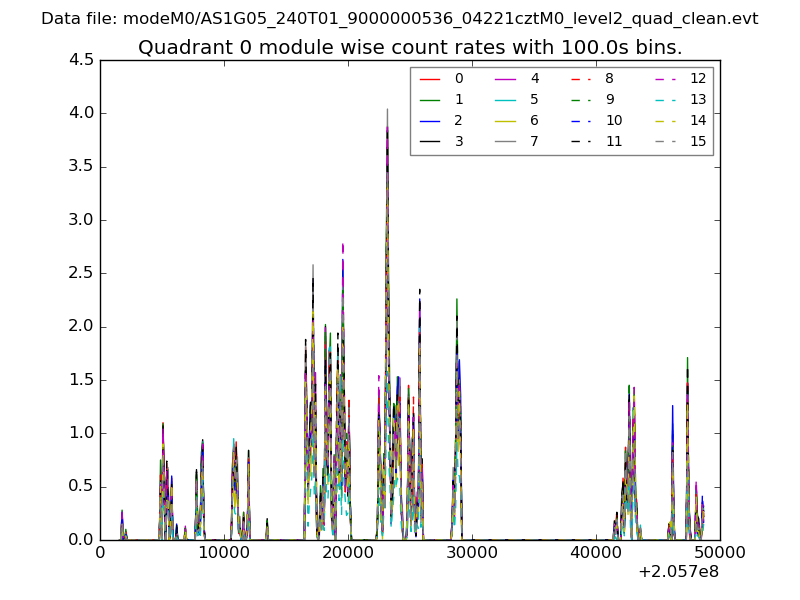 |
 |
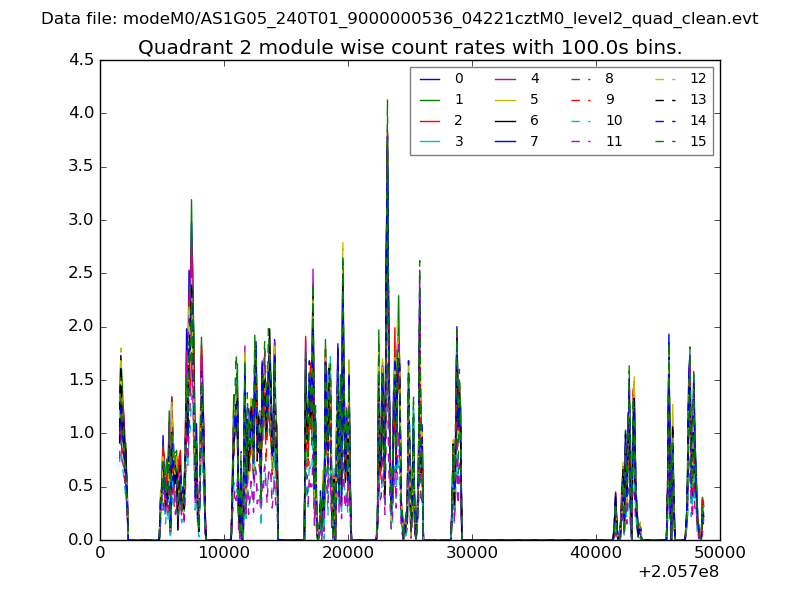
| Module-wise count rates for Quadrant B Data is divided into 100 sec bins |
 |
 |
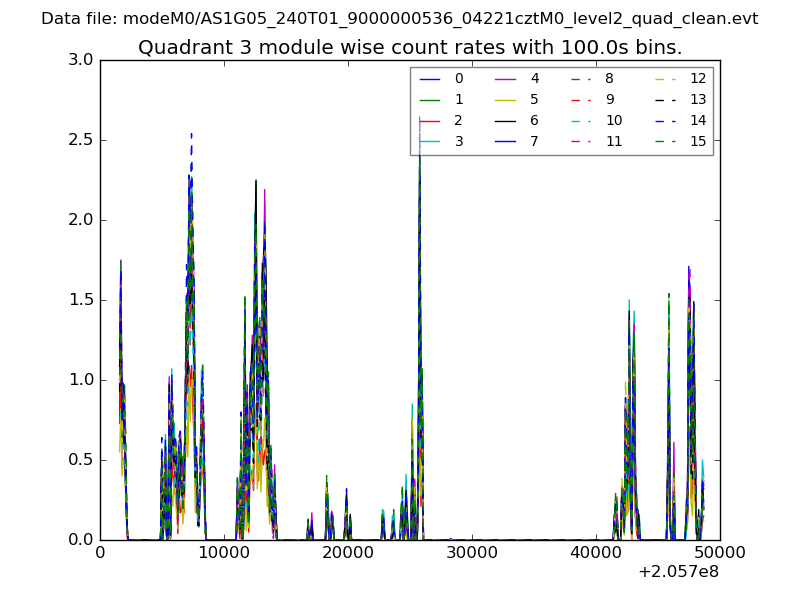
| Module-wise count rates for Quadrant C Data is divided into 100 sec bins |
 |
 |
| Module-wise count rates for Quadrant D Data is divided into 100 sec bins |
 |
 |
| Parameter | Plot |
|---|---|
| CZT HV Monitor | 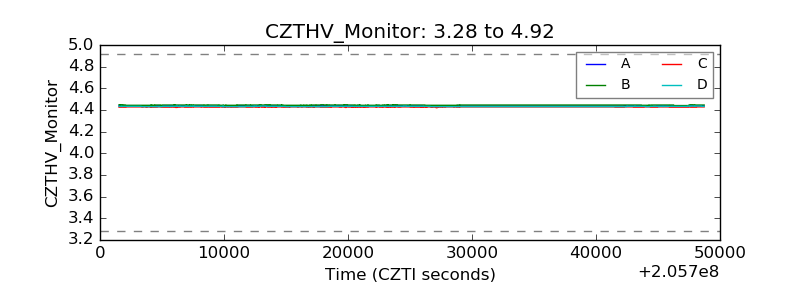 |
| D_VDD | 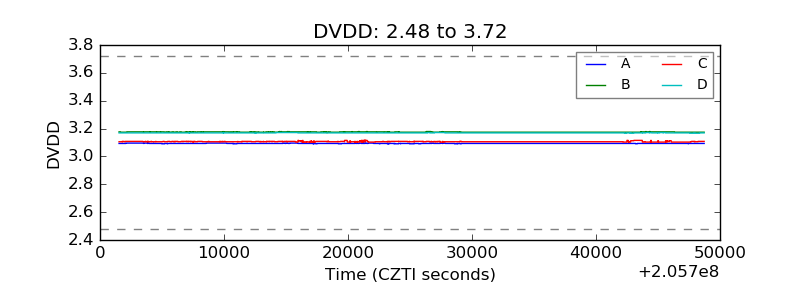 |
| Temperature 1 | 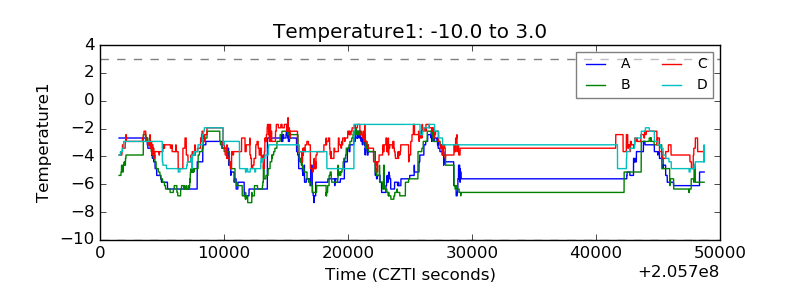 |
| Veto HV Monitor | 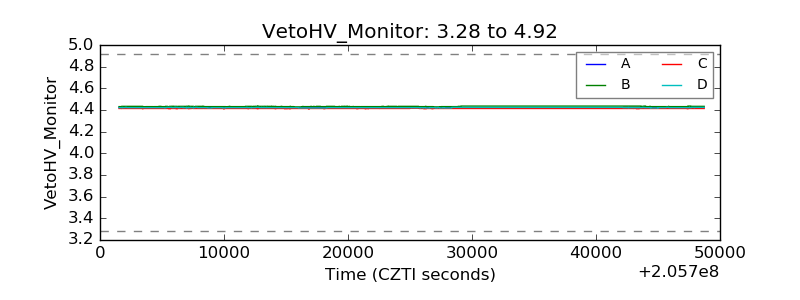 |
| Veto LLD | 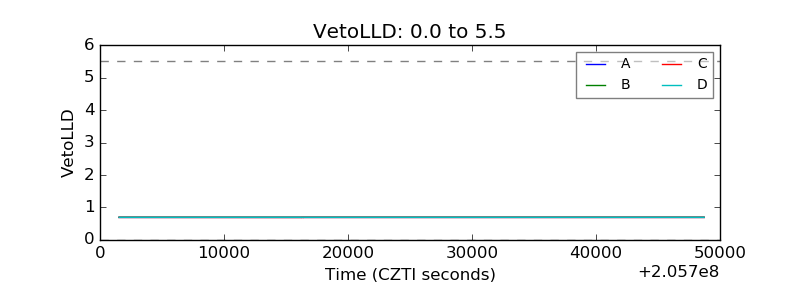 |
| Alpha Counter | 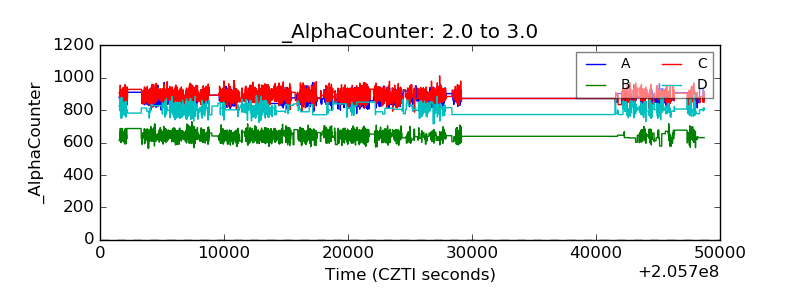 |
| _CPM_Rate | 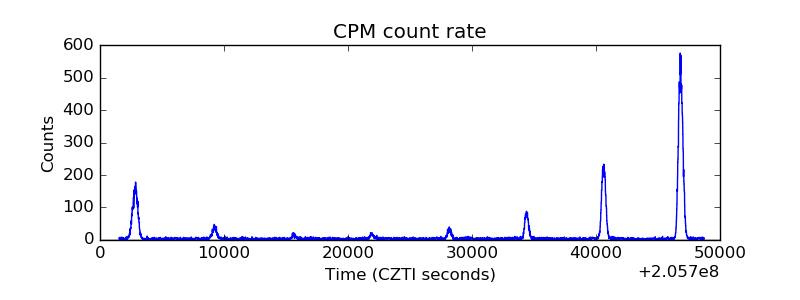 |
| CZT Counter | 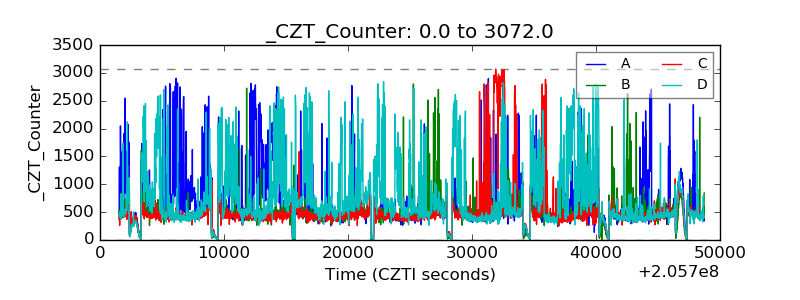 |
| +2.5 Volts monitor |  |
| +5 Volts monitor |  |
| _ROLL_ROT |  |
| _Roll_DEC | 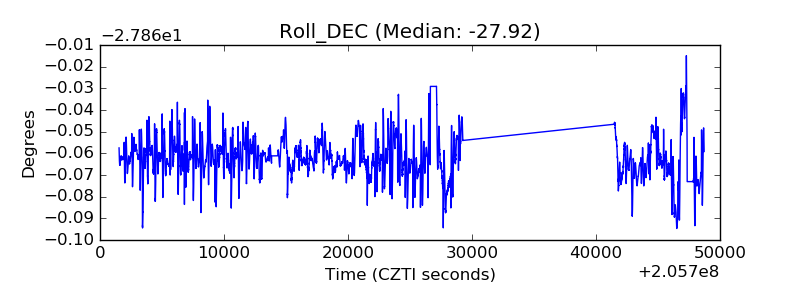 |
| _Roll_RA | 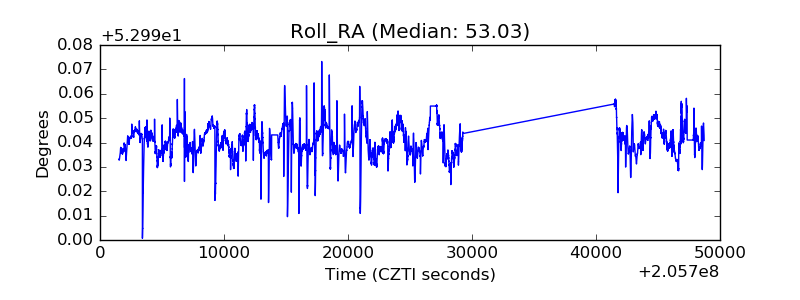 |
| Veto Counter | 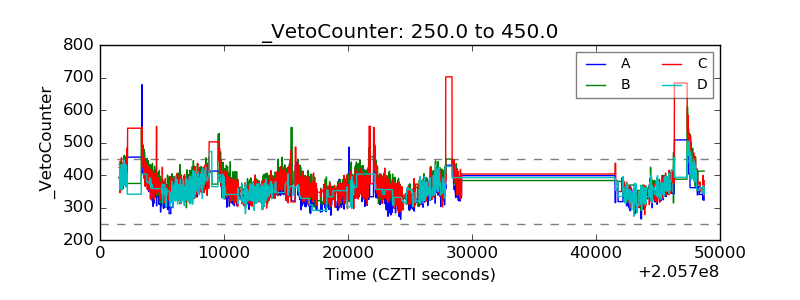 |