| Param | Original file | Final file |
|---|---|---|
| Filename | modeM0/AS1G05_240T01_9000000536_04223cztM0_level2.evt | modeM0/AS1G05_240T01_9000000536_04223cztM0_level2_quad_clean.evt |
| Size (bytes) | 444,228,480 | 70,004,160 |
| Size | 423.6 MB | 66.8 MB |
| Events in quadrant A | 3,470,788 | 420,920 |
| Events in quadrant B | 3,723,274 | 431,515 |
| Events in quadrant C | 2,763,312 | 425,475 |
| Events in quadrant D | 3,075,864 | 409,860 |
| Mode SS | |||
|---|---|---|---|
| Quadrant | BADHDUFLAG | Total packets | Discarded packets |
| A | 0 | 126 | 0 |
| B | 0 | 126 | 0 |
| C | 0 | 126 | 0 |
| D | 0 | 126 | 0 |
| Mode M9 | |||
|---|---|---|---|
| Quadrant | BADHDUFLAG | Total packets | Discarded packets |
| A | 0 | 11 | 0 |
| B | 0 | 11 | 0 |
| C | 0 | 11 | 0 |
| D | 0 | 11 | 0 |
| Mode M0 | |||
|---|---|---|---|
| Quadrant | BADHDUFLAG | Total packets | Discarded packets |
| A | 0 | 14410 | 2 |
| B | 0 | 14980 | 1 |
| C | 0 | 12571 | 1 |
| D | 0 | 13525 | 1 |
| Quadrant | Total seconds | Saturated seconds | Saturation percentage |
|---|---|---|---|
| A | 6183 | 226 | 3.655184% |
| B | 6183 | 117 | 1.892285% |
| C | 6183 | 23 | 0.371988% |
| D | 6183 | 83 | 1.342390% |
Noise dominated data is calculated using 1-second bins in cleaned event files. If a bin has >2000 counts, and if more than 50% of those come from <1% of pixels, then it is considered to be noise-dominated and hence unusable.
| Quadrant | # 1 sec bins | Bins with >0 counts | Bins with >2000 counts | High rate bins dominated by noise | Noise dominated (total time) | Noise dominated (detector-on time) | Marked lightcurve |
|---|---|---|---|---|---|---|---|
| A | 7263 | 6184 | 149 | 149 | 2.05% | 2.41% | 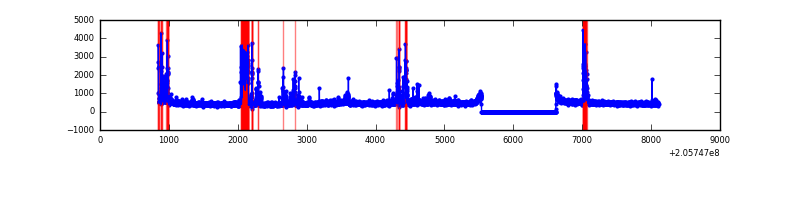 |
| B | 7263 | 6184 | 80 | 80 | 1.10% | 1.29% | 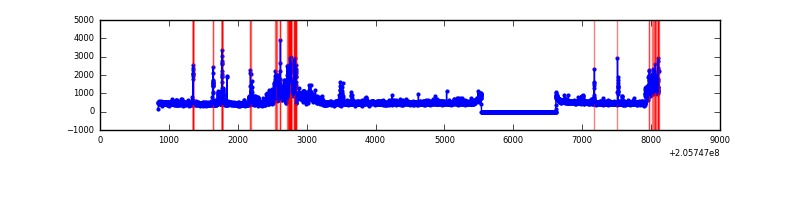 |
| C | 7263 | 6184 | 0 | 0 | 0.00% | 0.00% | 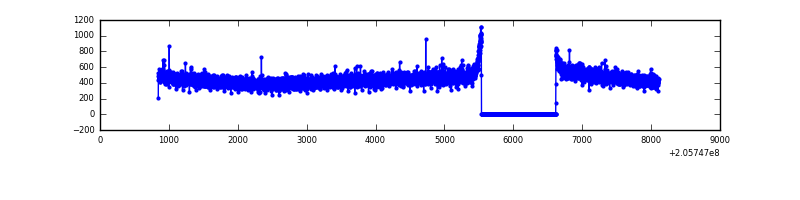 |
| D | 7263 | 6184 | 54 | 54 | 0.74% | 0.87% | 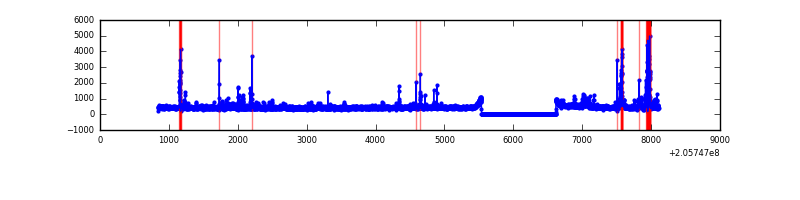 |
Top three noisy pixels from each quadrant. If the there are fewer than three noisy pixels in the level2.evt file, extra rows are filled as -1
| Pixel properties | Quadrant properties | ||||||
|---|---|---|---|---|---|---|---|
| Quadrant | DetID | PixID | Counts | Sigma | Mean | Median | Sigma |
| A | 0 | 50 | 464022 | 3190.14 | 712 | 697 | 145.2 |
| A | 12 | 247 | 188938 | 1296.1 | 712 | 697 | 145.2 |
| A | 8 | 15 | 43408 | 294.08 | 712 | 697 | 145.2 |
| B | 3 | 0 | 741978 | 5291.07 | 721 | 706 | 140.1 |
| B | 14 | 167 | 96835 | 686.15 | 721 | 706 | 140.1 |
| B | 15 | 204 | 29566 | 206.0 | 721 | 706 | 140.1 |
| C | 9 | 144 | 35747 | 215.49 | 697 | 700 | 162.6 |
| C | 10 | 65 | 5770 | 31.17 | 697 | 700 | 162.6 |
| C | 13 | 61 | 5617 | 30.23 | 697 | 700 | 162.6 |
| D | 13 | 239 | 315694 | 1859.78 | 698 | 678 | 169.4 |
| D | 2 | 232 | 51582 | 300.53 | 698 | 678 | 169.4 |
| D | 11 | 132 | 26094 | 150.05 | 698 | 678 | 169.4 |
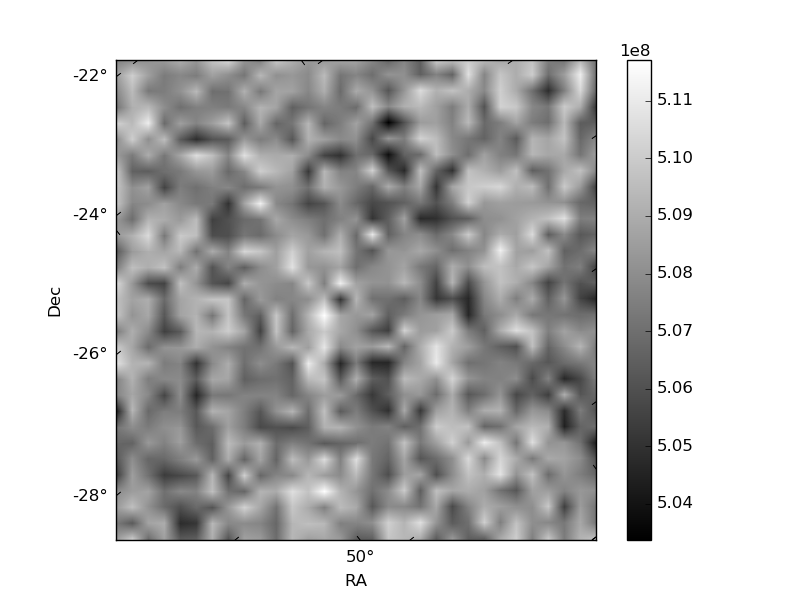
Histogram calculated using DETX and DETY for each event in the final _common_clean file
| Quadrant A | 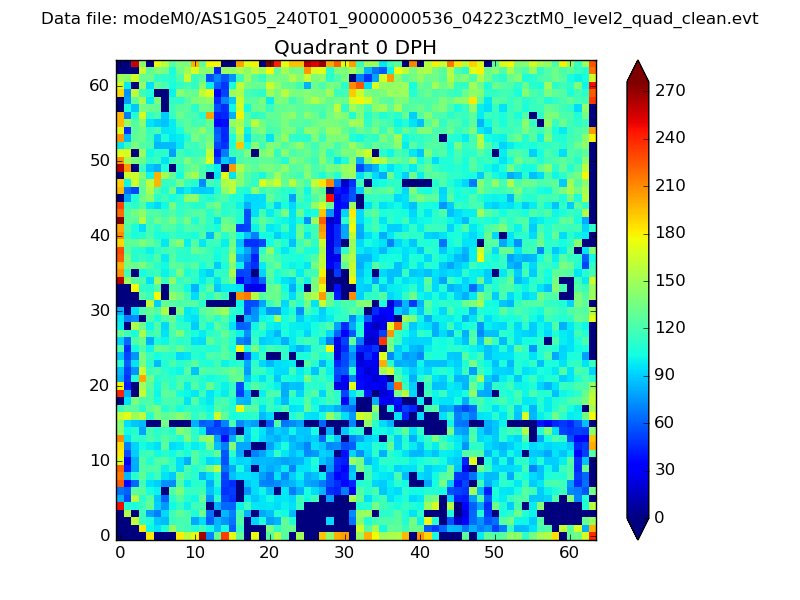 |
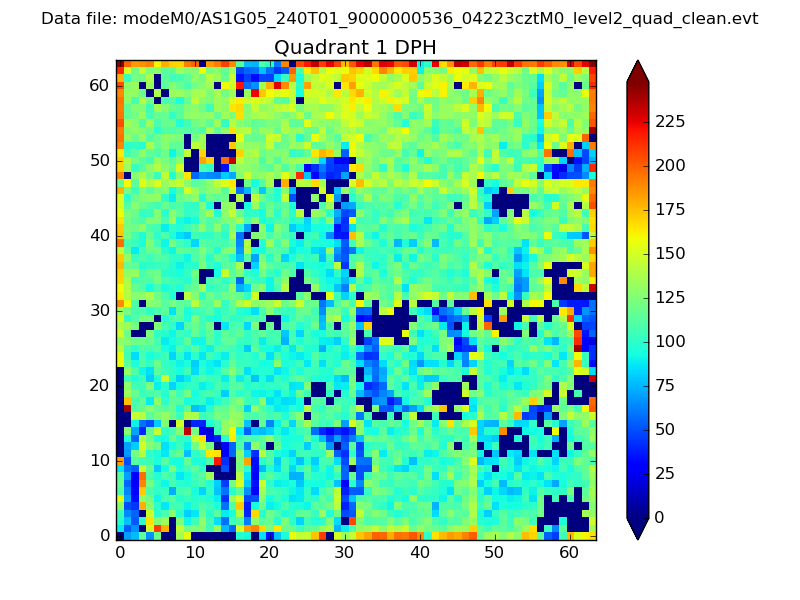 |
Quadrant B |
|---|---|---|---|
| Quadrant D |  |
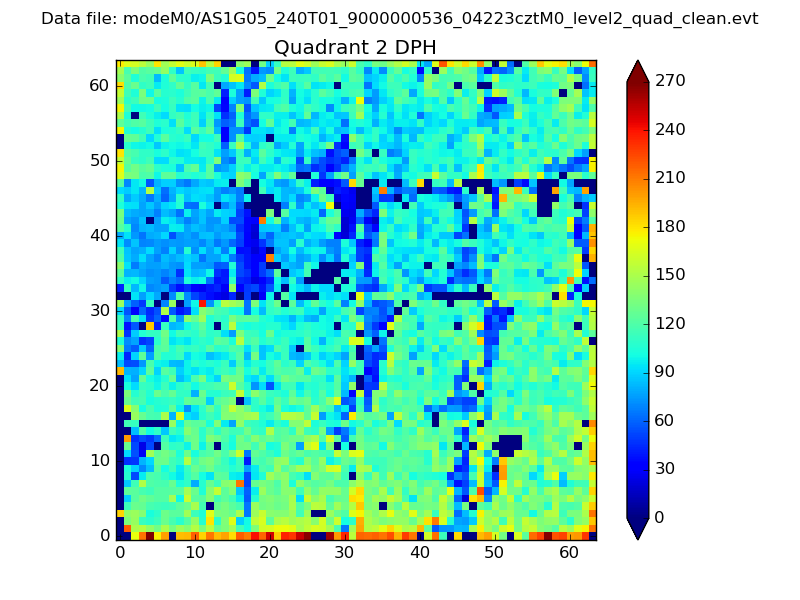 |
Quadrant C |
| Plot type | Count rate plots | Images |
|---|---|---|
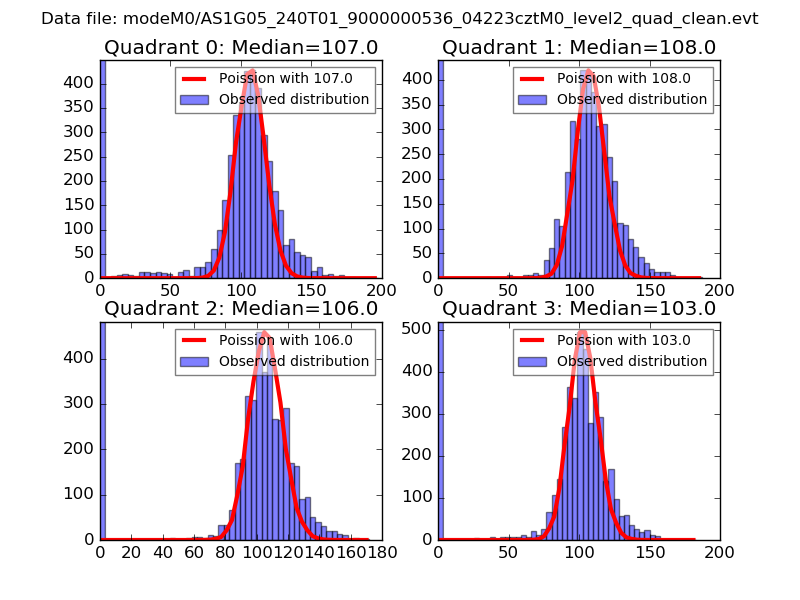
| Comparison with Poisson distribution Blue bars denote a histogram of data divided into 1 sec bins. Red curve is a Poisson curve with rate = median count rate of data. |
 |
 |
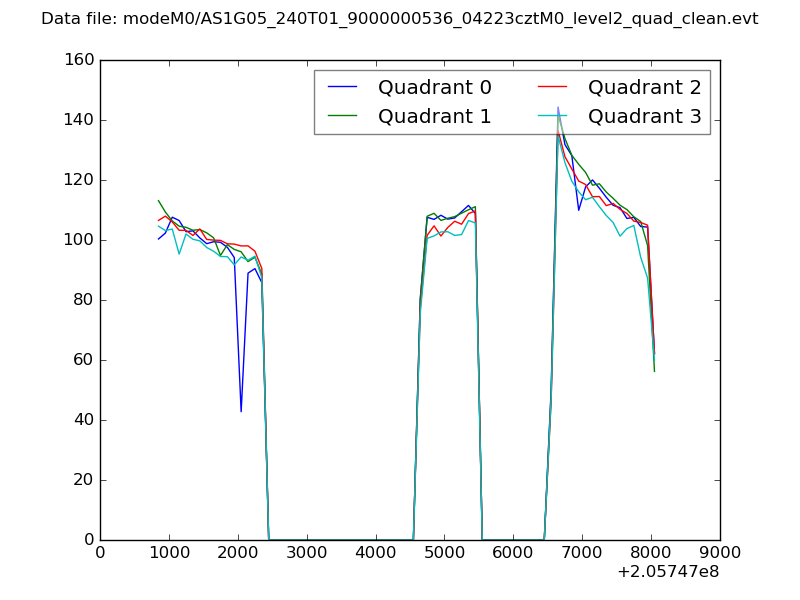
| Quadrant-wise count rates Data is divided into 100 sec bins |
 |
|
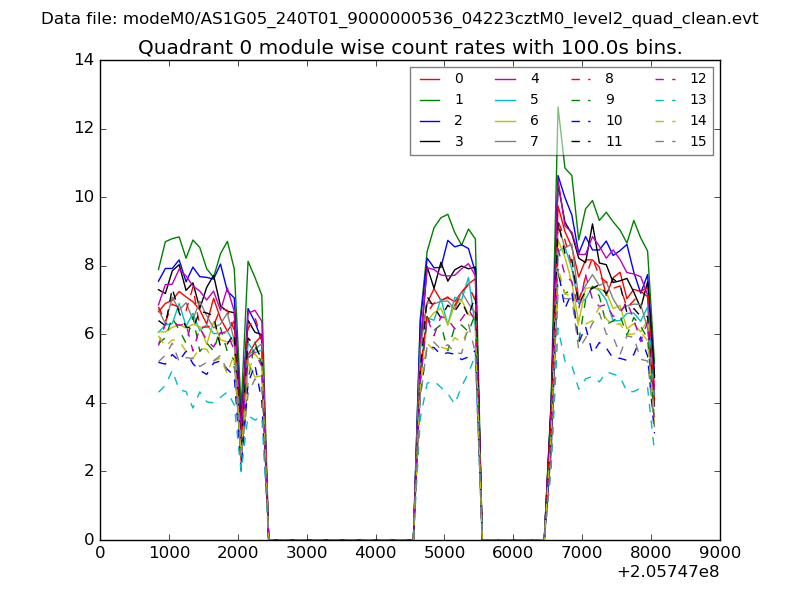
| Module-wise count rates for Quadrant A Data is divided into 100 sec bins |
 |
 |
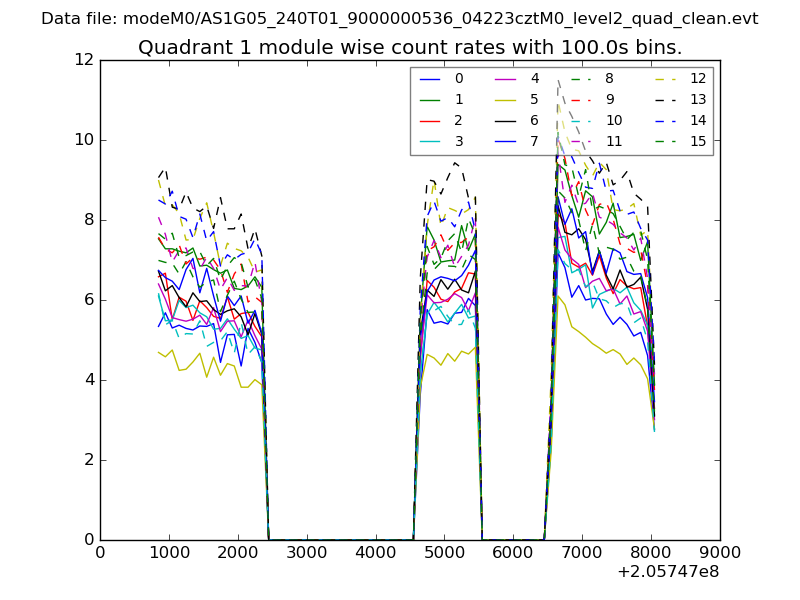
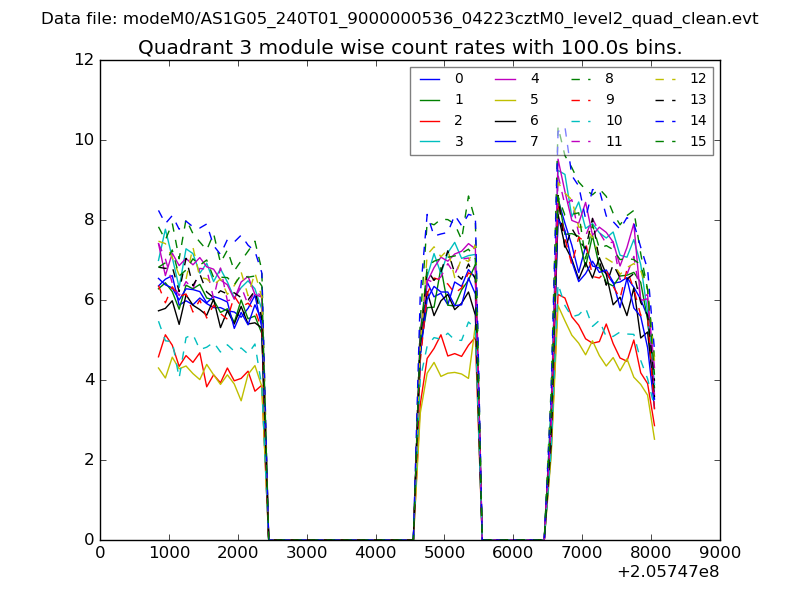
| Module-wise count rates for Quadrant B Data is divided into 100 sec bins |
 |
 |
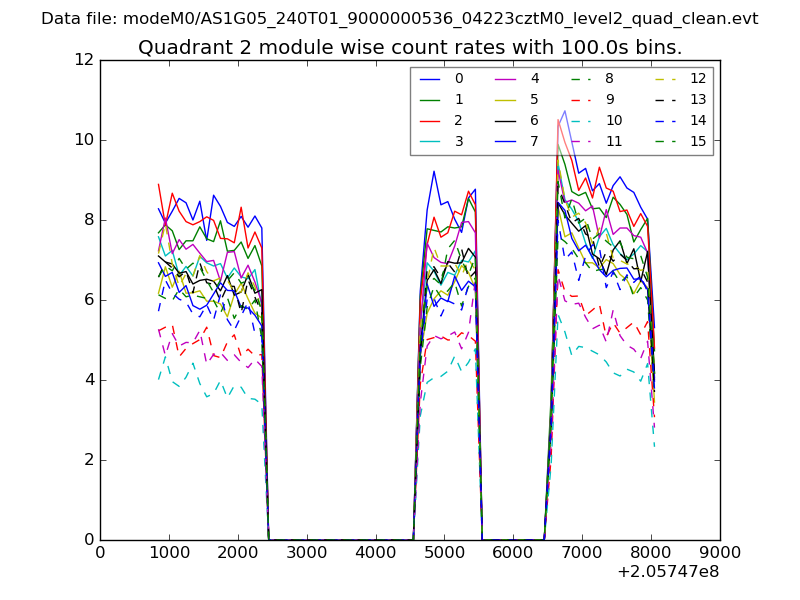
| Module-wise count rates for Quadrant C Data is divided into 100 sec bins |
 |
 |
| Module-wise count rates for Quadrant D Data is divided into 100 sec bins |
 |
 |
| Parameter | Plot |
|---|---|
| CZT HV Monitor | 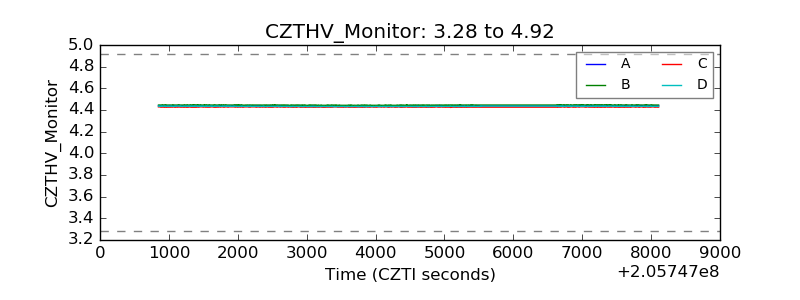 |
| D_VDD | 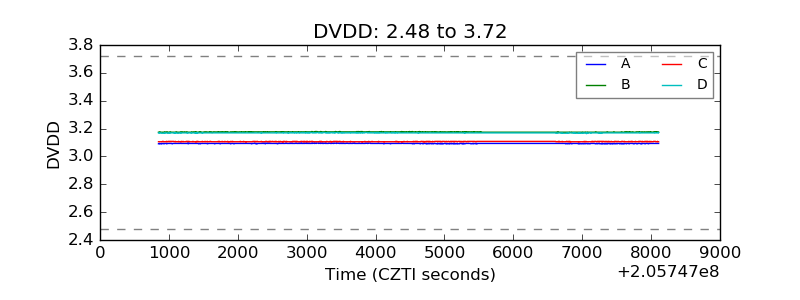 |
| Temperature 1 | 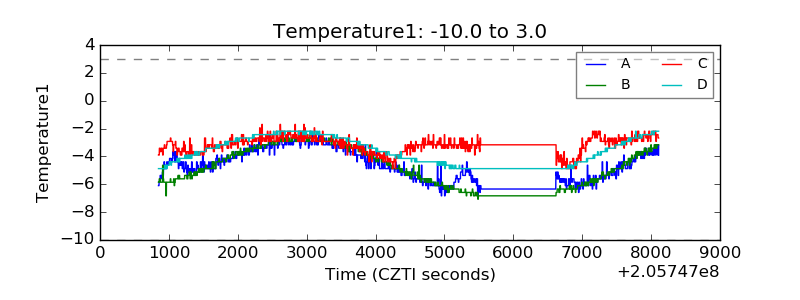 |
| Veto HV Monitor | 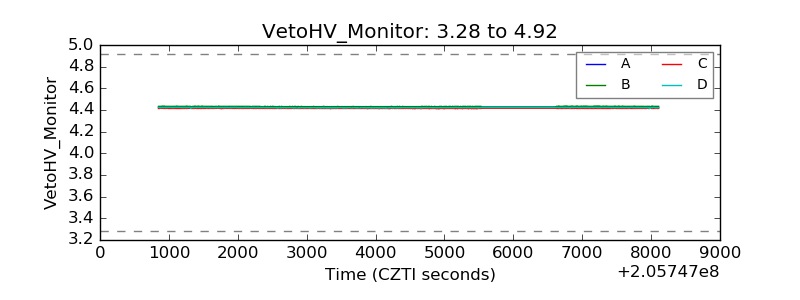 |
| Veto LLD | 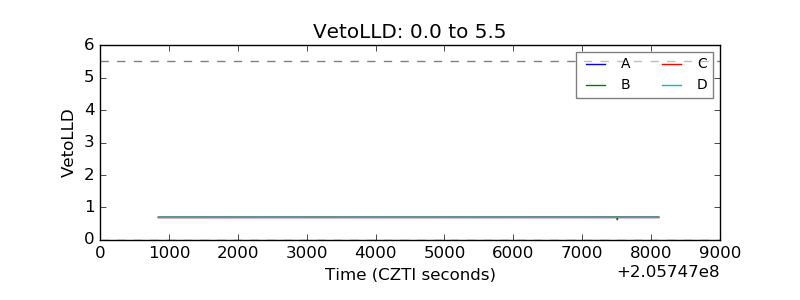 |
| Alpha Counter | 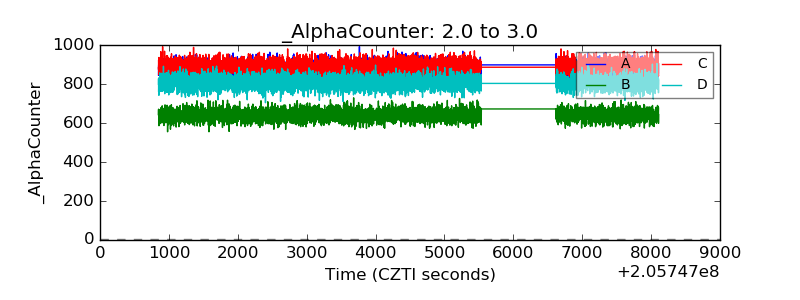 |
| _CPM_Rate | 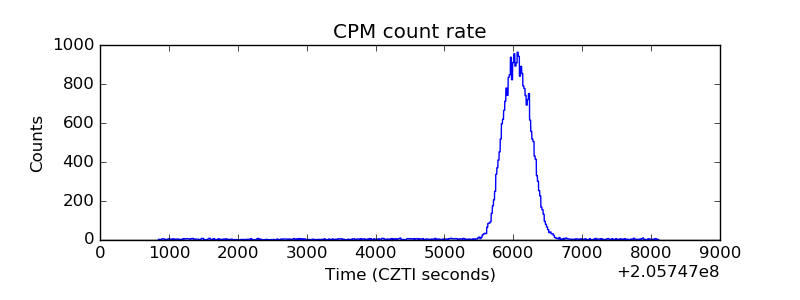 |
| CZT Counter | 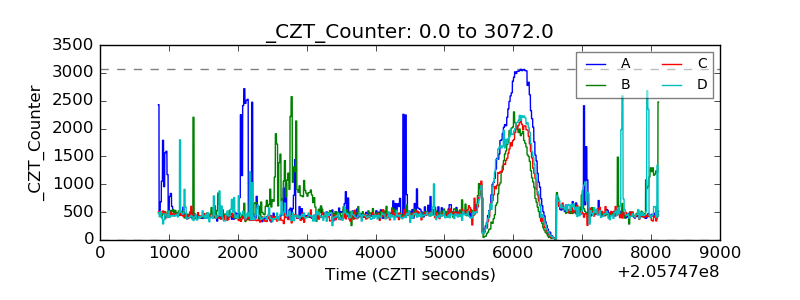 |
| +2.5 Volts monitor |  |
| +5 Volts monitor |  |
| _ROLL_ROT | 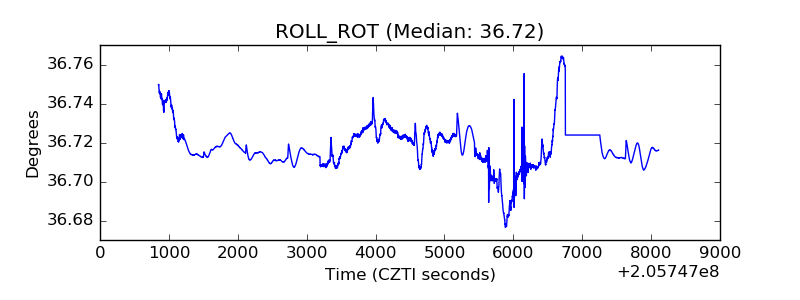 |
| _Roll_DEC | 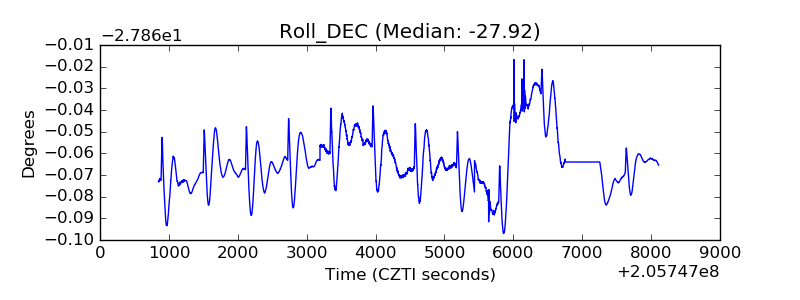 |
| _Roll_RA | 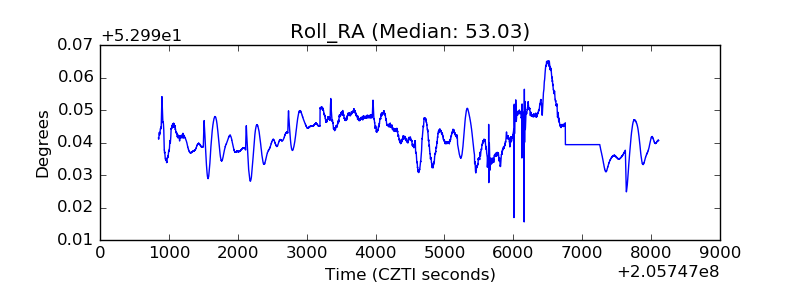 |
| Veto Counter | 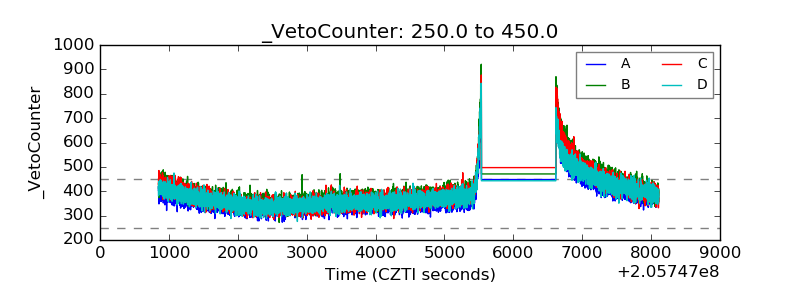 |