| Param | Original file | Final file |
|---|---|---|
| Filename | modeM0/AS1G05_240T01_9000000536_04226cztM0_level2.evt | modeM0/AS1G05_240T01_9000000536_04226cztM0_level2_quad_clean.evt |
| Size (bytes) | 571,380,480 | 70,528,320 |
| Size | 544.9 MB | 67.3 MB |
| Events in quadrant A | 4,761,216 | 411,931 |
| Events in quadrant B | 4,967,132 | 435,413 |
| Events in quadrant C | 3,295,366 | 426,305 |
| Events in quadrant D | 3,843,782 | 411,834 |
| Mode SS | |||
|---|---|---|---|
| Quadrant | BADHDUFLAG | Total packets | Discarded packets |
| A | 0 | 130 | 0 |
| B | 0 | 130 | 0 |
| C | 0 | 130 | 0 |
| D | 0 | 130 | 0 |
| Mode M9 | |||
|---|---|---|---|
| Quadrant | BADHDUFLAG | Total packets | Discarded packets |
| A | 0 | 14 | 0 |
| B | 0 | 14 | 0 |
| C | 0 | 14 | 0 |
| D | 0 | 15 | 0 |
| Mode M0 | |||
|---|---|---|---|
| Quadrant | BADHDUFLAG | Total packets | Discarded packets |
| A | 0 | 18239 | 3 |
| B | 0 | 18957 | 2 |
| C | 0 | 13852 | 2 |
| D | 0 | 15788 | 2 |
| Quadrant | Total seconds | Saturated seconds | Saturation percentage |
|---|---|---|---|
| A | 6449 | 594 | 9.210730% |
| B | 6449 | 398 | 6.171499% |
| C | 6449 | 111 | 1.721197% |
| D | 6449 | 156 | 2.418980% |
Noise dominated data is calculated using 1-second bins in cleaned event files. If a bin has >2000 counts, and if more than 50% of those come from <1% of pixels, then it is considered to be noise-dominated and hence unusable.
| Quadrant | # 1 sec bins | Bins with >0 counts | Bins with >2000 counts | High rate bins dominated by noise | Noise dominated (total time) | Noise dominated (detector-on time) | Marked lightcurve |
|---|---|---|---|---|---|---|---|
| A | 7714 | 6450 | 340 | 340 | 4.41% | 5.27% | 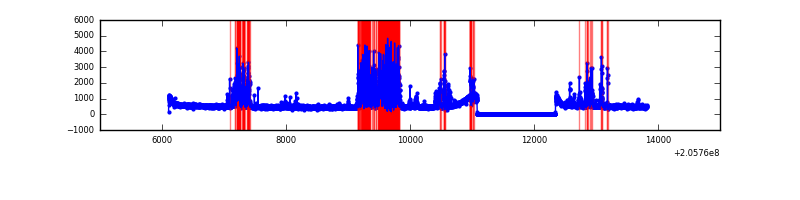 |
| B | 7714 | 6450 | 179 | 179 | 2.32% | 2.78% | 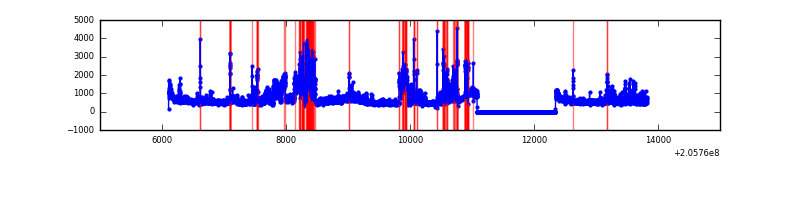 |
| C | 7714 | 6450 | 0 | 0 | 0.00% | 0.00% |  |
| D | 7714 | 6450 | 14 | 14 | 0.18% | 0.22% | 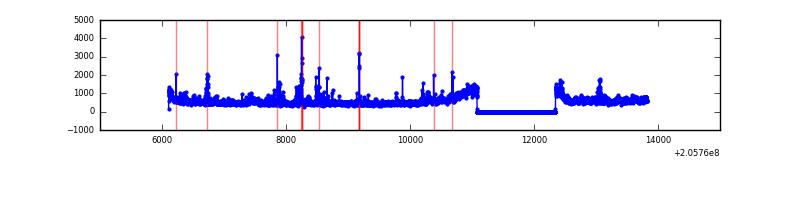 |
Top three noisy pixels from each quadrant. If the there are fewer than three noisy pixels in the level2.evt file, extra rows are filled as -1
| Pixel properties | Quadrant properties | ||||||
|---|---|---|---|---|---|---|---|
| Quadrant | DetID | PixID | Counts | Sigma | Mean | Median | Sigma |
| A | 0 | 50 | 1075617 | 6305.17 | 846 | 831 | 170.5 |
| A | 14 | 111 | 399035 | 2336.04 | 846 | 831 | 170.5 |
| A | 15 | 234 | 19240 | 108.0 | 846 | 831 | 170.5 |
| B | 3 | 0 | 1313111 | 8173.91 | 844 | 829 | 160.5 |
| B | 0 | 182 | 241972 | 1502.03 | 844 | 829 | 160.5 |
| B | 14 | 167 | 69451 | 427.43 | 844 | 829 | 160.5 |
| C | 9 | 144 | 110100 | 576.59 | 815 | 821 | 189.5 |
| C | 13 | 61 | 6638 | 30.69 | 815 | 821 | 189.5 |
| C | 14 | 67 | 3153 | 12.3 | 815 | 821 | 189.5 |
| D | 11 | 132 | 432693 | 2142.47 | 832 | 812 | 201.6 |
| D | 2 | 63 | 66090 | 323.83 | 832 | 812 | 201.6 |
| D | 13 | 239 | 64204 | 314.47 | 832 | 812 | 201.6 |
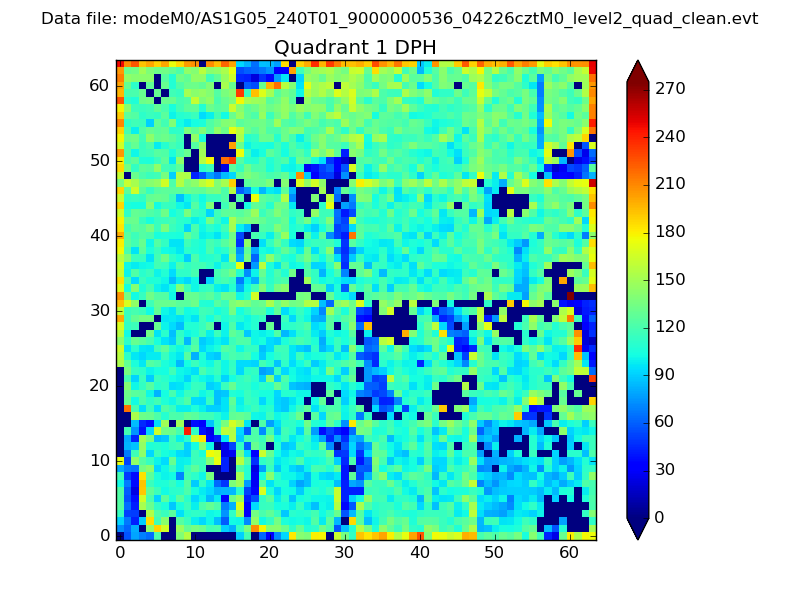
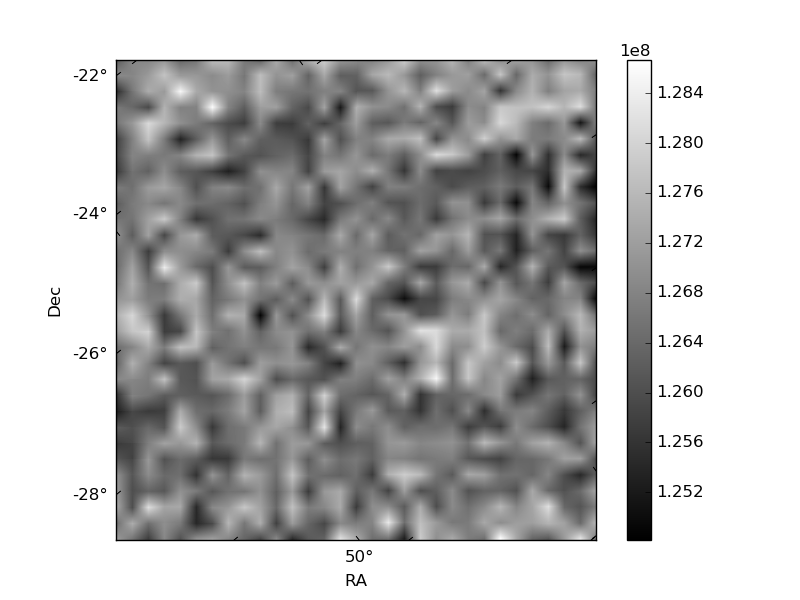
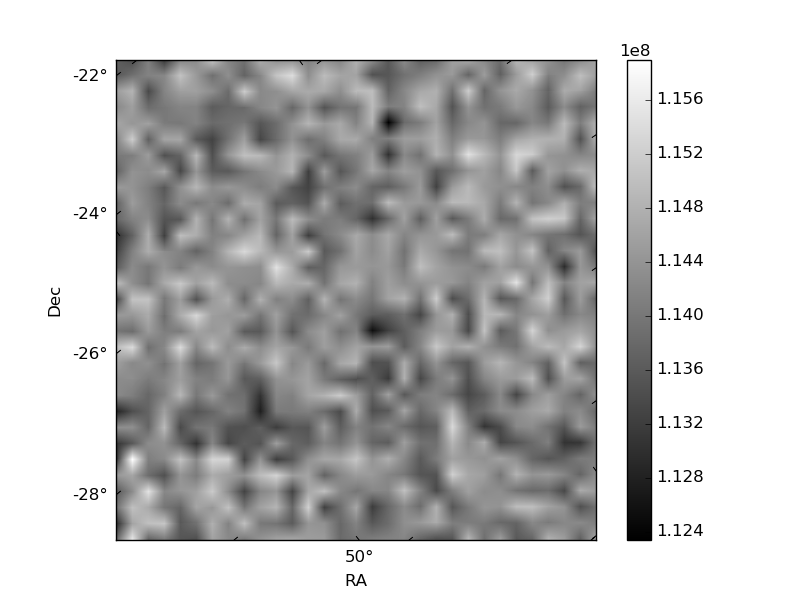
Histogram calculated using DETX and DETY for each event in the final _common_clean file
| Quadrant A |  |
 |
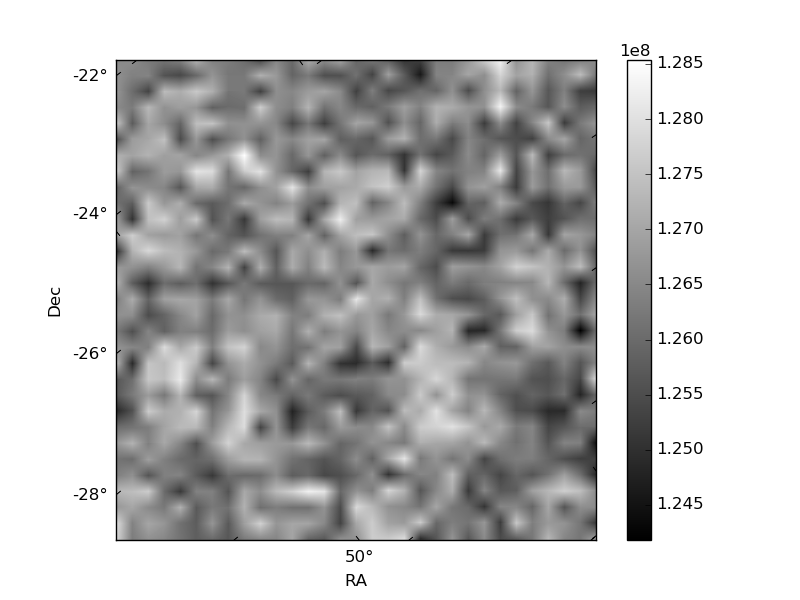
Quadrant B |
|---|---|---|---|
| Quadrant D |  |
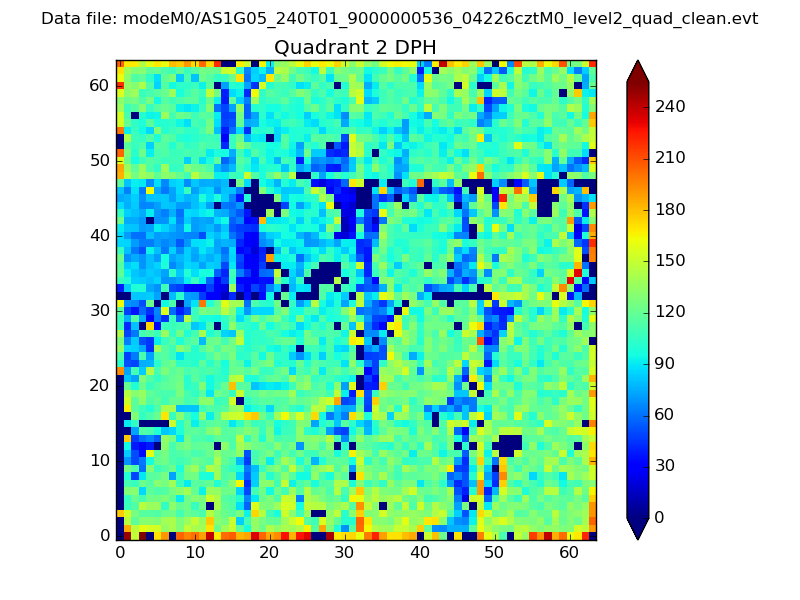 |
Quadrant C |
| Plot type | Count rate plots | Images |
|---|---|---|
| Comparison with Poisson distribution Blue bars denote a histogram of data divided into 1 sec bins. Red curve is a Poisson curve with rate = median count rate of data. |
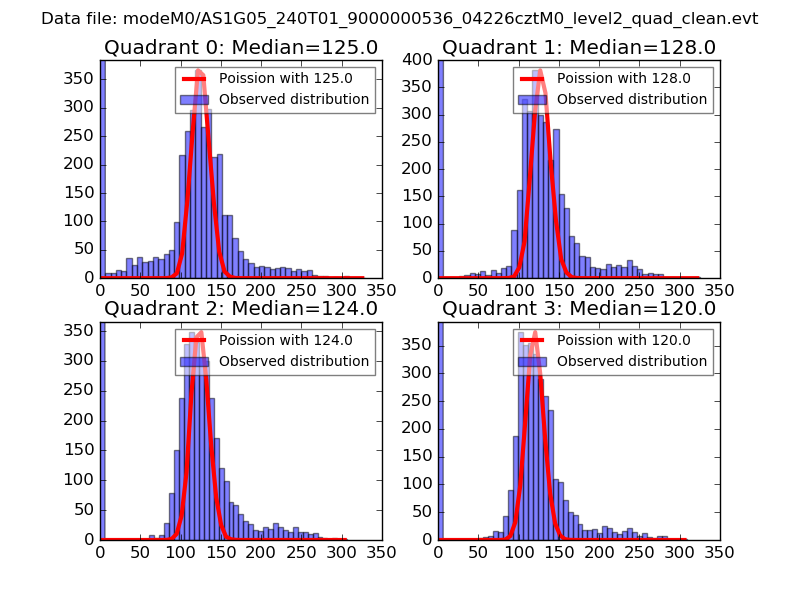 |
 |
| Quadrant-wise count rates Data is divided into 100 sec bins |
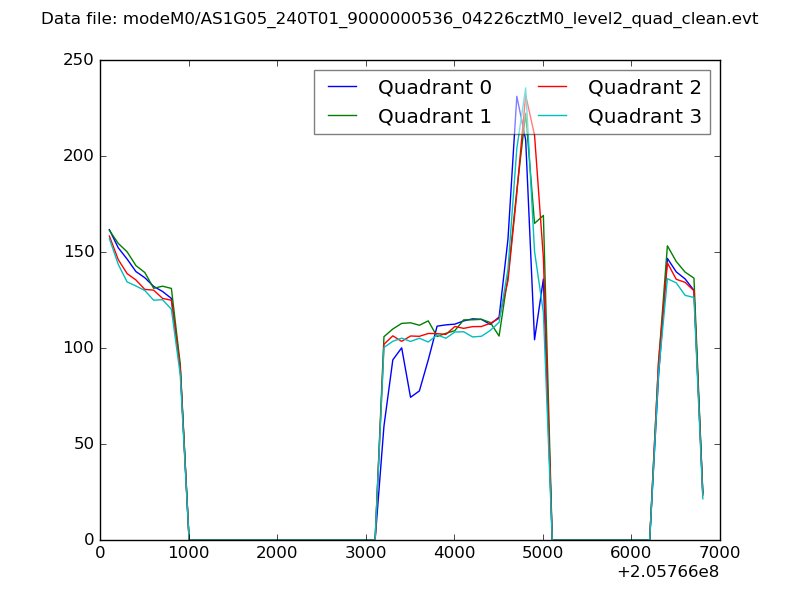 |
|
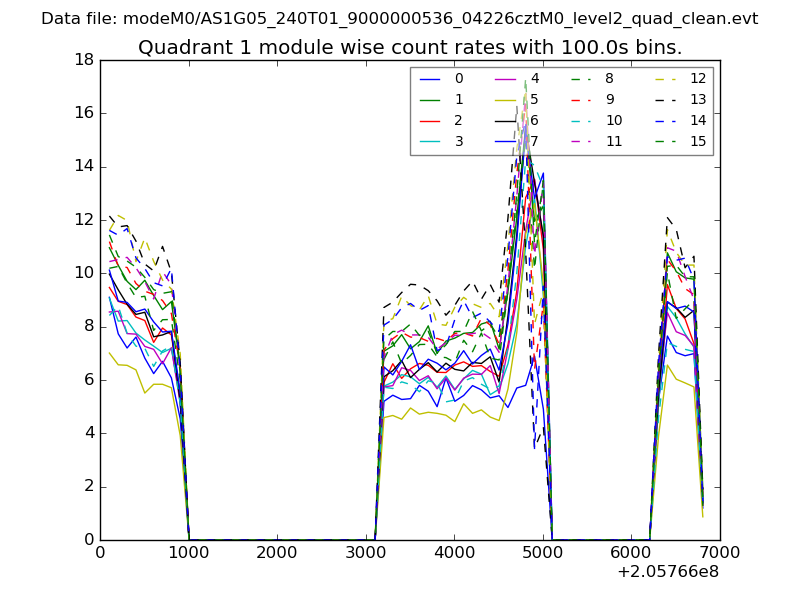
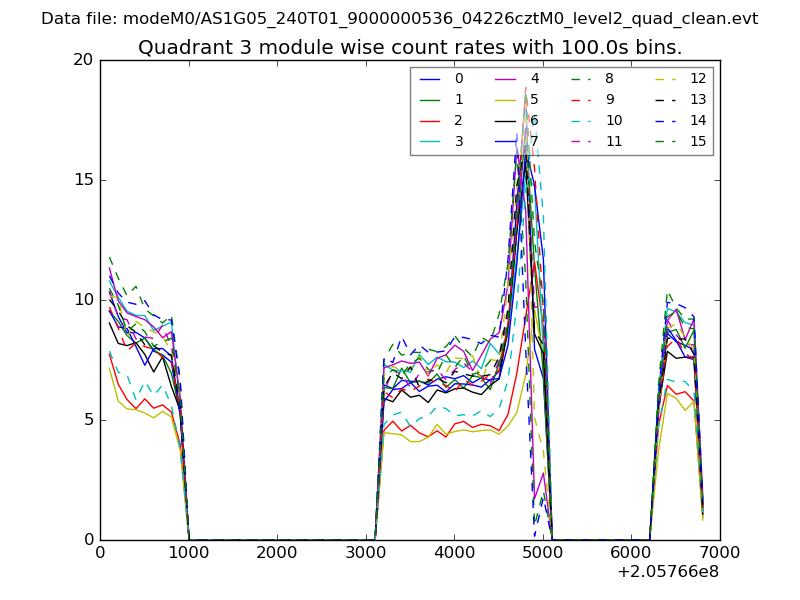
| Module-wise count rates for Quadrant A Data is divided into 100 sec bins |
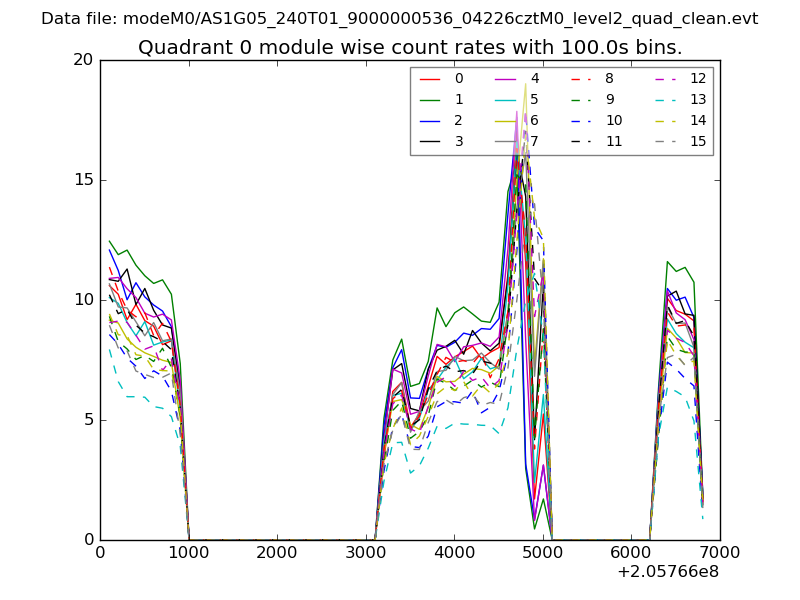 |
 |
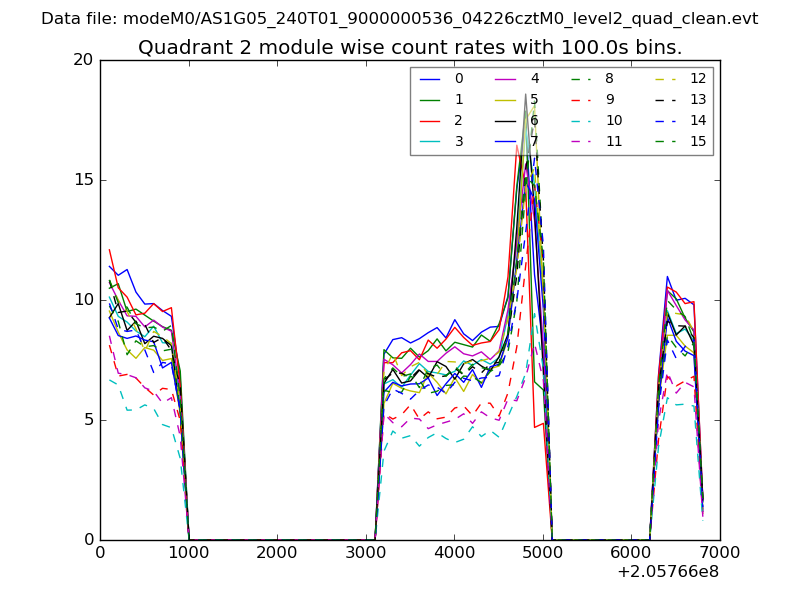
| Module-wise count rates for Quadrant B Data is divided into 100 sec bins |
 |
 |
| Module-wise count rates for Quadrant C Data is divided into 100 sec bins |
 |
 |
| Module-wise count rates for Quadrant D Data is divided into 100 sec bins |
 |
 |
| Parameter | Plot |
|---|---|
| CZT HV Monitor | 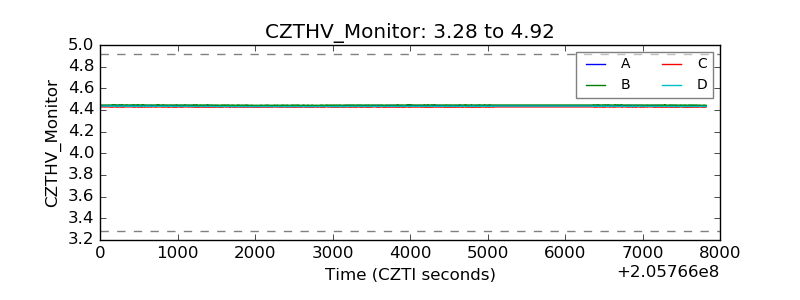 |
| D_VDD | 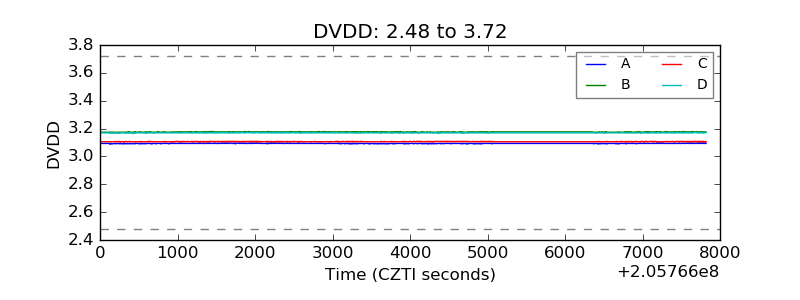 |
| Temperature 1 | 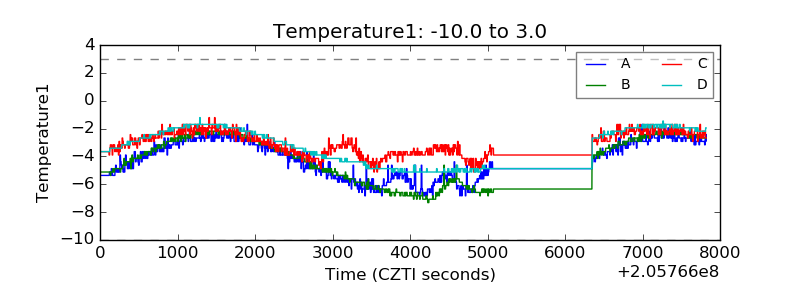 |
| Veto HV Monitor | 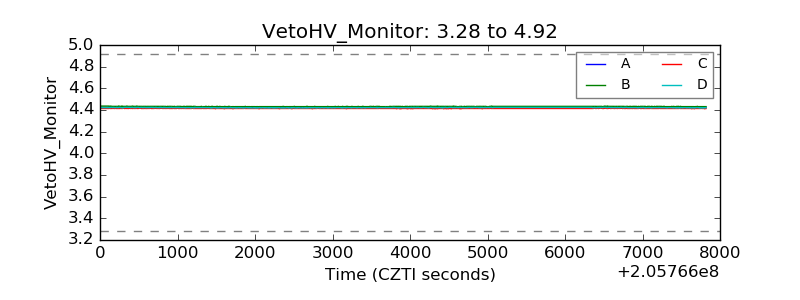 |
| Veto LLD | 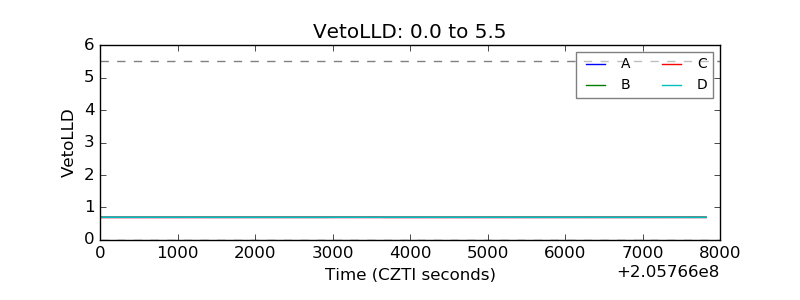 |
| Alpha Counter | 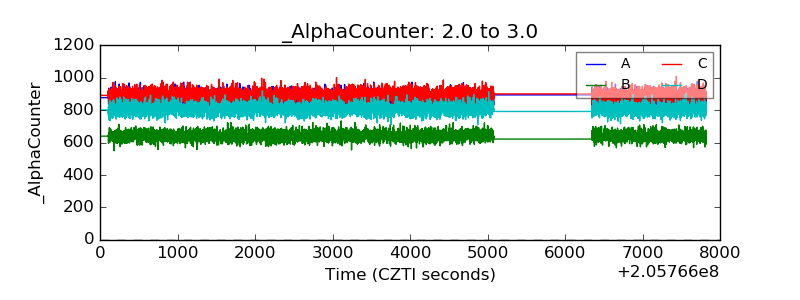 |
| _CPM_Rate | 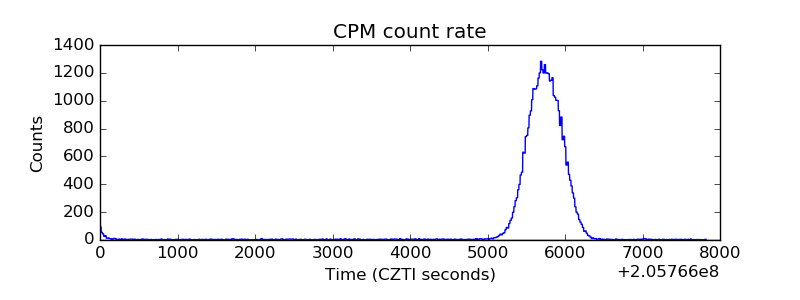 |
| CZT Counter | 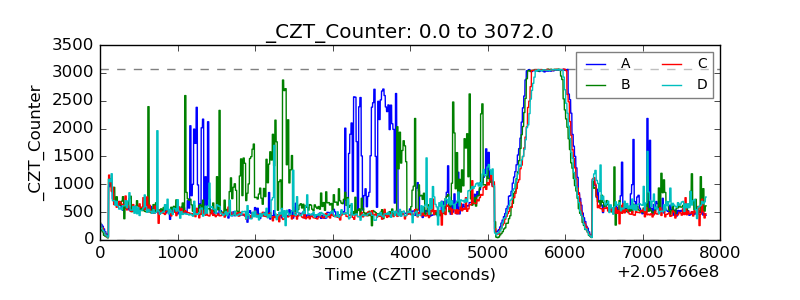 |
| +2.5 Volts monitor |  |
| +5 Volts monitor |  |
| _ROLL_ROT | 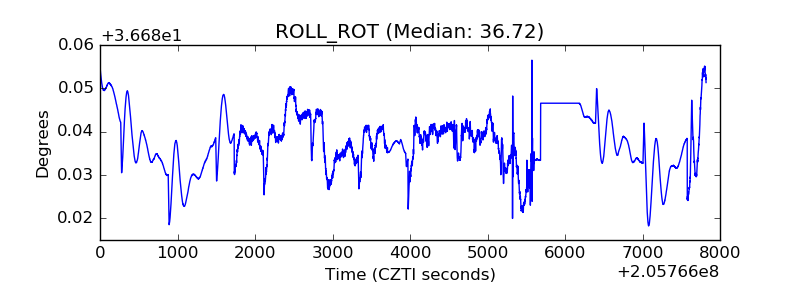 |
| _Roll_DEC | 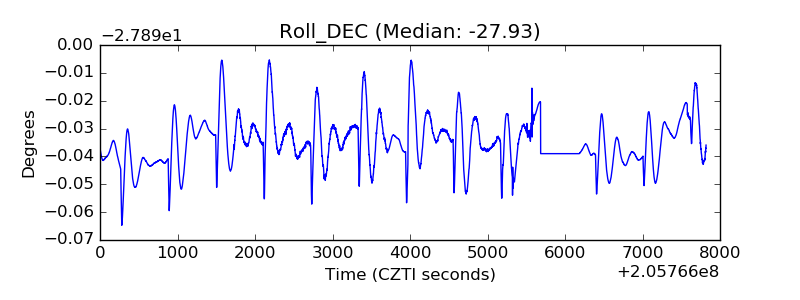 |
| _Roll_RA |  |
| Veto Counter | 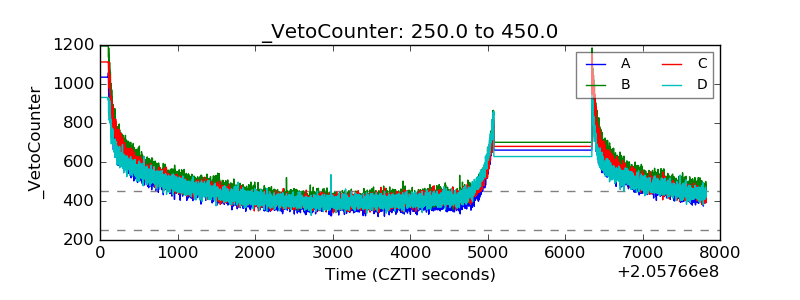 |