| Param | Original file | Final file |
|---|---|---|
| Filename | modeM0/AS1G05_240T01_9000000536_04227cztM0_level2.evt | modeM0/AS1G05_240T01_9000000536_04227cztM0_level2_quad_clean.evt |
| Size (bytes) | 493,632,000 | 58,403,520 |
| Size | 470.8 MB | 55.7 MB |
| Events in quadrant A | 3,833,686 | 335,457 |
| Events in quadrant B | 3,568,013 | 340,999 |
| Events in quadrant C | 3,137,194 | 327,706 |
| Events in quadrant D | 3,979,319 | 320,285 |
| Mode SS | |||
|---|---|---|---|
| Quadrant | BADHDUFLAG | Total packets | Discarded packets |
| A | 0 | 128 | 0 |
| B | 0 | 128 | 0 |
| C | 0 | 128 | 0 |
| D | 0 | 128 | 0 |
| Mode M9 | |||
|---|---|---|---|
| Quadrant | BADHDUFLAG | Total packets | Discarded packets |
| A | 0 | 14 | 0 |
| B | 0 | 14 | 0 |
| C | 0 | 14 | 0 |
| D | 0 | 15 | 0 |
| Mode M0 | |||
|---|---|---|---|
| Quadrant | BADHDUFLAG | Total packets | Discarded packets |
| A | 0 | 15408 | 3 |
| B | 0 | 14550 | 2 |
| C | 0 | 13235 | 2 |
| D | 0 | 16438 | 2 |
| Quadrant | Total seconds | Saturated seconds | Saturation percentage |
|---|---|---|---|
| A | 6361 | 286 | 4.496148% |
| B | 6361 | 166 | 2.609653% |
| C | 6361 | 91 | 1.430593% |
| D | 6361 | 112 | 1.760729% |
Noise dominated data is calculated using 1-second bins in cleaned event files. If a bin has >2000 counts, and if more than 50% of those come from <1% of pixels, then it is considered to be noise-dominated and hence unusable.
| Quadrant | # 1 sec bins | Bins with >0 counts | Bins with >2000 counts | High rate bins dominated by noise | Noise dominated (total time) | Noise dominated (detector-on time) | Marked lightcurve |
|---|---|---|---|---|---|---|---|
| A | 7636 | 6362 | 97 | 97 | 1.27% | 1.52% |  |
| B | 7636 | 6362 | 15 | 15 | 0.20% | 0.24% | 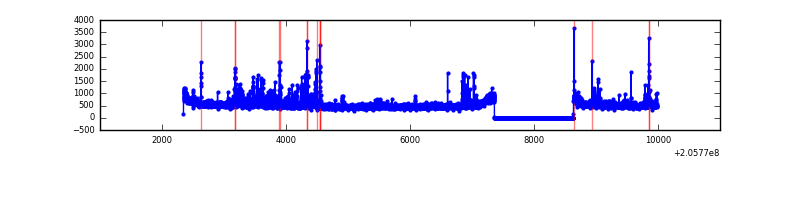 |
| C | 7636 | 6362 | 0 | 0 | 0.00% | 0.00% | 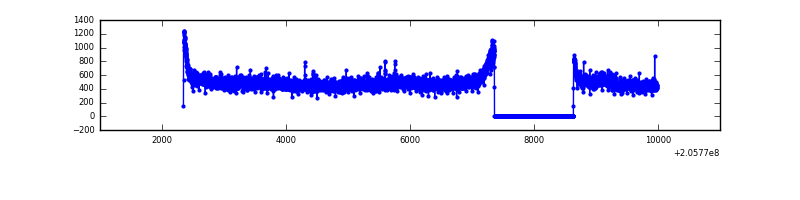 |
| D | 7636 | 6362 | 4 | 4 | 0.05% | 0.06% |  |
Top three noisy pixels from each quadrant. If the there are fewer than three noisy pixels in the level2.evt file, extra rows are filled as -1
| Pixel properties | Quadrant properties | ||||||
|---|---|---|---|---|---|---|---|
| Quadrant | DetID | PixID | Counts | Sigma | Mean | Median | Sigma |
| A | 0 | 50 | 655038 | 3999.42 | 805 | 786 | 163.6 |
| A | 15 | 234 | 37043 | 221.64 | 805 | 786 | 163.6 |
| A | 8 | 15 | 37040 | 221.62 | 805 | 786 | 163.6 |
| B | 3 | 0 | 161629 | 1029.39 | 816 | 802 | 156.2 |
| B | 14 | 167 | 142836 | 909.1 | 816 | 802 | 156.2 |
| B | 4 | 48 | 29980 | 186.76 | 816 | 802 | 156.2 |
| C | 9 | 144 | 106415 | 588.92 | 775 | 778 | 179.4 |
| C | 13 | 61 | 6361 | 31.13 | 775 | 778 | 179.4 |
| C | 14 | 67 | 3687 | 16.22 | 775 | 778 | 179.4 |
| D | 11 | 132 | 883488 | 4701.6 | 780 | 759 | 187.8 |
| D | 7 | 39 | 41810 | 218.65 | 780 | 759 | 187.8 |
| D | 13 | 239 | 37681 | 196.65 | 780 | 759 | 187.8 |
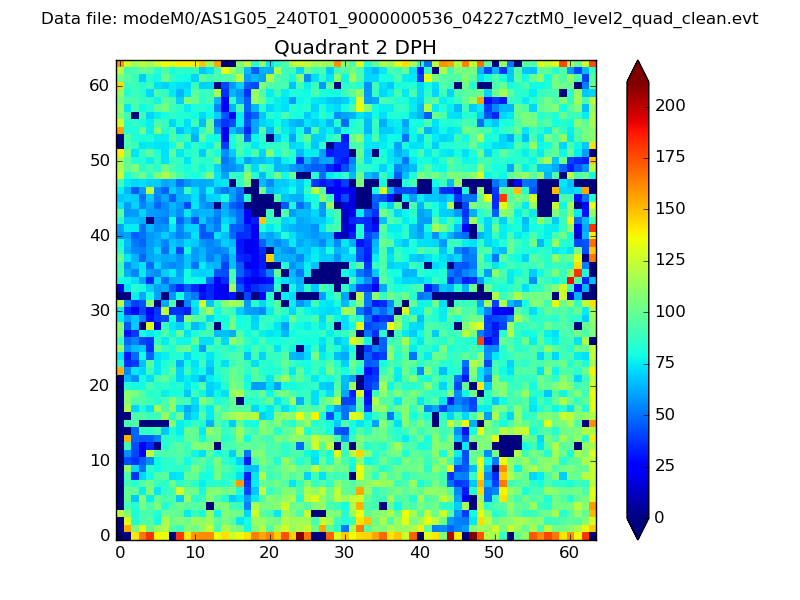
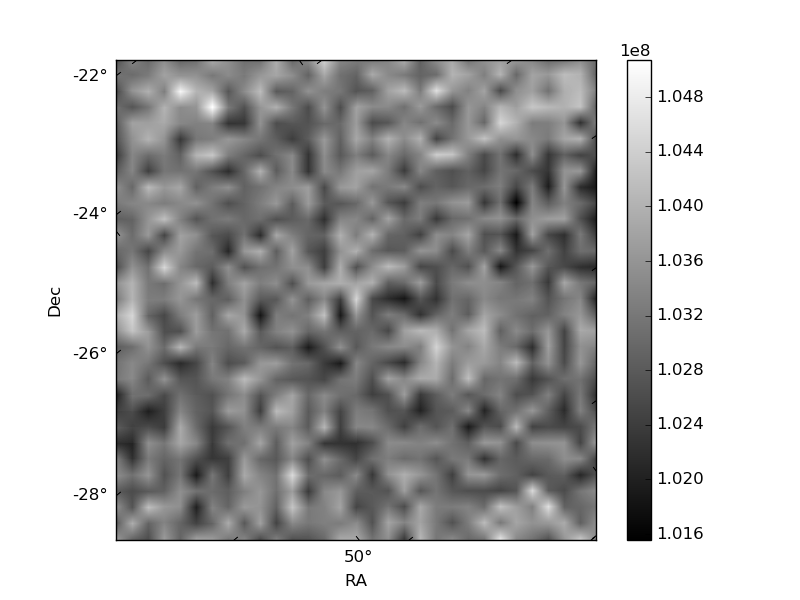
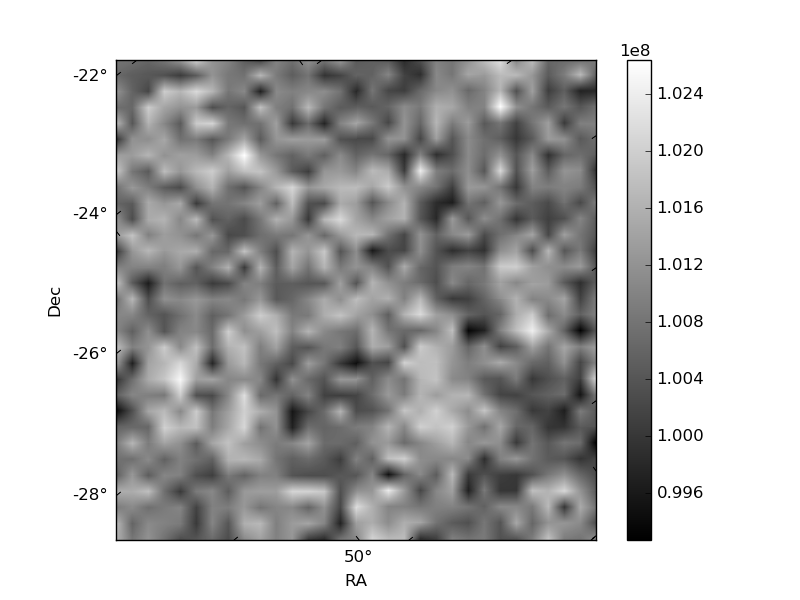
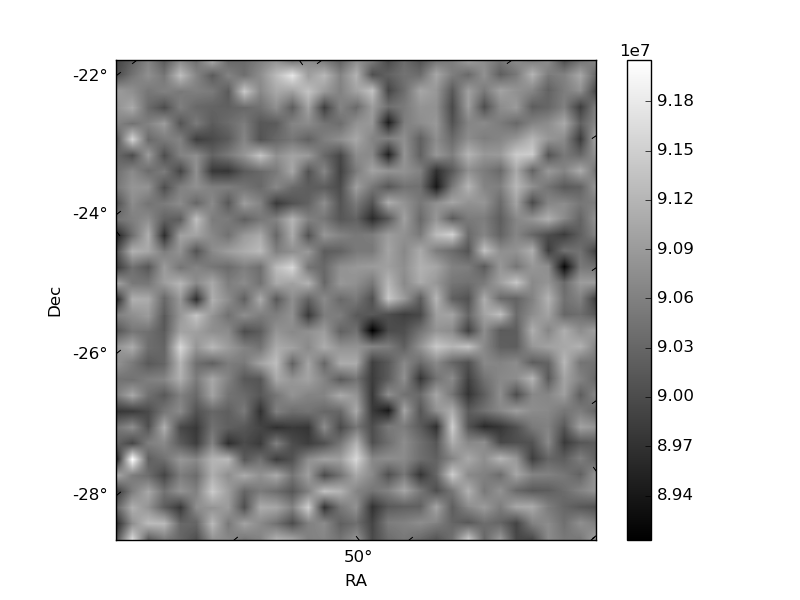
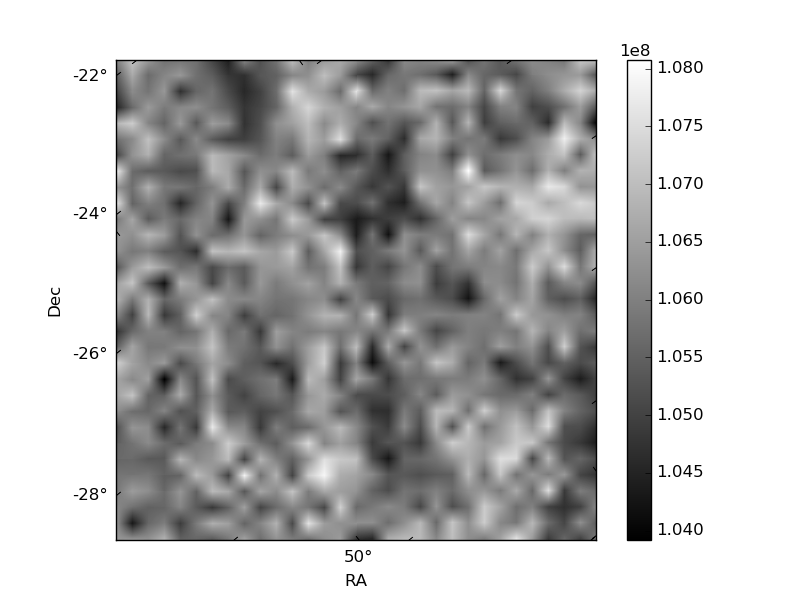
Histogram calculated using DETX and DETY for each event in the final _common_clean file
| Quadrant A | 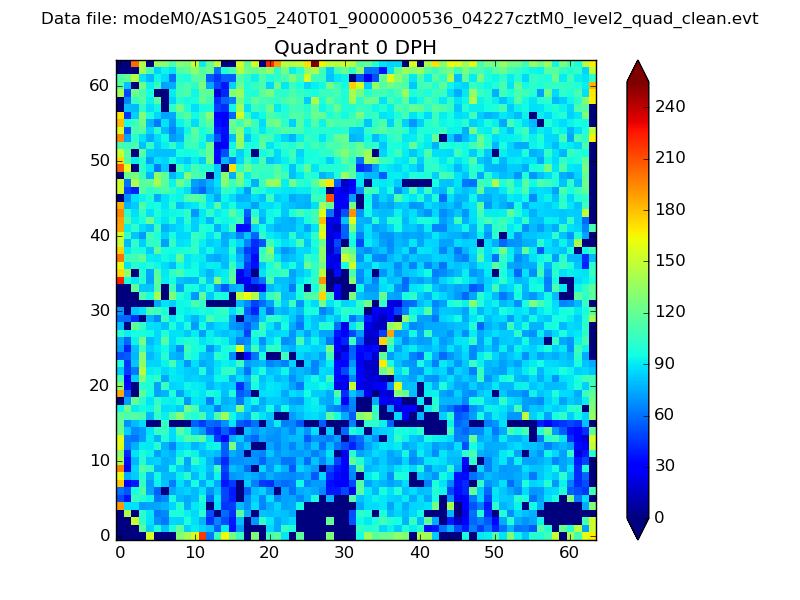 |
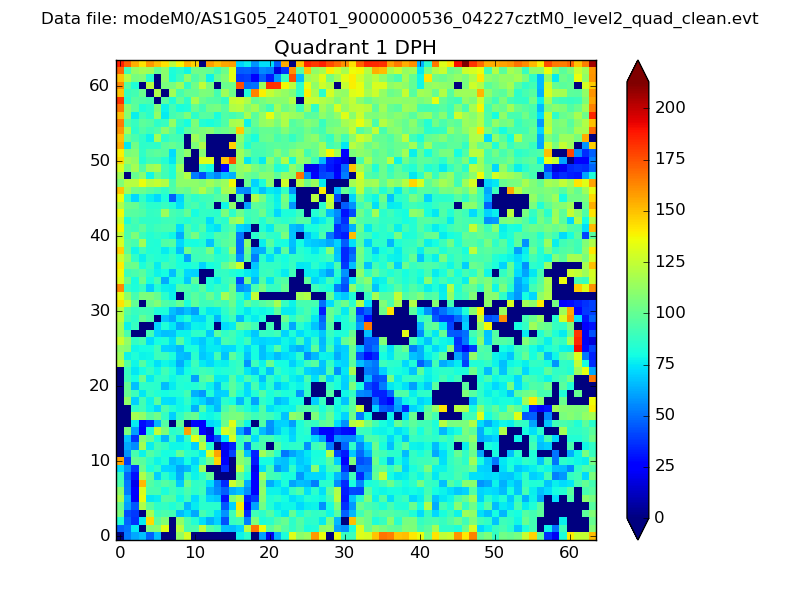 |
Quadrant B |
|---|---|---|---|
| Quadrant D | 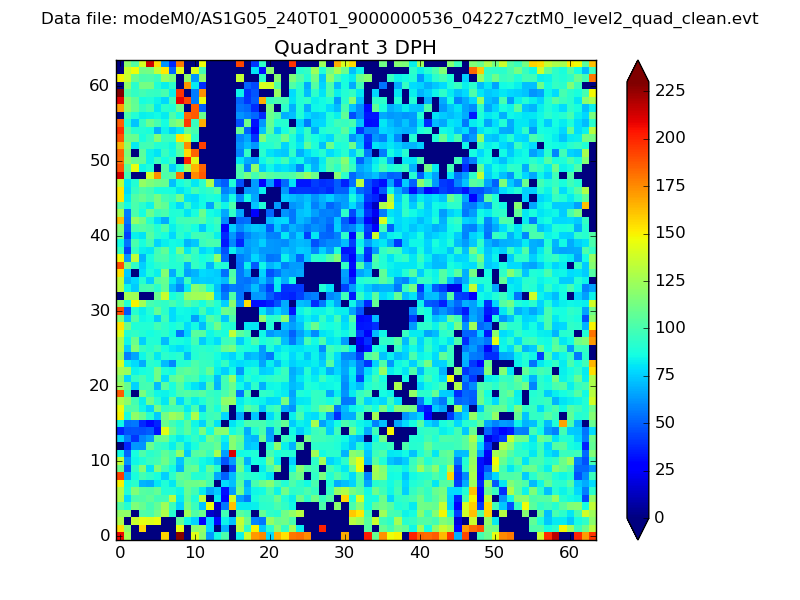 |
 |
Quadrant C |
| Plot type | Count rate plots | Images |
|---|---|---|
| Comparison with Poisson distribution Blue bars denote a histogram of data divided into 1 sec bins. Red curve is a Poisson curve with rate = median count rate of data. |
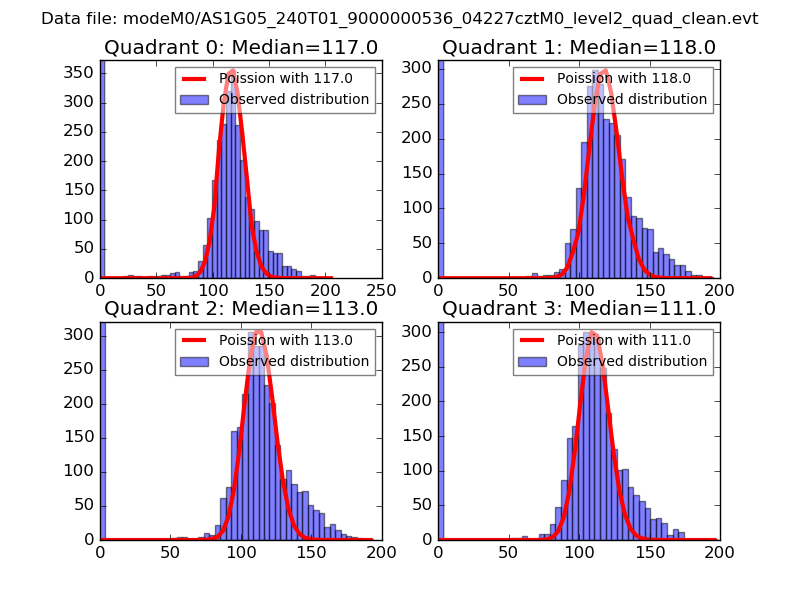 |
 |
| Quadrant-wise count rates Data is divided into 100 sec bins |
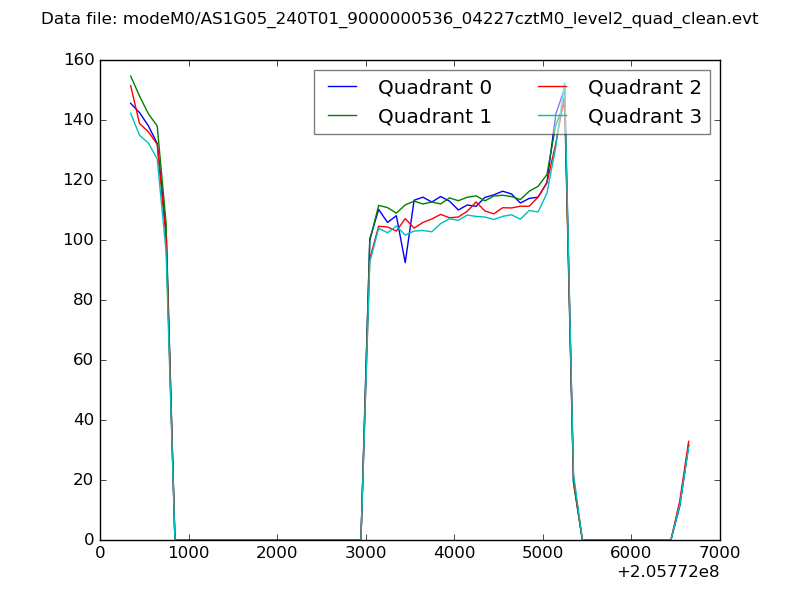 |
|
| Module-wise count rates for Quadrant A Data is divided into 100 sec bins |
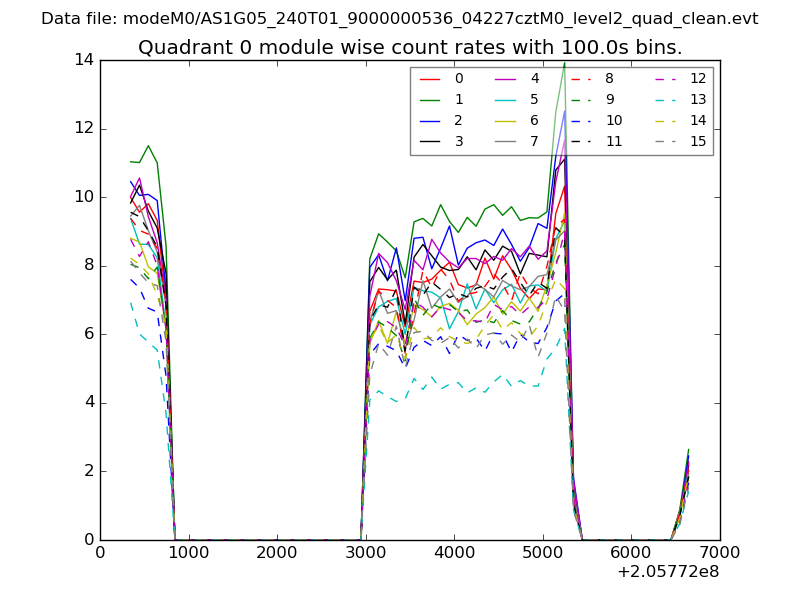 |
 |
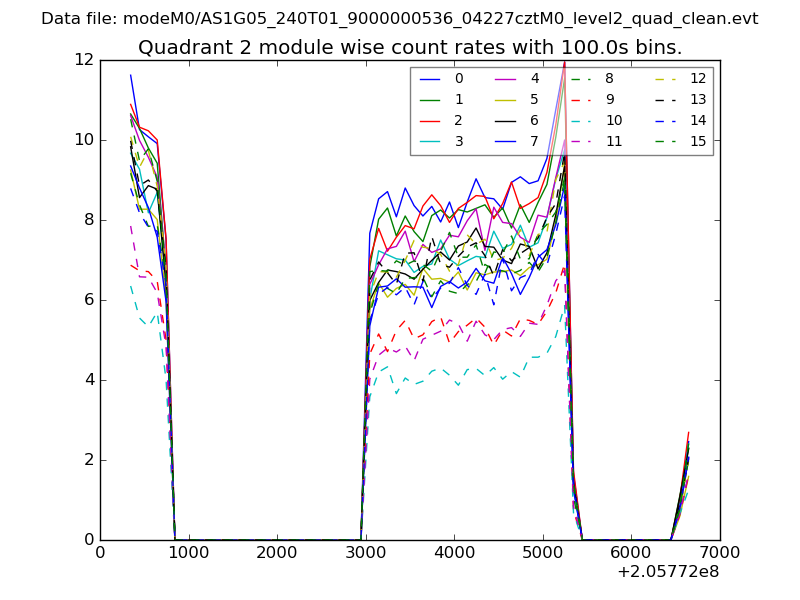
| Module-wise count rates for Quadrant B Data is divided into 100 sec bins |
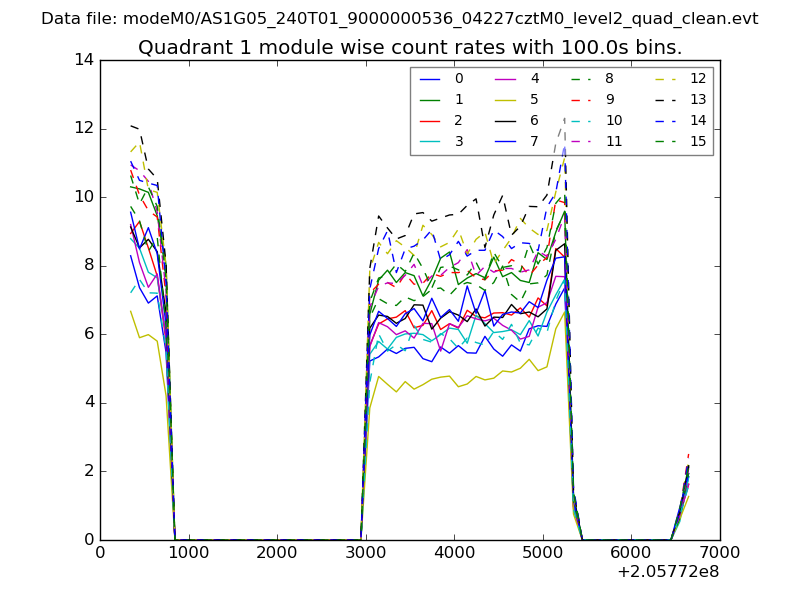 |
 |
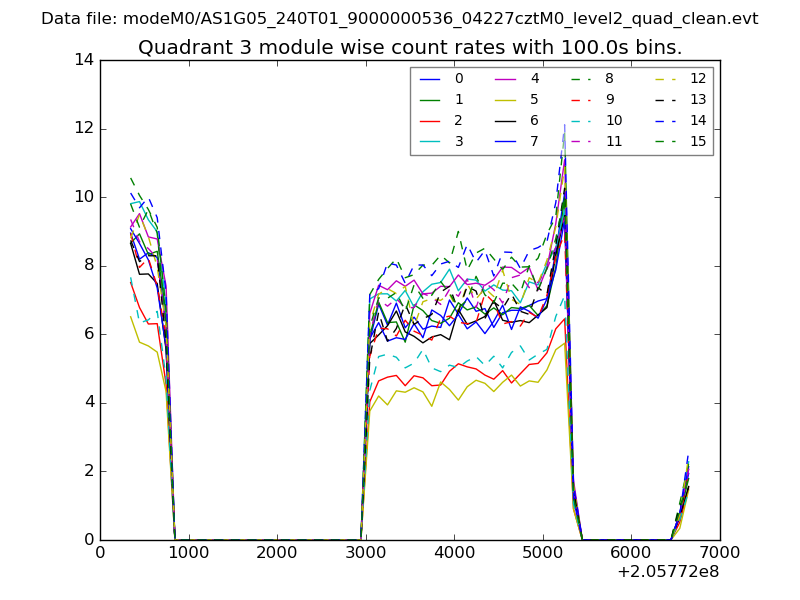
| Module-wise count rates for Quadrant C Data is divided into 100 sec bins |
 |
 |
| Module-wise count rates for Quadrant D Data is divided into 100 sec bins |
 |
 |
| Parameter | Plot |
|---|---|
| CZT HV Monitor | 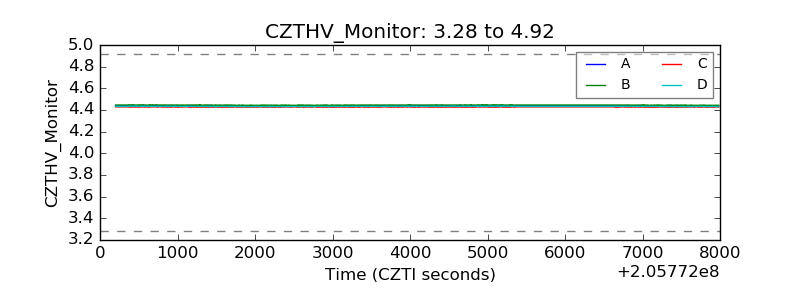 |
| D_VDD | 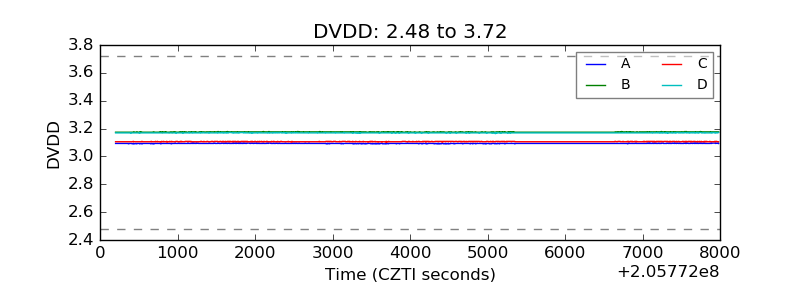 |
| Temperature 1 |  |
| Veto HV Monitor | 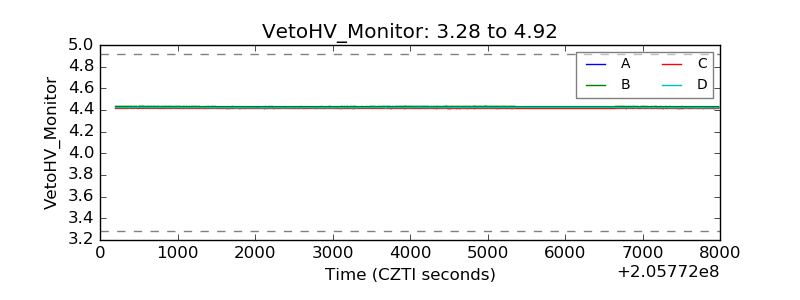 |
| Veto LLD | 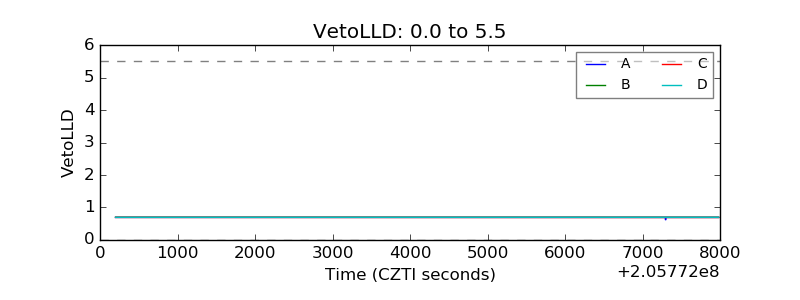 |
| Alpha Counter | 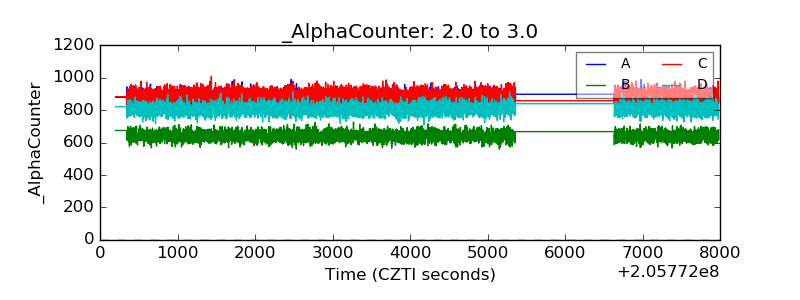 |
| _CPM_Rate | 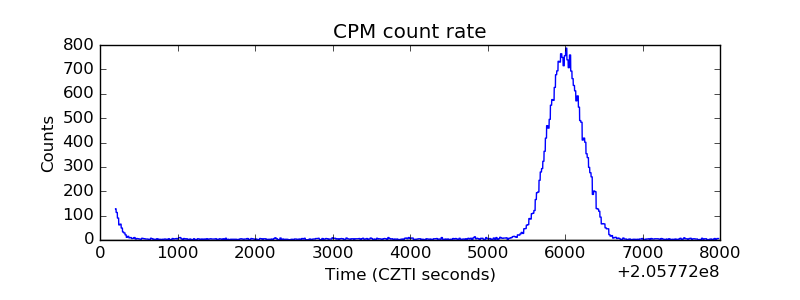 |
| CZT Counter | 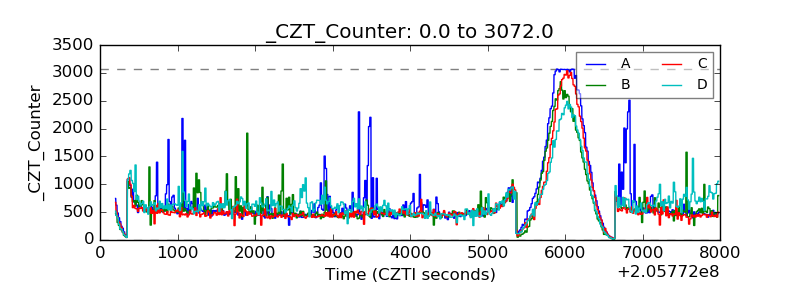 |
| +2.5 Volts monitor |  |
| +5 Volts monitor |  |
| _ROLL_ROT | 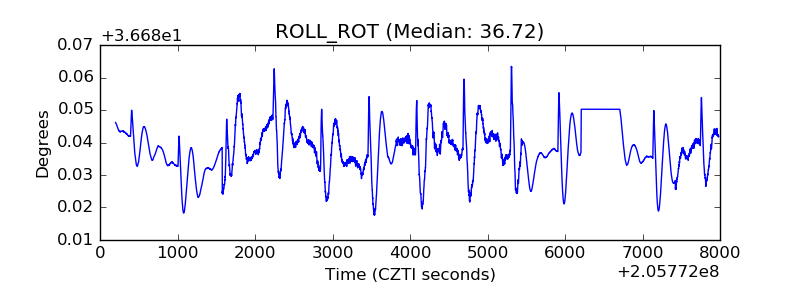 |
| _Roll_DEC | 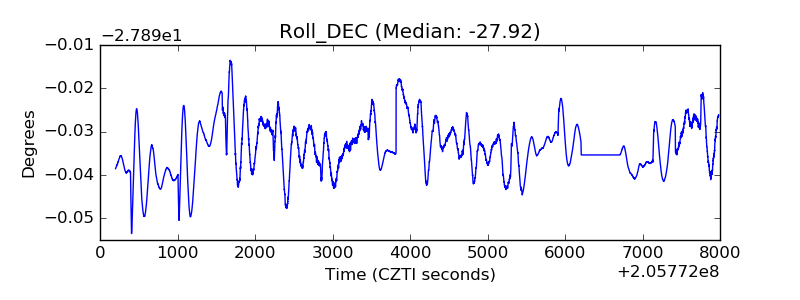 |
| _Roll_RA | 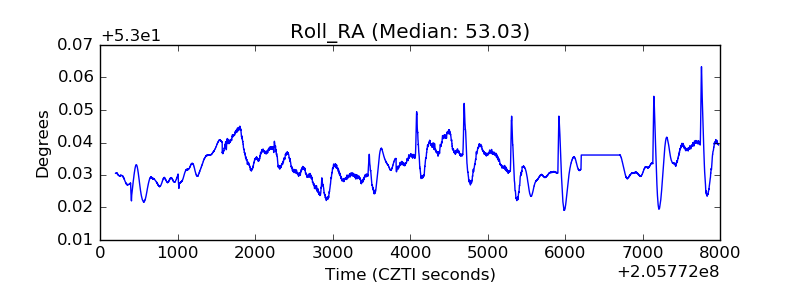 |
| Veto Counter | 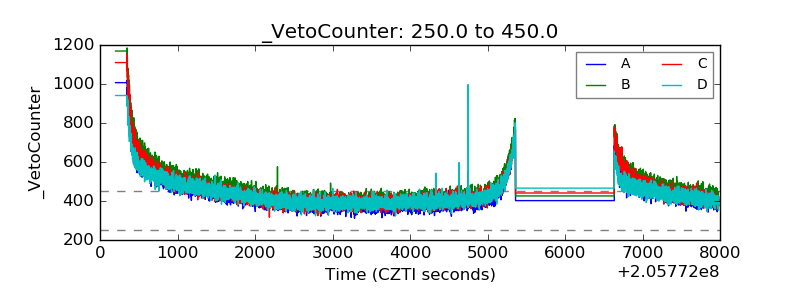 |