| Param | Original file | Final file |
|---|---|---|
| Filename | modeM0/AS1G05_240T01_9000000536_04228cztM0_level2.evt | modeM0/AS1G05_240T01_9000000536_04228cztM0_level2_quad_clean.evt |
| Size (bytes) | 528,111,360 | 52,824,960 |
| Size | 503.6 MB | 50.4 MB |
| Events in quadrant A | 5,300,139 | 248,036 |
| Events in quadrant B | 3,353,064 | 313,081 |
| Events in quadrant C | 2,914,086 | 302,198 |
| Events in quadrant D | 3,996,921 | 293,523 |
| Mode SS | |||
|---|---|---|---|
| Quadrant | BADHDUFLAG | Total packets | Discarded packets |
| A | 0 | 128 | 0 |
| B | 0 | 128 | 0 |
| C | 0 | 128 | 0 |
| D | 0 | 128 | 0 |
| Mode M9 | |||
|---|---|---|---|
| Quadrant | BADHDUFLAG | Total packets | Discarded packets |
| A | 0 | 11 | 0 |
| B | 0 | 11 | 0 |
| C | 0 | 11 | 0 |
| D | 0 | 11 | 0 |
| Mode M0 | |||
|---|---|---|---|
| Quadrant | BADHDUFLAG | Total packets | Discarded packets |
| A | 0 | 19920 | 3 |
| B | 0 | 14008 | 2 |
| C | 0 | 12962 | 2 |
| D | 0 | 16523 | 2 |
| Quadrant | Total seconds | Saturated seconds | Saturation percentage |
|---|---|---|---|
| A | 6332 | 975 | 15.397979% |
| B | 6332 | 126 | 1.989893% |
| C | 6332 | 37 | 0.584334% |
| D | 6332 | 63 | 0.994946% |
Noise dominated data is calculated using 1-second bins in cleaned event files. If a bin has >2000 counts, and if more than 50% of those come from <1% of pixels, then it is considered to be noise-dominated and hence unusable.
| Quadrant | # 1 sec bins | Bins with >0 counts | Bins with >2000 counts | High rate bins dominated by noise | Noise dominated (total time) | Noise dominated (detector-on time) | Marked lightcurve |
|---|---|---|---|---|---|---|---|
| A | 7467 | 6334 | 792 | 792 | 10.61% | 12.50% | 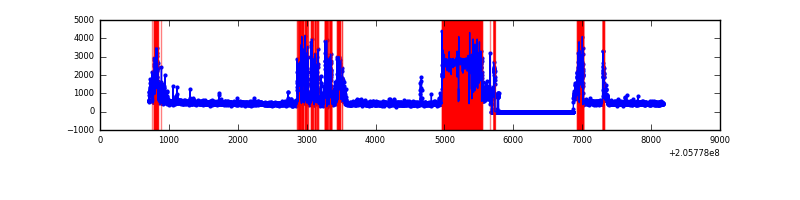 |
| B | 7467 | 6334 | 48 | 48 | 0.64% | 0.76% | 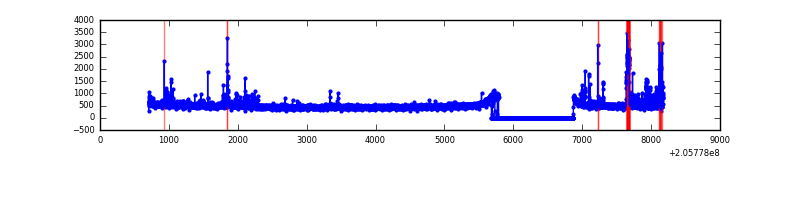 |
| C | 7467 | 6335 | 0 | 0 | 0.00% | 0.00% | 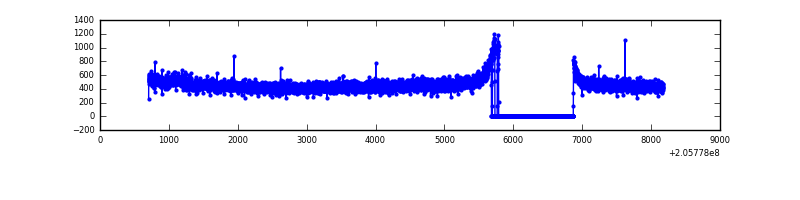 |
| D | 7467 | 6335 | 6 | 6 | 0.08% | 0.09% | 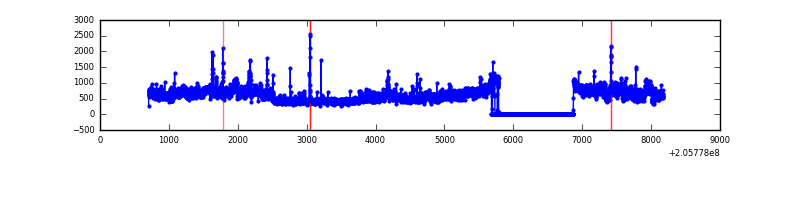 |
Top three noisy pixels from each quadrant. If the there are fewer than three noisy pixels in the level2.evt file, extra rows are filled as -1
| Pixel properties | Quadrant properties | ||||||
|---|---|---|---|---|---|---|---|
| Quadrant | DetID | PixID | Counts | Sigma | Mean | Median | Sigma |
| A | 12 | 247 | 1780866 | 12420.72 | 699 | 683 | 143.3 |
| A | 0 | 50 | 730567 | 5092.56 | 699 | 683 | 143.3 |
| A | 15 | 234 | 81441 | 563.47 | 699 | 683 | 143.3 |
| B | 3 | 0 | 226266 | 1518.62 | 775 | 758 | 148.5 |
| B | 14 | 167 | 69634 | 463.82 | 775 | 758 | 148.5 |
| B | 4 | 81 | 15009 | 95.97 | 775 | 758 | 148.5 |
| C | 9 | 144 | 24490 | 137.86 | 737 | 741 | 172.3 |
| C | 13 | 61 | 6253 | 32.0 | 737 | 741 | 172.3 |
| C | 10 | 65 | 5643 | 28.46 | 737 | 741 | 172.3 |
| D | 11 | 132 | 1051755 | 5855.28 | 739 | 718 | 179.5 |
| D | 13 | 72 | 35904 | 196.02 | 739 | 718 | 179.5 |
| D | 2 | 31 | 25101 | 135.84 | 739 | 718 | 179.5 |
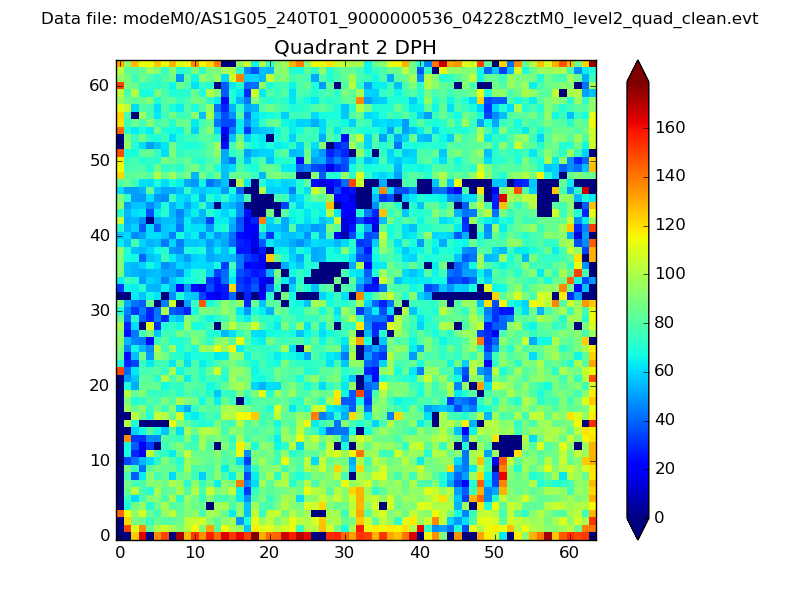
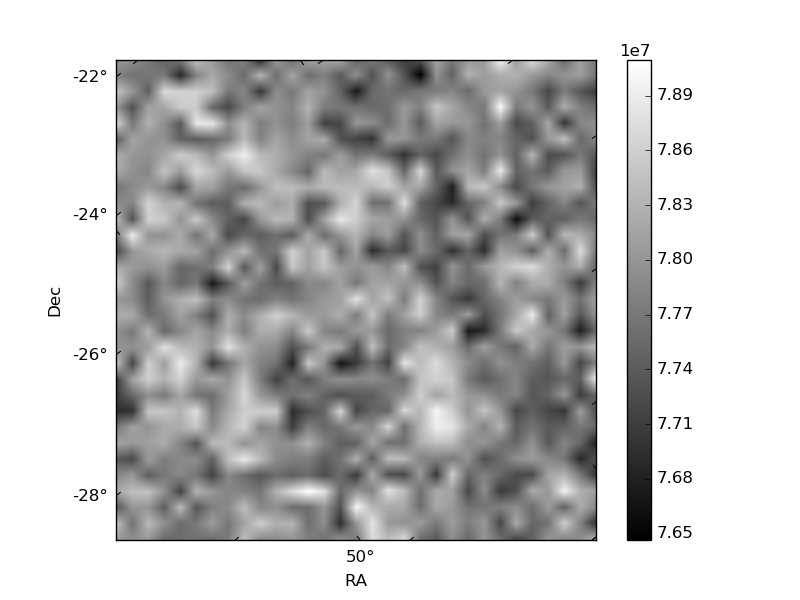
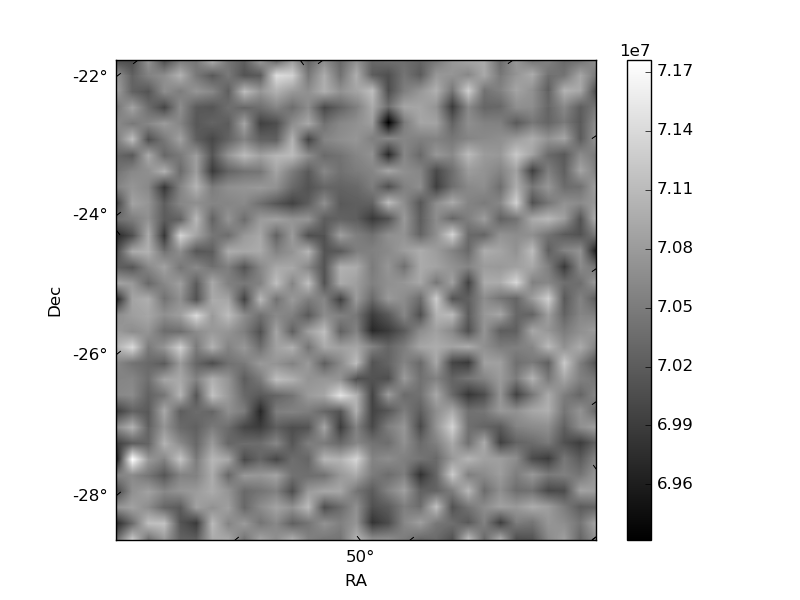
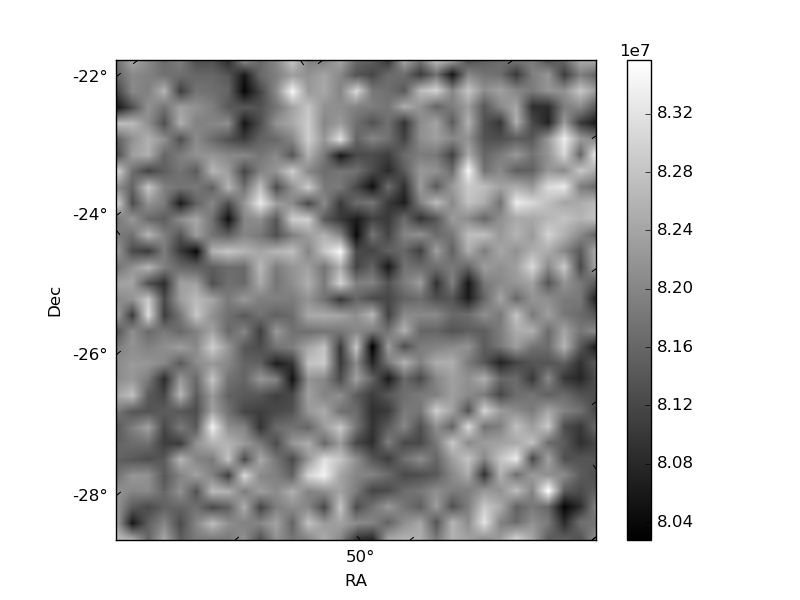
Histogram calculated using DETX and DETY for each event in the final _common_clean file
| Quadrant A | 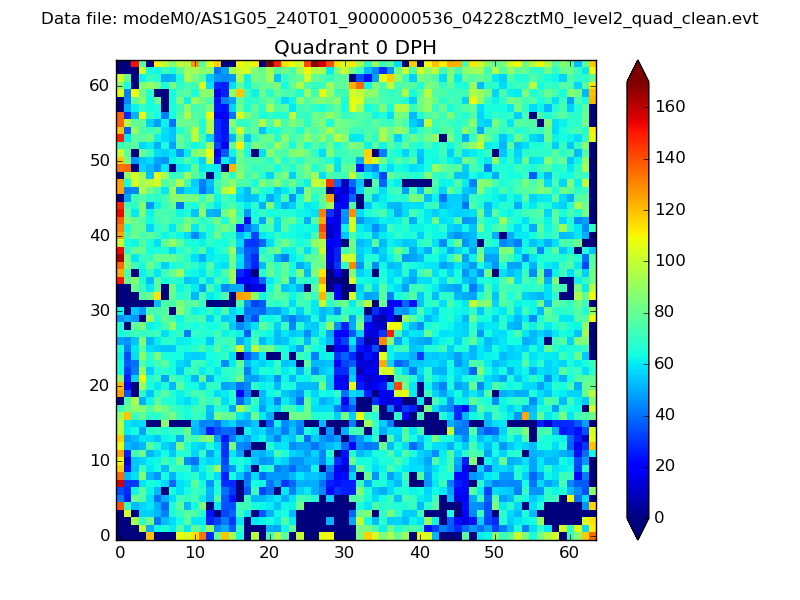 |
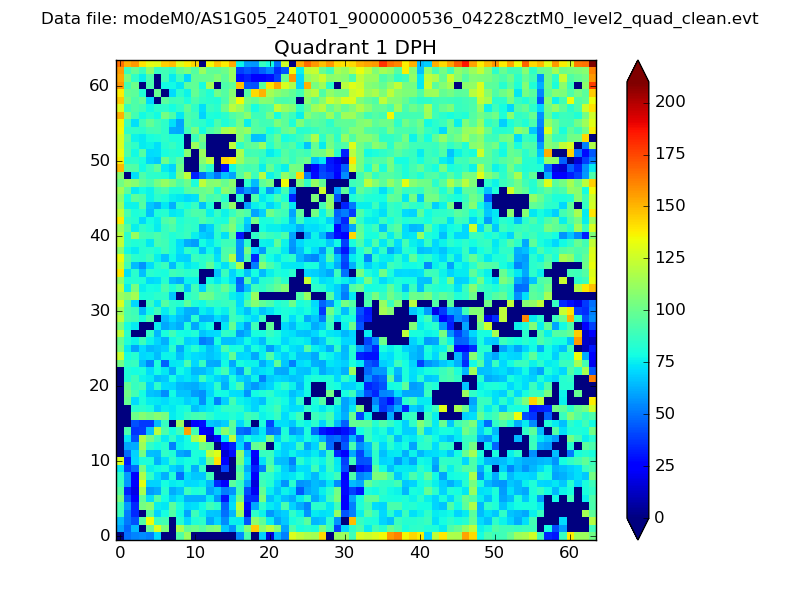 |
Quadrant B |
|---|---|---|---|
| Quadrant D | 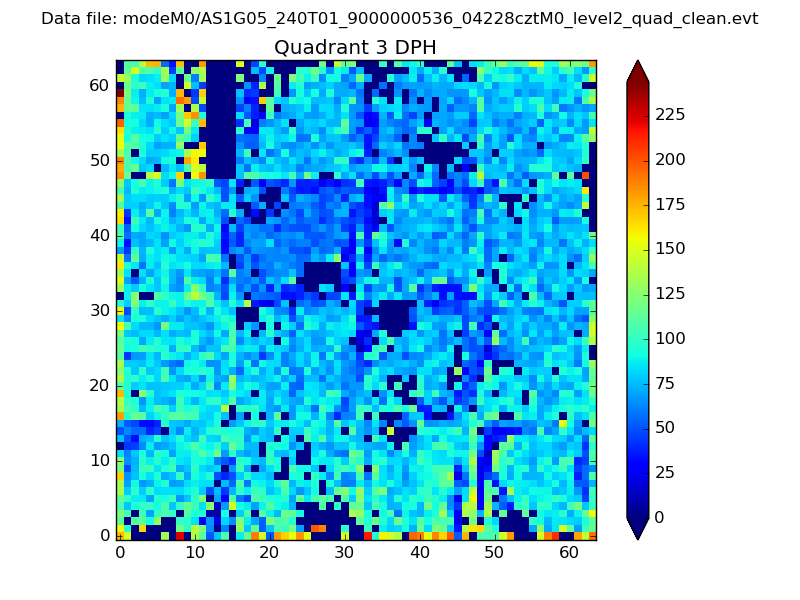 |
 |
Quadrant C |
| Plot type | Count rate plots | Images |
|---|---|---|
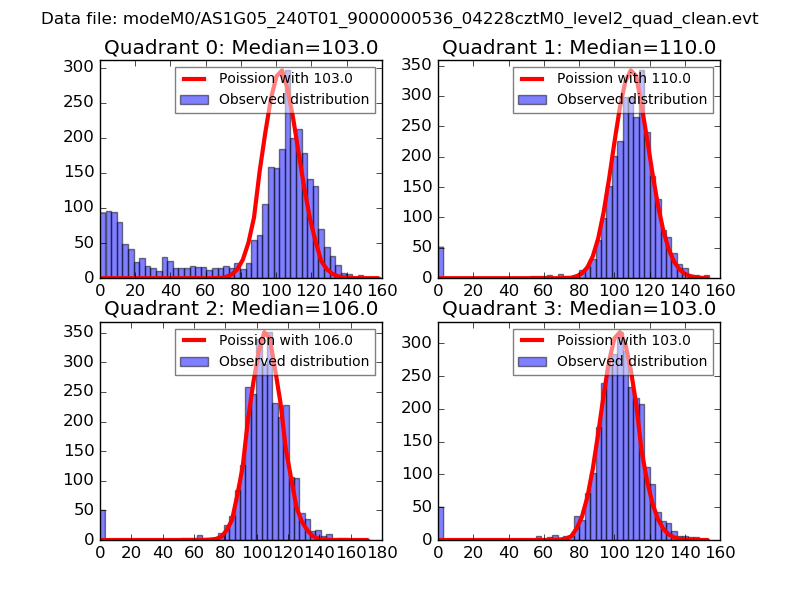
| Comparison with Poisson distribution Blue bars denote a histogram of data divided into 1 sec bins. Red curve is a Poisson curve with rate = median count rate of data. |
 |
 |
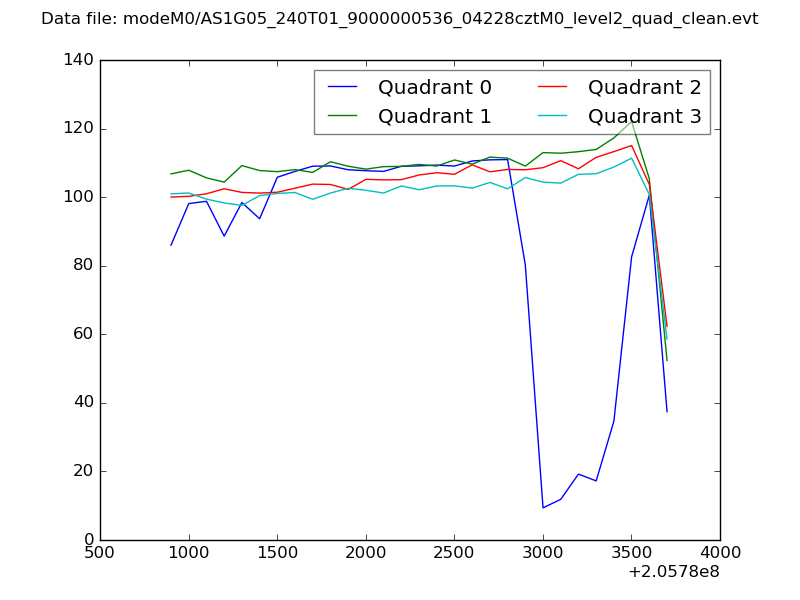
| Quadrant-wise count rates Data is divided into 100 sec bins |
 |
|
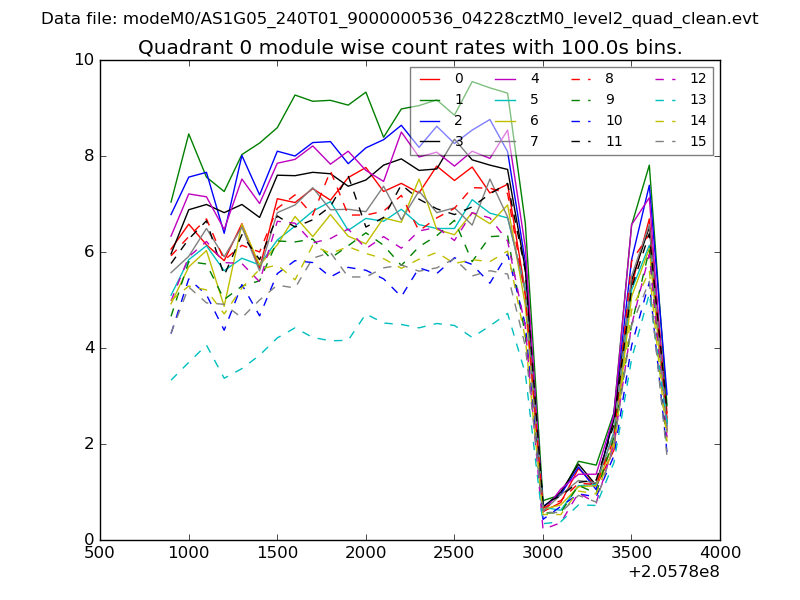
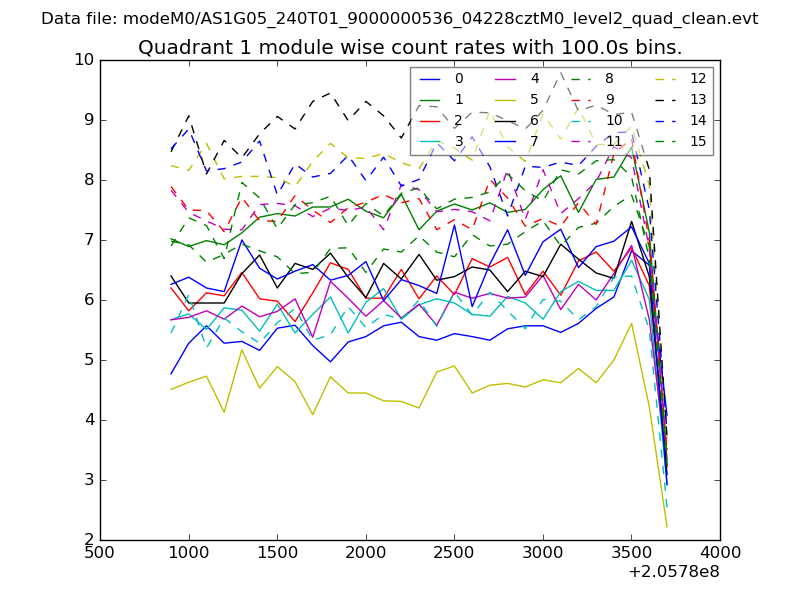
| Module-wise count rates for Quadrant A Data is divided into 100 sec bins |
 |
 |
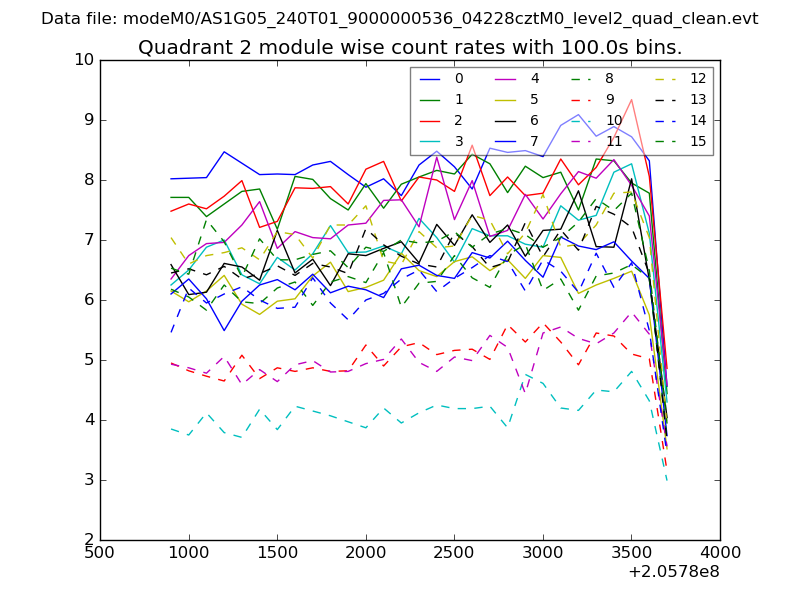
| Module-wise count rates for Quadrant B Data is divided into 100 sec bins |
 |
 |
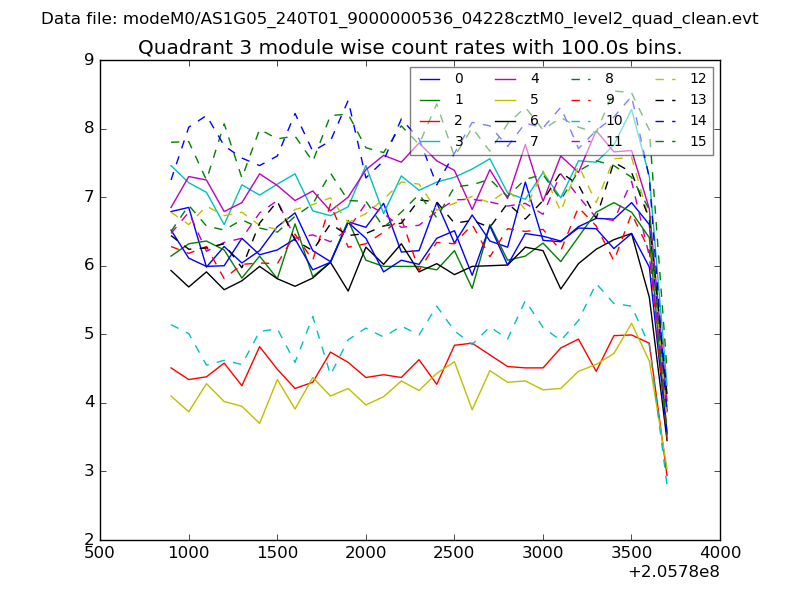
| Module-wise count rates for Quadrant C Data is divided into 100 sec bins |
 |
 |
| Module-wise count rates for Quadrant D Data is divided into 100 sec bins |
 |
 |
| Parameter | Plot |
|---|---|
| CZT HV Monitor | 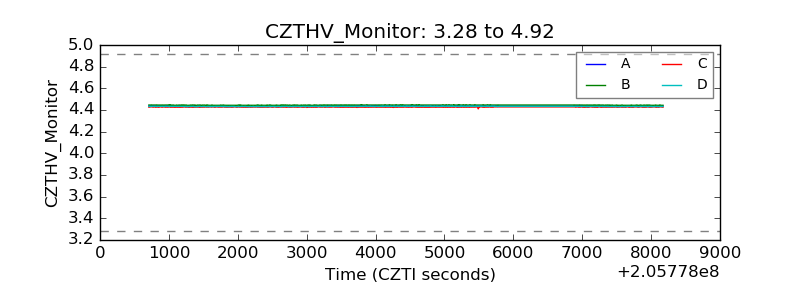 |
| D_VDD | 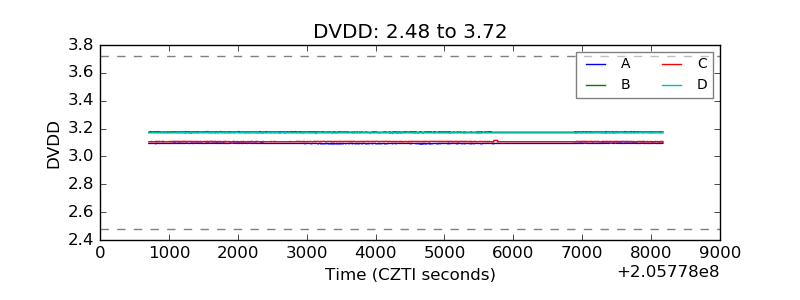 |
| Temperature 1 | 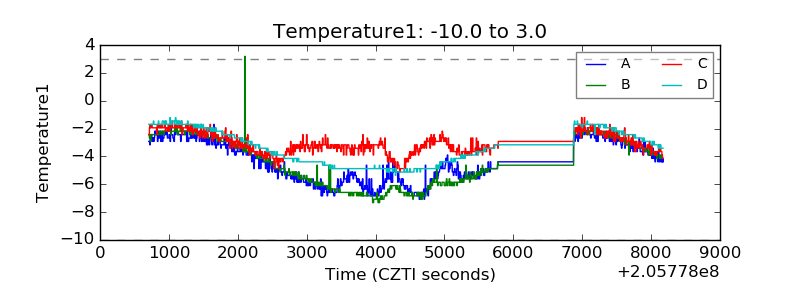 |
| Veto HV Monitor | 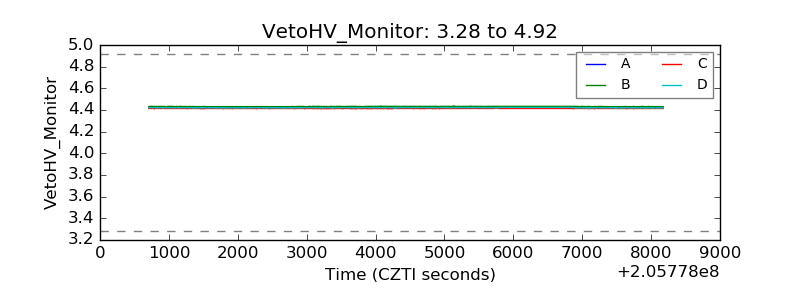 |
| Veto LLD | 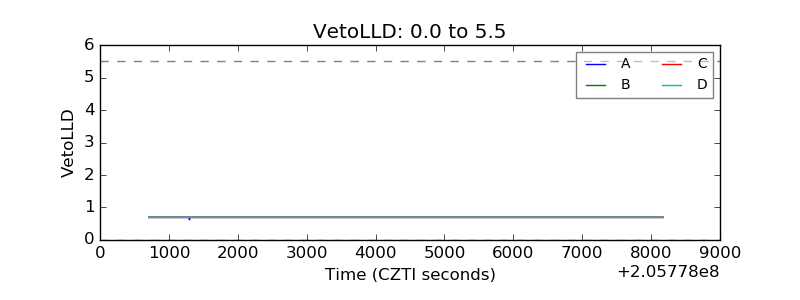 |
| Alpha Counter | 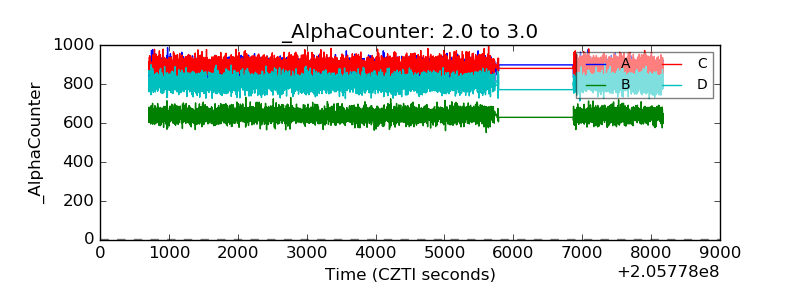 |
| _CPM_Rate | 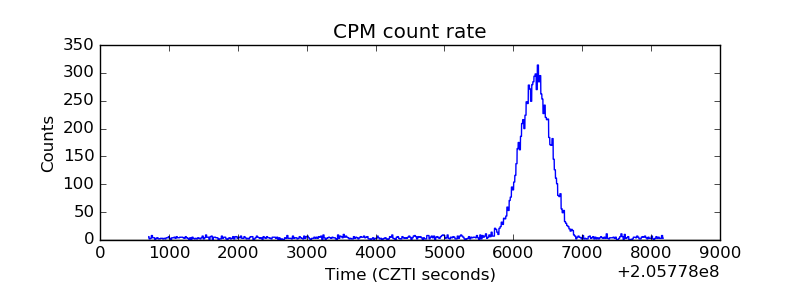 |
| CZT Counter | 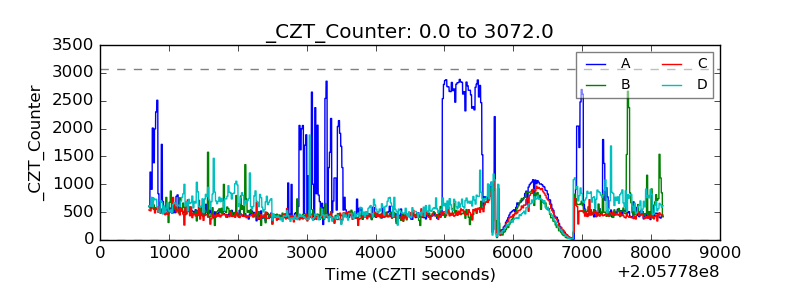 |
| +2.5 Volts monitor |  |
| +5 Volts monitor |  |
| _ROLL_ROT | 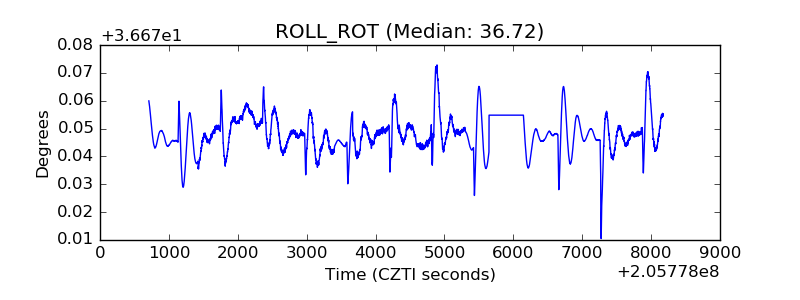 |
| _Roll_DEC | 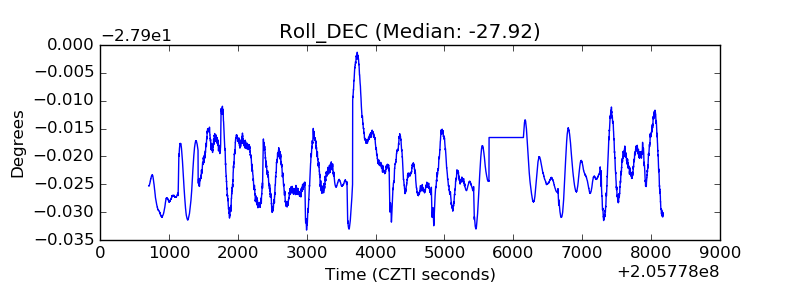 |
| _Roll_RA |  |
| Veto Counter | 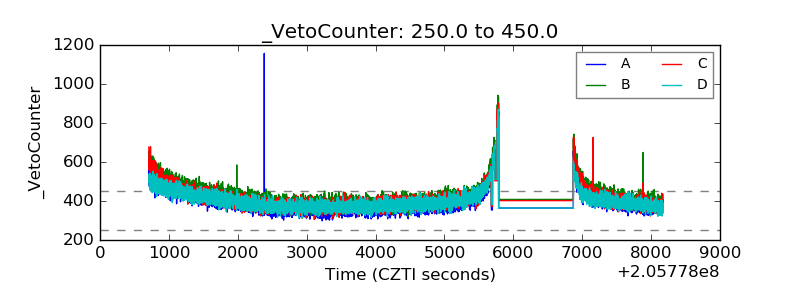 |