| Param | Original file | Final file |
|---|---|---|
| Filename | modeM0/AS1G05_240T01_9000000536_04229cztM0_level2.evt | modeM0/AS1G05_240T01_9000000536_04229cztM0_level2_quad_clean.evt |
| Size (bytes) | 579,625,920 | 72,175,680 |
| Size | 552.8 MB | 68.8 MB |
| Events in quadrant A | 5,101,235 | 414,986 |
| Events in quadrant B | 4,308,946 | 439,283 |
| Events in quadrant C | 3,142,630 | 432,242 |
| Events in quadrant D | 4,531,113 | 415,419 |
| Mode SS | |||
|---|---|---|---|
| Quadrant | BADHDUFLAG | Total packets | Discarded packets |
| A | 0 | 142 | 0 |
| B | 0 | 142 | 0 |
| C | 0 | 142 | 0 |
| D | 0 | 142 | 0 |
| Mode M9 | |||
|---|---|---|---|
| Quadrant | BADHDUFLAG | Total packets | Discarded packets |
| A | 0 | 13 | 0 |
| B | 0 | 13 | 0 |
| C | 0 | 13 | 0 |
| D | 0 | 14 | 0 |
| Mode M0 | |||
|---|---|---|---|
| Quadrant | BADHDUFLAG | Total packets | Discarded packets |
| A | 0 | 19831 | 3 |
| B | 0 | 17348 | 2 |
| C | 0 | 14203 | 2 |
| D | 0 | 18340 | 2 |
| Quadrant | Total seconds | Saturated seconds | Saturation percentage |
|---|---|---|---|
| A | 6930 | 775 | 11.183261% |
| B | 6930 | 251 | 3.621934% |
| C | 6930 | 49 | 0.707071% |
| D | 6930 | 161 | 2.323232% |
Noise dominated data is calculated using 1-second bins in cleaned event files. If a bin has >2000 counts, and if more than 50% of those come from <1% of pixels, then it is considered to be noise-dominated and hence unusable.
| Quadrant | # 1 sec bins | Bins with >0 counts | Bins with >2000 counts | High rate bins dominated by noise | Noise dominated (total time) | Noise dominated (detector-on time) | Marked lightcurve |
|---|---|---|---|---|---|---|---|
| A | 7690 | 6932 | 510 | 510 | 6.63% | 7.36% |  |
| B | 7690 | 6931 | 164 | 164 | 2.13% | 2.37% |  |
| C | 7690 | 6932 | 0 | 0 | 0.00% | 0.00% | 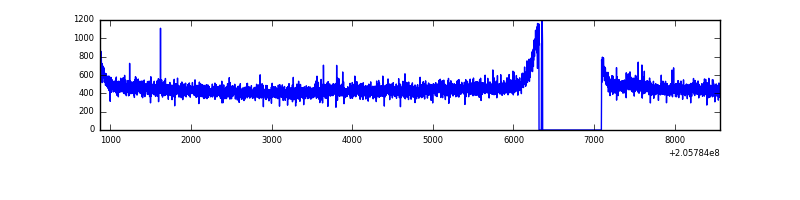 |
| D | 7690 | 6932 | 81 | 81 | 1.05% | 1.17% | 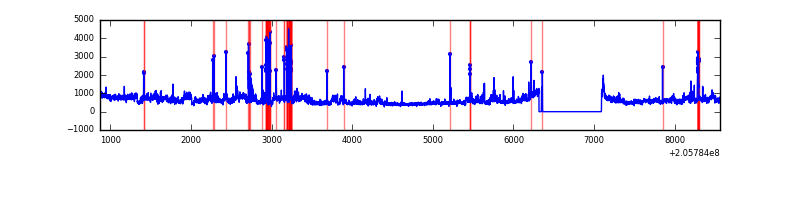 |
Top three noisy pixels from each quadrant. If the there are fewer than three noisy pixels in the level2.evt file, extra rows are filled as -1
| Pixel properties | Quadrant properties | ||||||
|---|---|---|---|---|---|---|---|
| Quadrant | DetID | PixID | Counts | Sigma | Mean | Median | Sigma |
| A | 0 | 50 | 1518790 | 9326.31 | 793 | 776 | 162.8 |
| A | 15 | 234 | 306779 | 1880.01 | 793 | 776 | 162.8 |
| A | 12 | 247 | 181406 | 1109.75 | 793 | 776 | 162.8 |
| B | 3 | 0 | 977388 | 6154.55 | 826 | 809 | 158.7 |
| B | 15 | 204 | 57968 | 360.22 | 826 | 809 | 158.7 |
| B | 14 | 167 | 25674 | 156.7 | 826 | 809 | 158.7 |
| C | 9 | 144 | 31985 | 167.65 | 793 | 796 | 186.0 |
| C | 10 | 65 | 10740 | 53.45 | 793 | 796 | 186.0 |
| C | 13 | 61 | 6593 | 31.16 | 793 | 796 | 186.0 |
| D | 11 | 132 | 1142873 | 5945.07 | 788 | 765 | 192.1 |
| D | 15 | 217 | 156781 | 812.12 | 788 | 765 | 192.1 |
| D | 1 | 52 | 88361 | 455.97 | 788 | 765 | 192.1 |
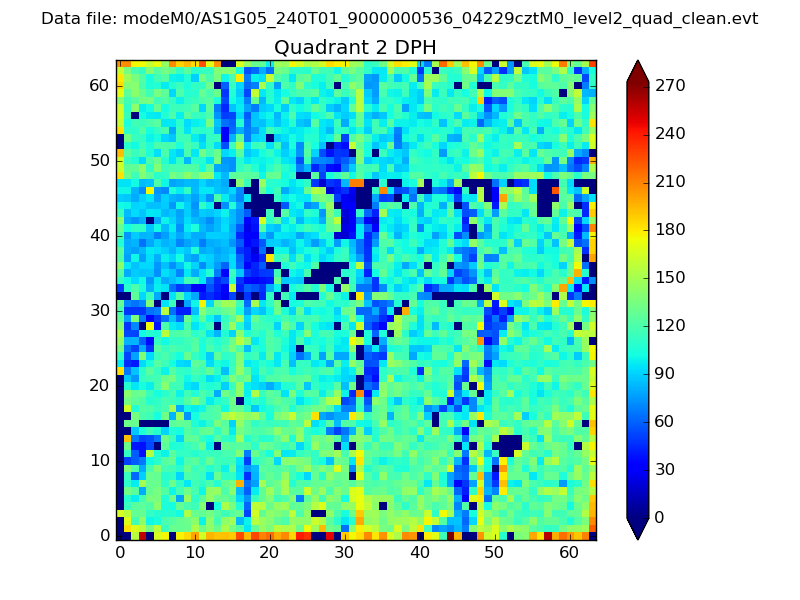
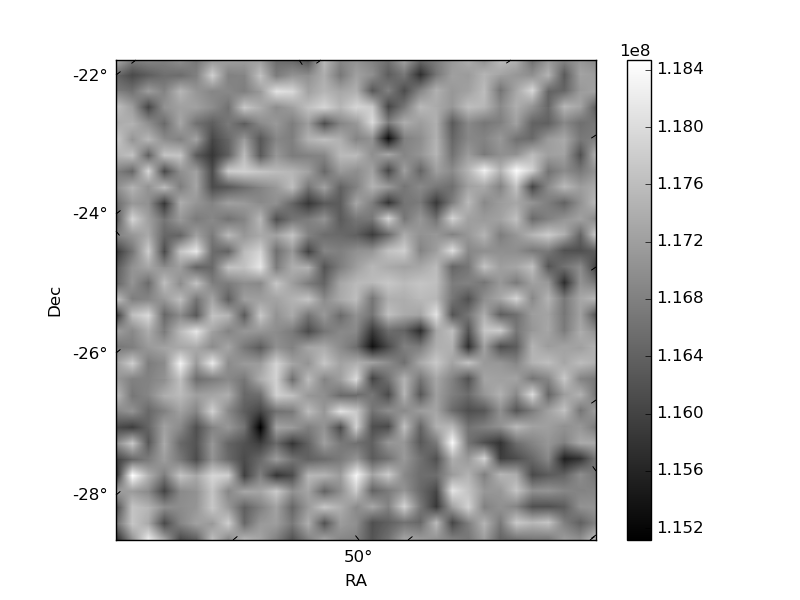
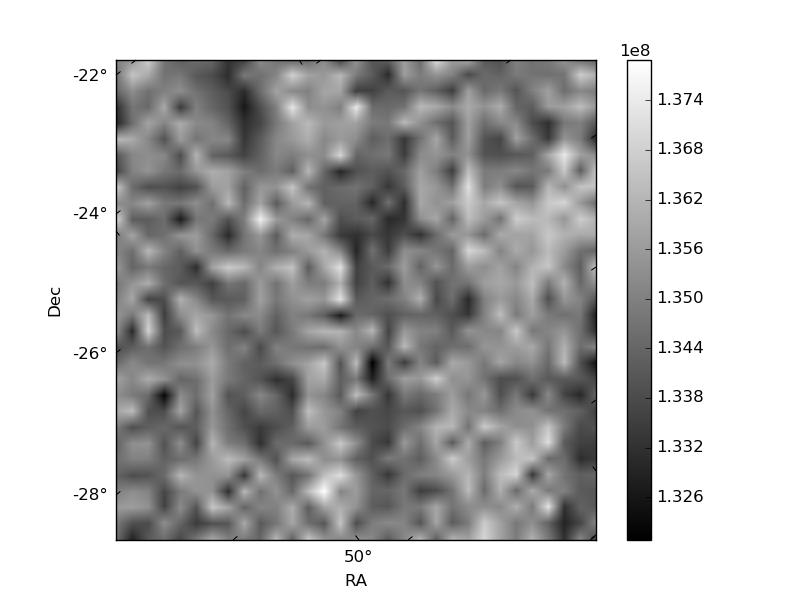
Histogram calculated using DETX and DETY for each event in the final _common_clean file
| Quadrant A | 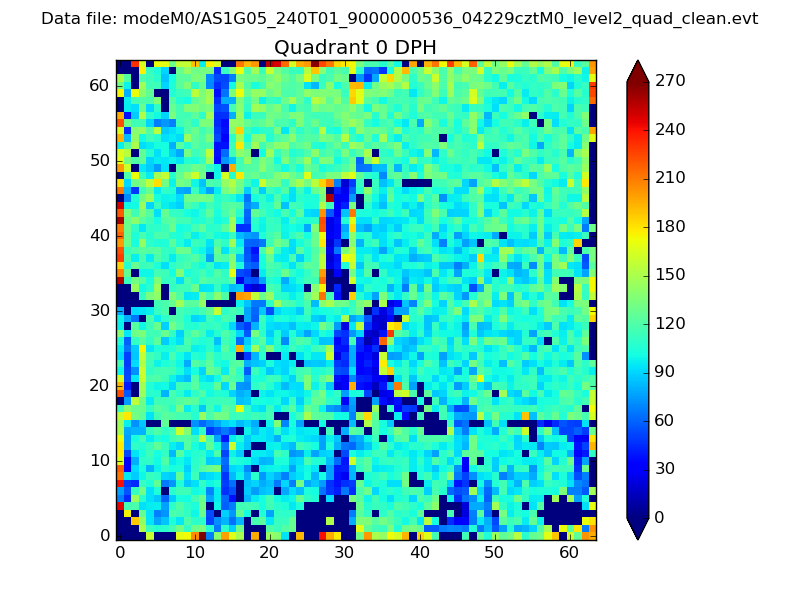 |
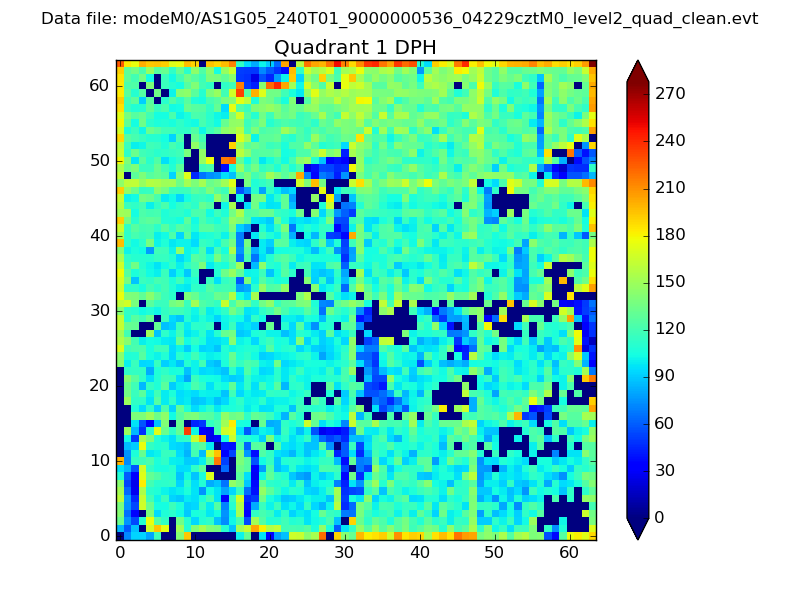 |
Quadrant B |
|---|---|---|---|
| Quadrant D | 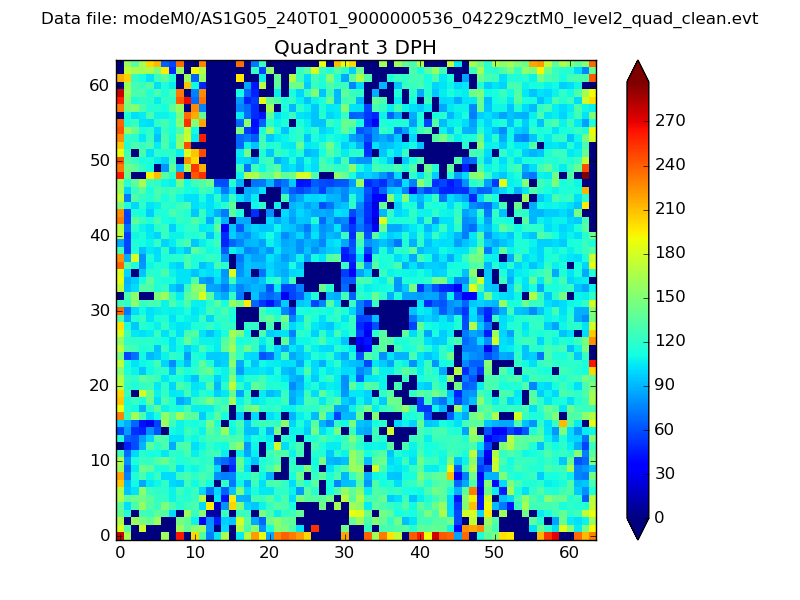 |
 |
Quadrant C |
| Plot type | Count rate plots | Images |
|---|---|---|
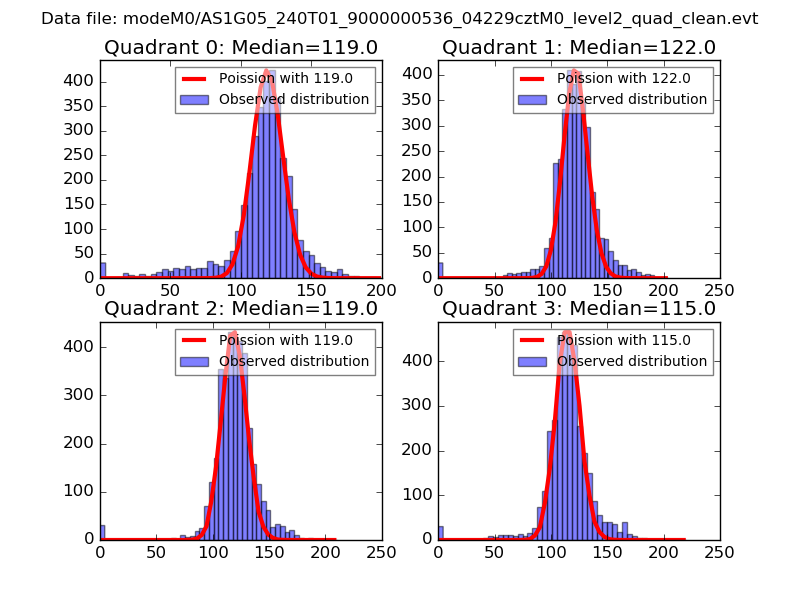
| Comparison with Poisson distribution Blue bars denote a histogram of data divided into 1 sec bins. Red curve is a Poisson curve with rate = median count rate of data. |
 |
 |
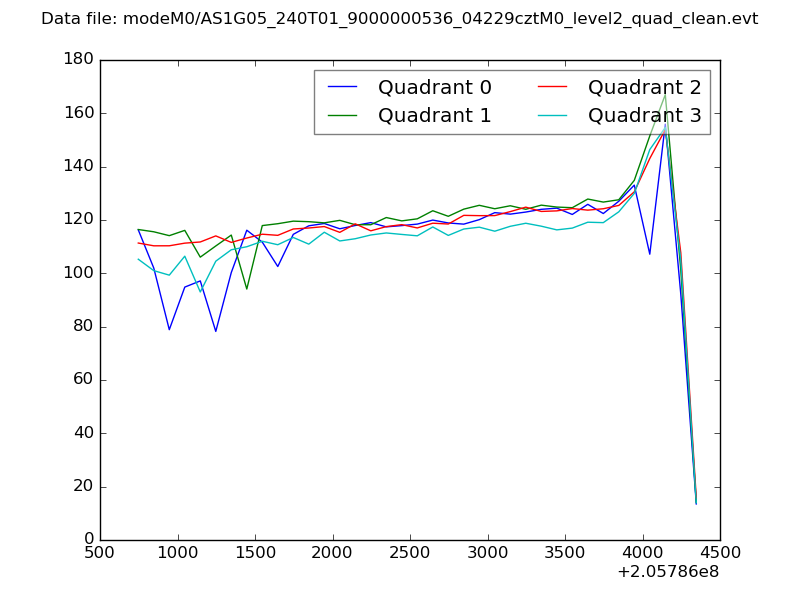
| Quadrant-wise count rates Data is divided into 100 sec bins |
 |
|
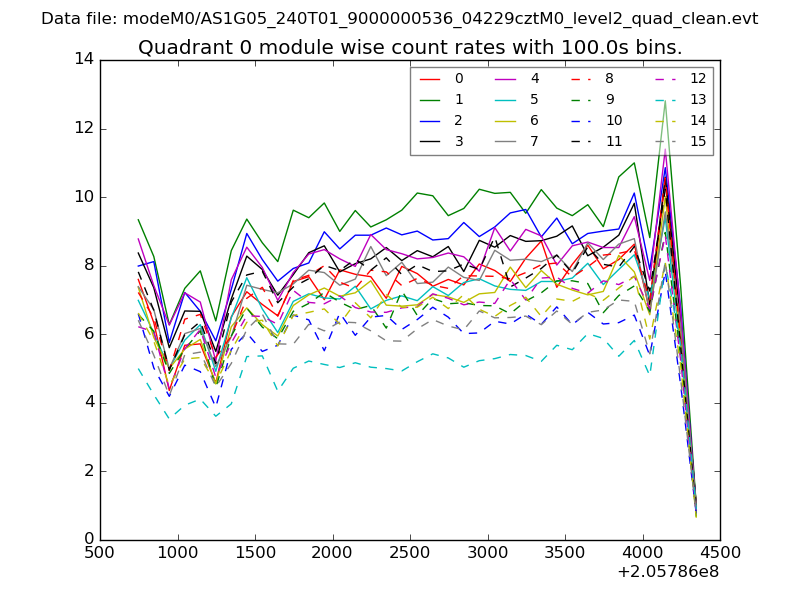
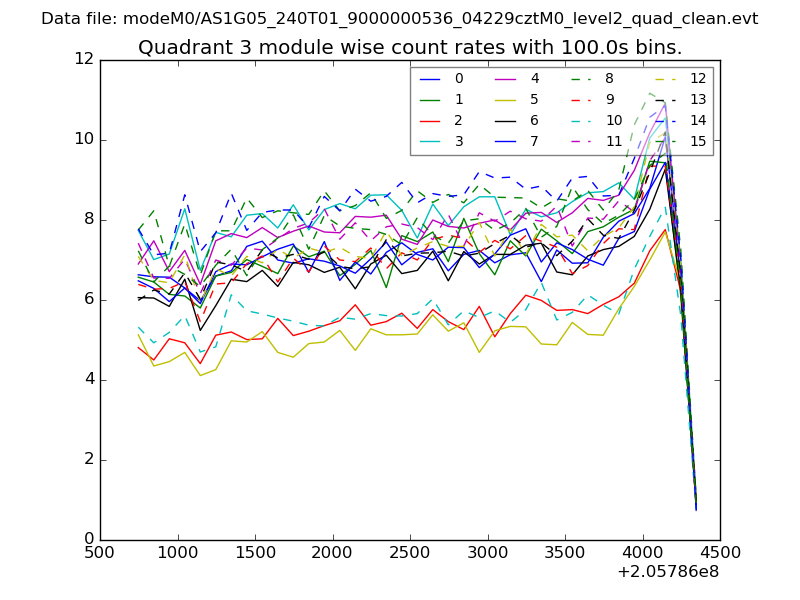
| Module-wise count rates for Quadrant A Data is divided into 100 sec bins |
 |
 |
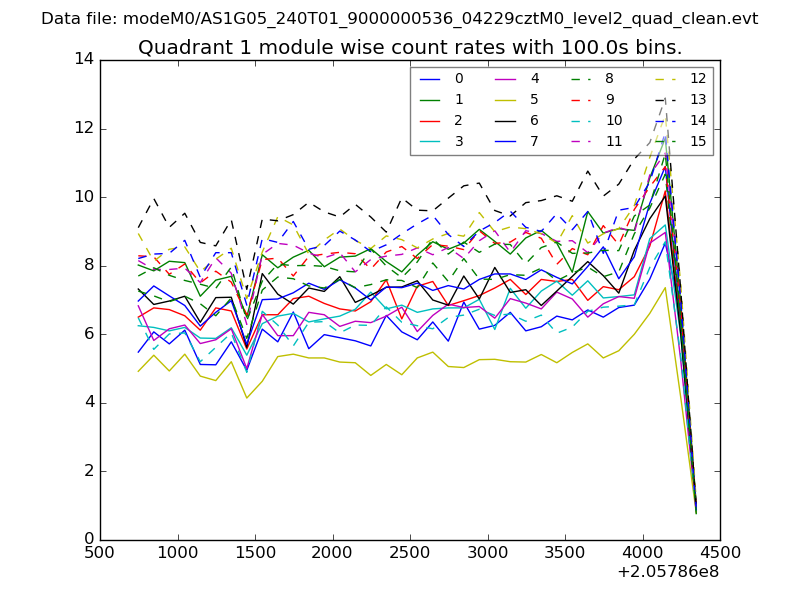
| Module-wise count rates for Quadrant B Data is divided into 100 sec bins |
 |
 |
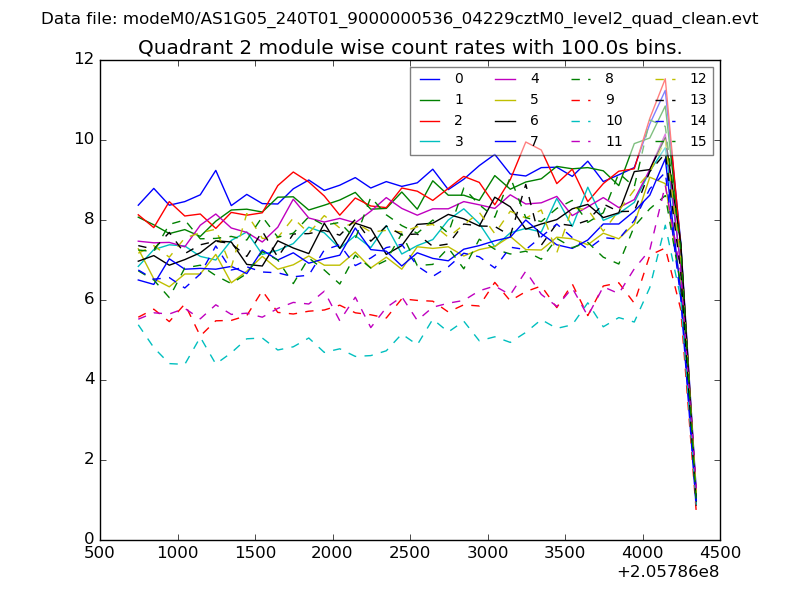
| Module-wise count rates for Quadrant C Data is divided into 100 sec bins |
 |
 |
| Module-wise count rates for Quadrant D Data is divided into 100 sec bins |
 |
 |
| Parameter | Plot |
|---|---|
| CZT HV Monitor | 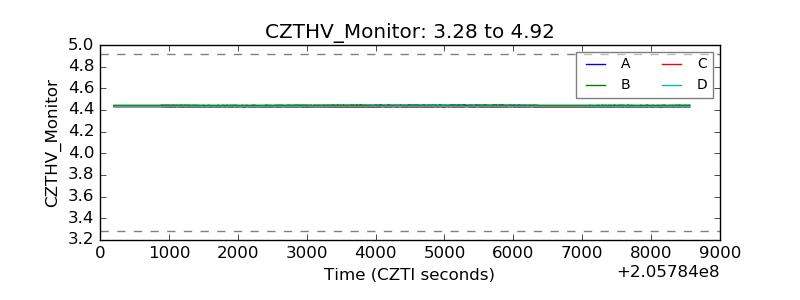 |
| D_VDD |  |
| Temperature 1 | 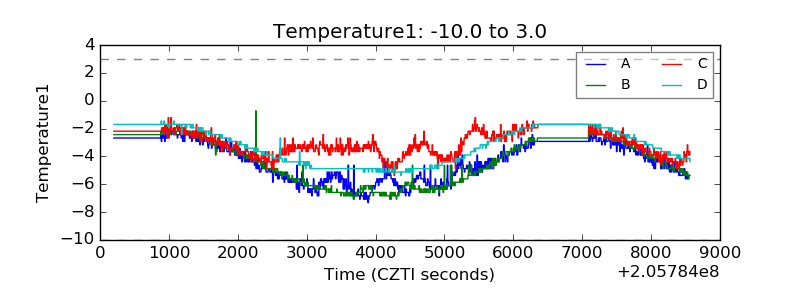 |
| Veto HV Monitor | 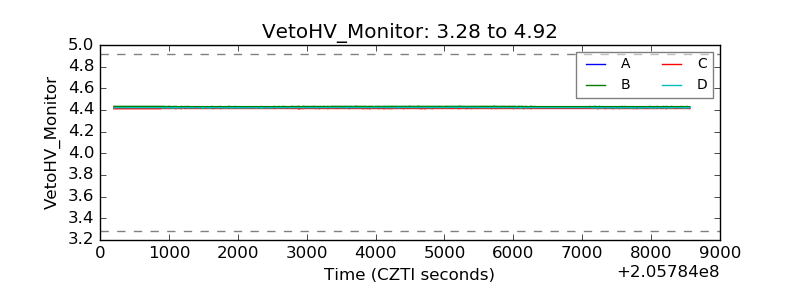 |
| Veto LLD |  |
| Alpha Counter | 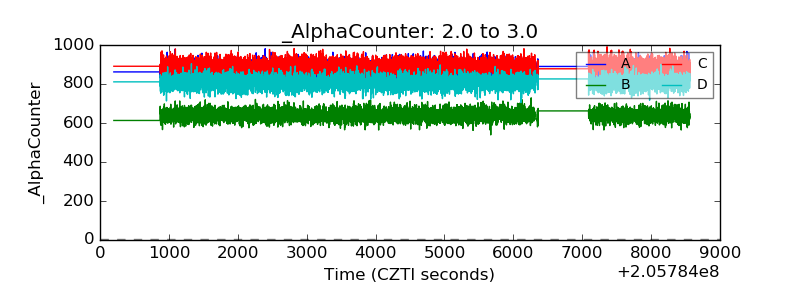 |
| _CPM_Rate | 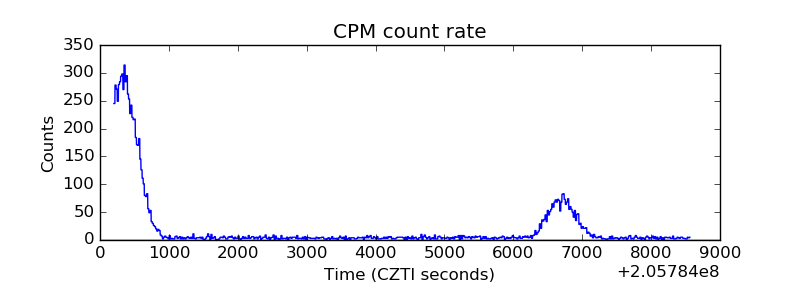 |
| CZT Counter | 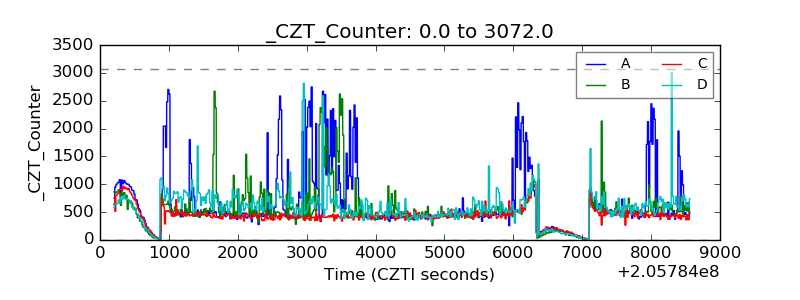 |
| +2.5 Volts monitor |  |
| +5 Volts monitor | 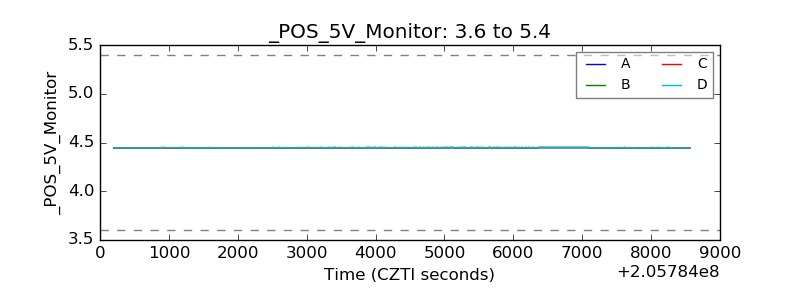 |
| _ROLL_ROT | 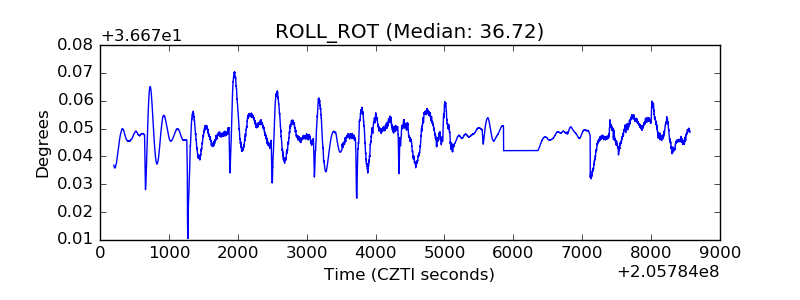 |
| _Roll_DEC | 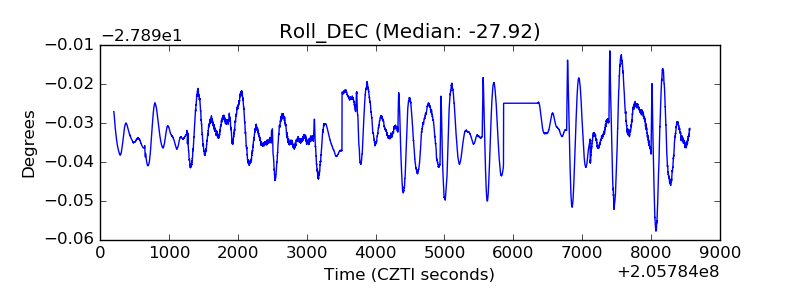 |
| _Roll_RA | 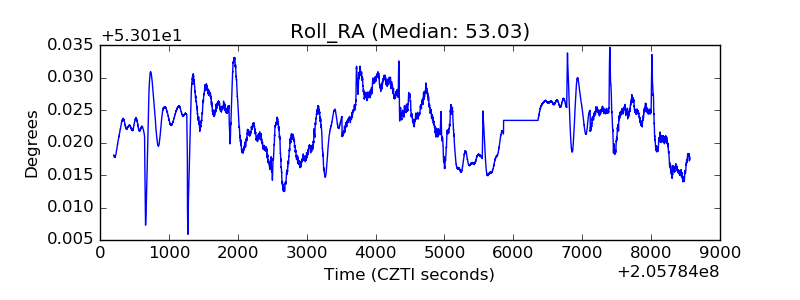 |
| Veto Counter | 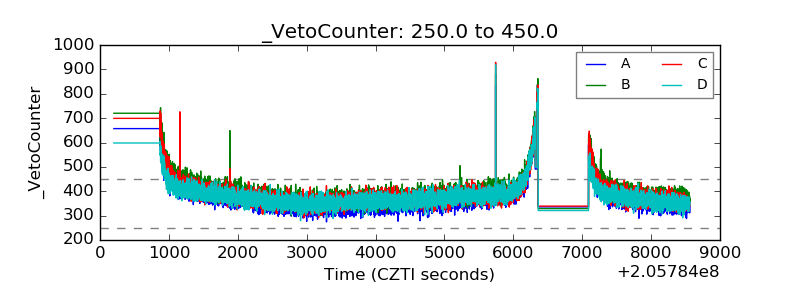 |