| Param | Original file | Final file |
|---|---|---|
| Filename | modeM0/AS1G05_240T01_9000000536_04230cztM0_level2.evt | modeM0/AS1G05_240T01_9000000536_04230cztM0_level2_quad_clean.evt |
| Size (bytes) | 589,835,520 | 69,183,360 |
| Size | 562.5 MB | 66.0 MB |
| Events in quadrant A | 4,884,930 | 392,464 |
| Events in quadrant B | 4,126,212 | 405,530 |
| Events in quadrant C | 3,976,207 | 392,993 |
| Events in quadrant D | 4,370,030 | 384,372 |
| Mode SS | |||
|---|---|---|---|
| Quadrant | BADHDUFLAG | Total packets | Discarded packets |
| A | 0 | 154 | 0 |
| B | 0 | 154 | 0 |
| C | 0 | 154 | 0 |
| D | 0 | 154 | 0 |
| Mode M9 | |||
|---|---|---|---|
| Quadrant | BADHDUFLAG | Total packets | Discarded packets |
| A | 0 | 10 | 0 |
| B | 0 | 10 | 0 |
| C | 0 | 10 | 0 |
| D | 0 | 10 | 0 |
| Mode M0 | |||
|---|---|---|---|
| Quadrant | BADHDUFLAG | Total packets | Discarded packets |
| A | 0 | 19666 | 34 |
| B | 0 | 17279 | 4 |
| C | 0 | 16848 | 2 |
| D | 0 | 18355 | 11 |
| Quadrant | Total seconds | Saturated seconds | Saturation percentage |
|---|---|---|---|
| A | 7454 | 559 | 7.499329% |
| B | 7460 | 180 | 2.412869% |
| C | 7461 | 92 | 1.233079% |
| D | 7458 | 150 | 2.011263% |
Noise dominated data is calculated using 1-second bins in cleaned event files. If a bin has >2000 counts, and if more than 50% of those come from <1% of pixels, then it is considered to be noise-dominated and hence unusable.
| Quadrant | # 1 sec bins | Bins with >0 counts | Bins with >2000 counts | High rate bins dominated by noise | Noise dominated (total time) | Noise dominated (detector-on time) | Marked lightcurve |
|---|---|---|---|---|---|---|---|
| A | 8466 | 7462 | 338 | 338 | 3.99% | 4.53% | 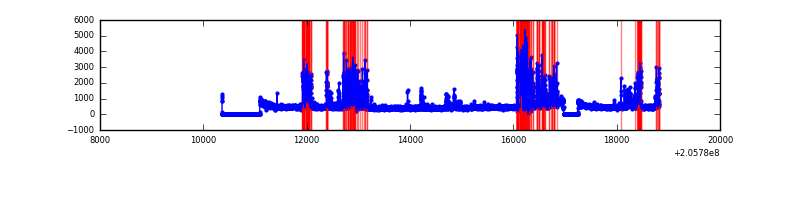 |
| B | 8466 | 7462 | 11 | 11 | 0.13% | 0.15% | 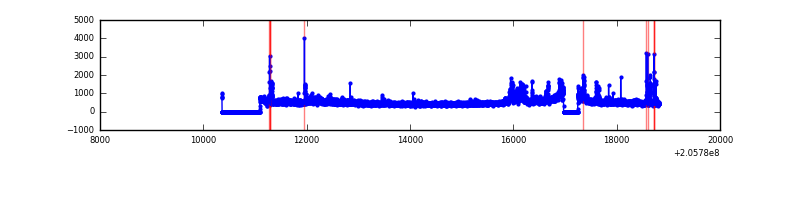 |
| C | 8466 | 7463 | 1 | 1 | 0.01% | 0.01% | 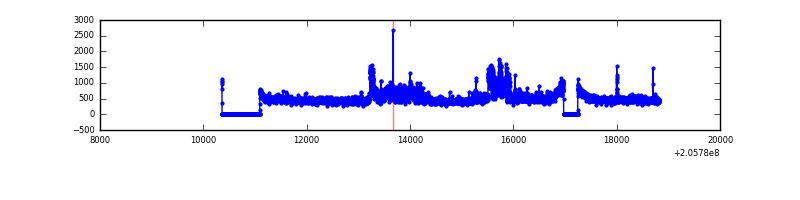 |
| D | 8466 | 7463 | 33 | 33 | 0.39% | 0.44% | 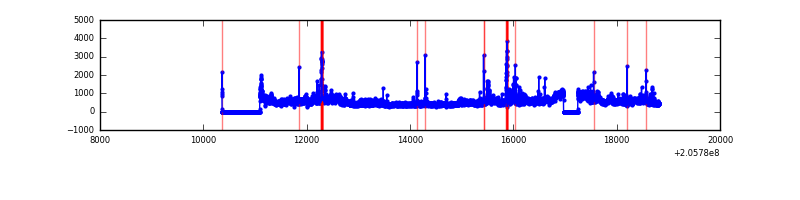 |
Top three noisy pixels from each quadrant. If the there are fewer than three noisy pixels in the level2.evt file, extra rows are filled as -1
| Pixel properties | Quadrant properties | ||||||
|---|---|---|---|---|---|---|---|
| Quadrant | DetID | PixID | Counts | Sigma | Mean | Median | Sigma |
| A | 0 | 50 | 837673 | 4728.98 | 853 | 834 | 177.0 |
| A | 14 | 111 | 419643 | 2366.69 | 853 | 834 | 177.0 |
| A | 15 | 234 | 311530 | 1755.75 | 853 | 834 | 177.0 |
| B | 3 | 0 | 448628 | 2626.13 | 884 | 861 | 170.5 |
| B | 15 | 204 | 196491 | 1147.36 | 884 | 861 | 170.5 |
| B | 14 | 167 | 16222 | 90.09 | 884 | 861 | 170.5 |
| C | 9 | 144 | 620187 | 3121.02 | 847 | 850 | 198.4 |
| C | 10 | 65 | 14759 | 70.09 | 847 | 850 | 198.4 |
| C | 9 | 247 | 11962 | 56.0 | 847 | 850 | 198.4 |
| D | 11 | 132 | 828055 | 4044.42 | 844 | 818 | 204.5 |
| D | 13 | 239 | 90393 | 437.94 | 844 | 818 | 204.5 |
| D | 1 | 52 | 67094 | 324.03 | 844 | 818 | 204.5 |
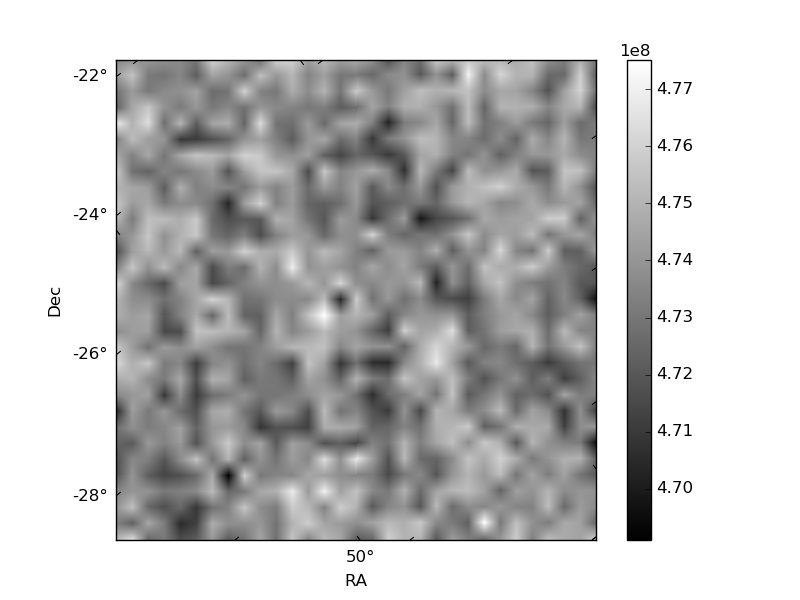
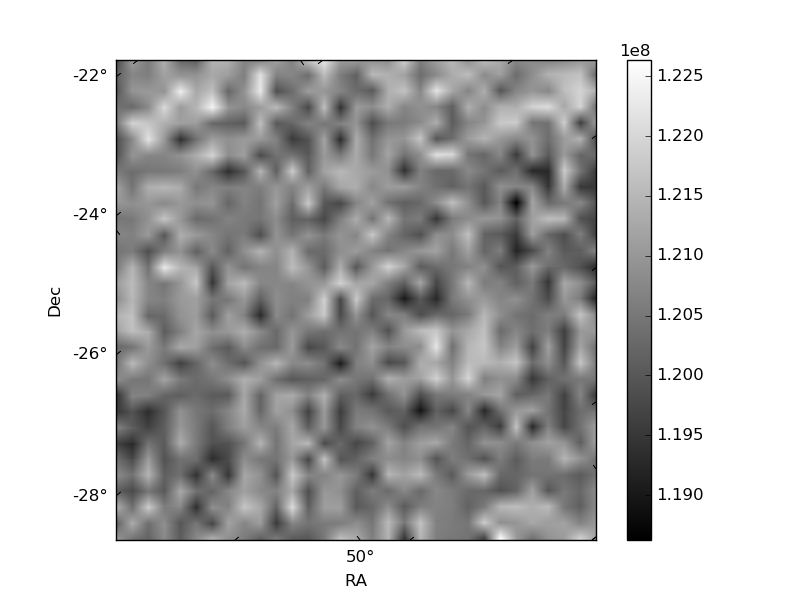
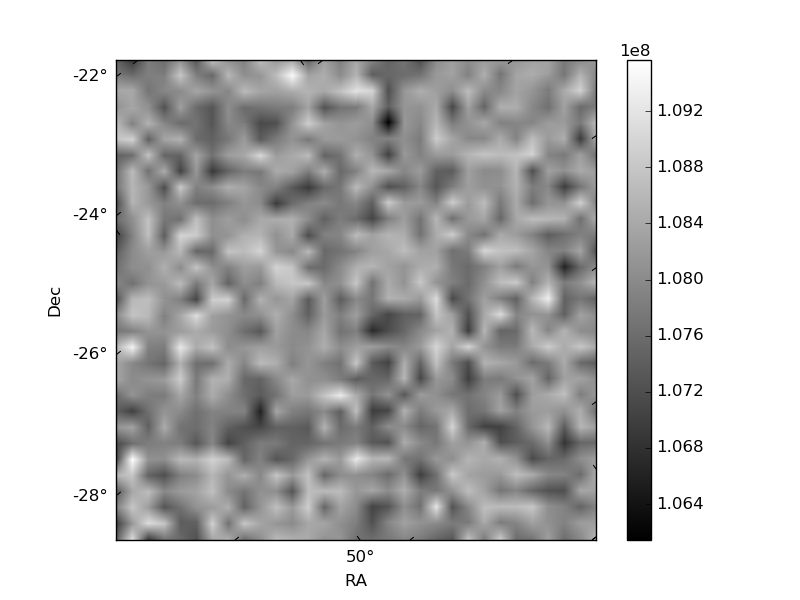
Histogram calculated using DETX and DETY for each event in the final _common_clean file
| Quadrant A | 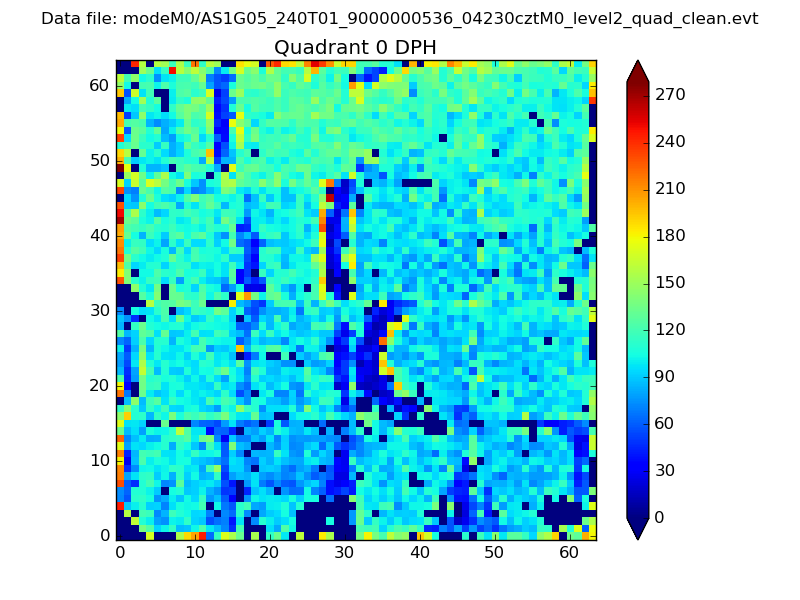 |
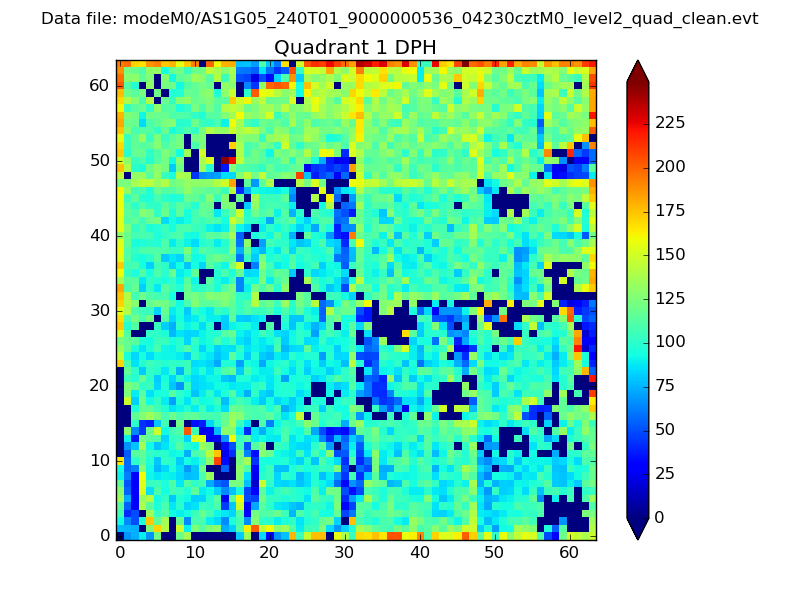 |
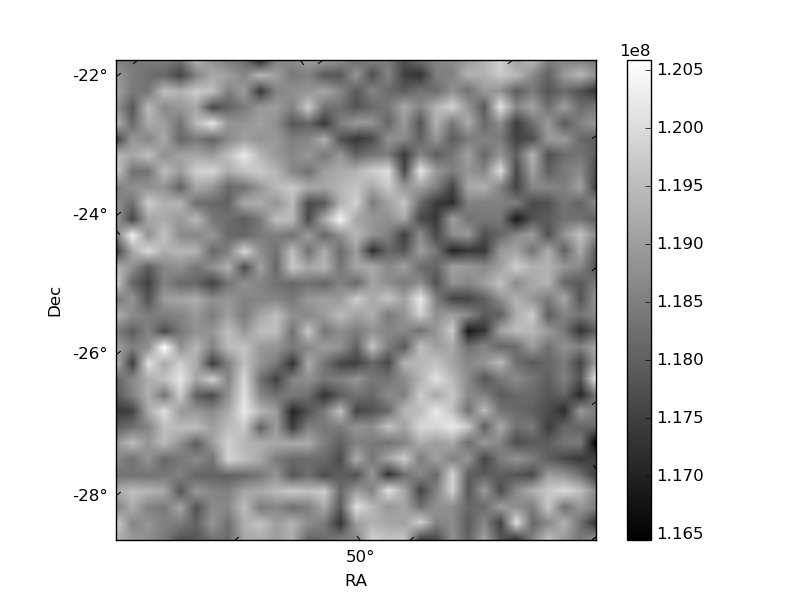
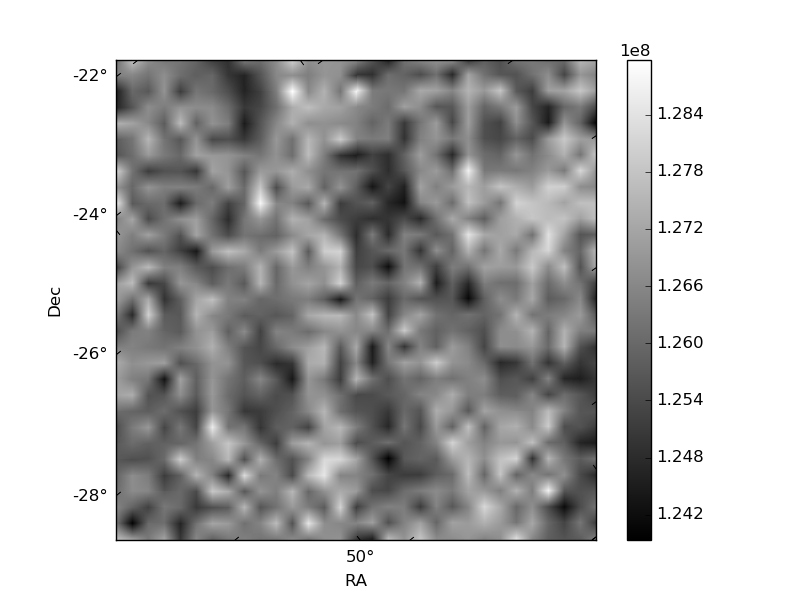
Quadrant B |
|---|---|---|---|
| Quadrant D | 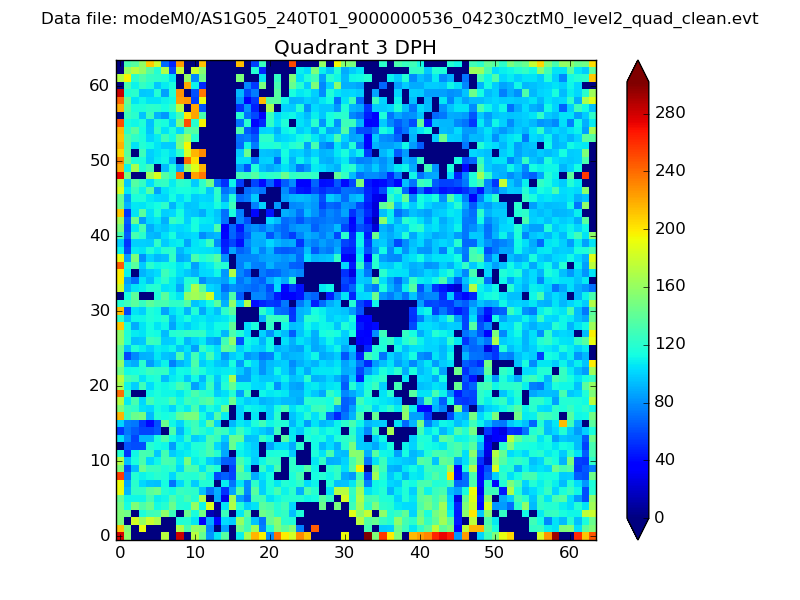 |
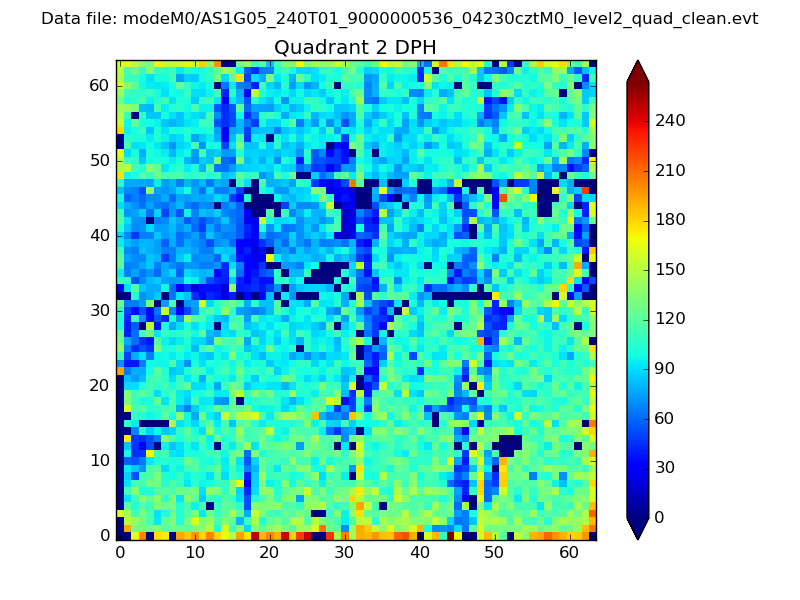 |
Quadrant C |
| Plot type | Count rate plots | Images |
|---|---|---|
| Comparison with Poisson distribution Blue bars denote a histogram of data divided into 1 sec bins. Red curve is a Poisson curve with rate = median count rate of data. |
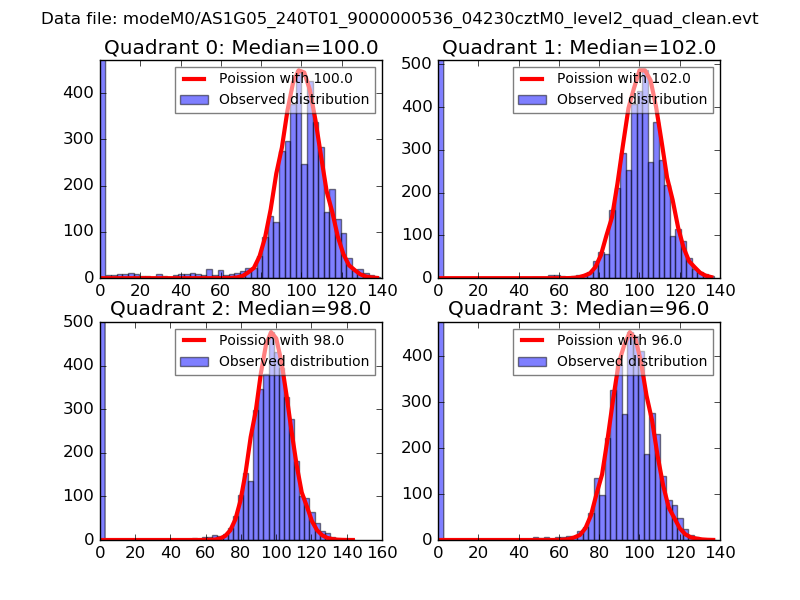 |
 |
| Quadrant-wise count rates Data is divided into 100 sec bins |
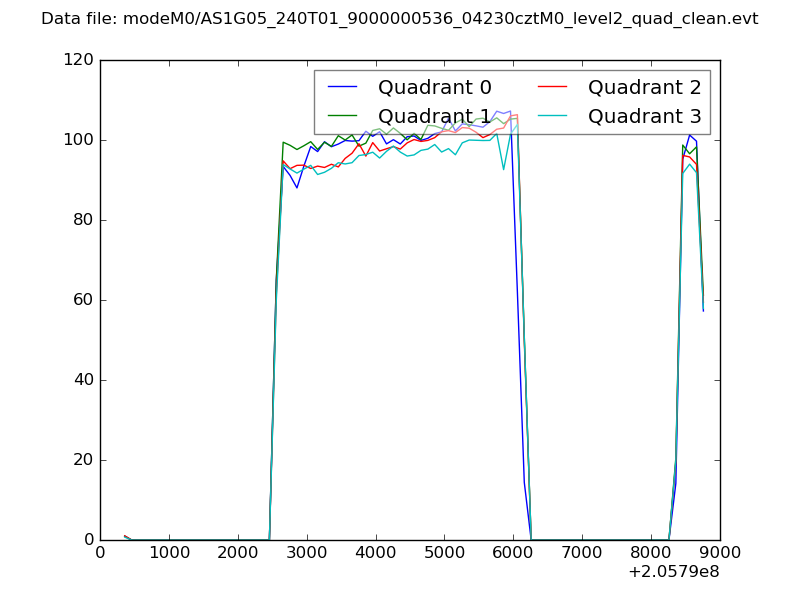 |
|
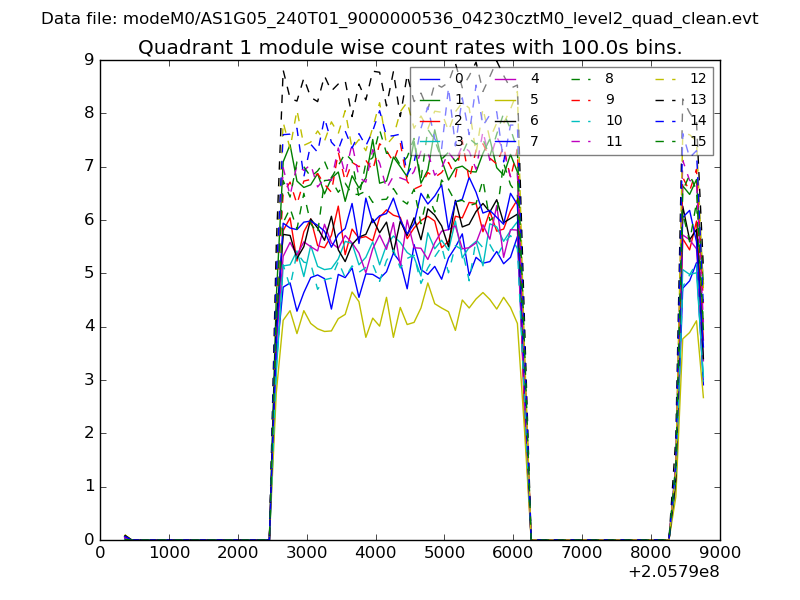
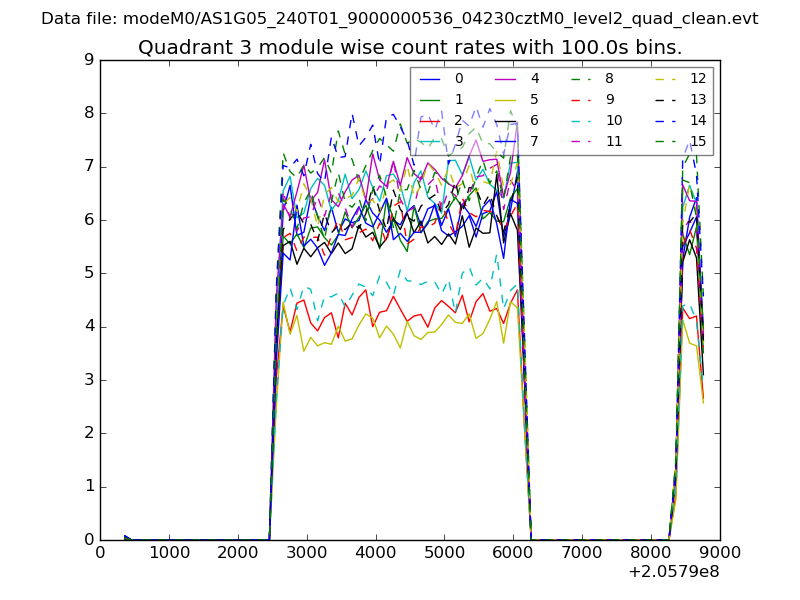
| Module-wise count rates for Quadrant A Data is divided into 100 sec bins |
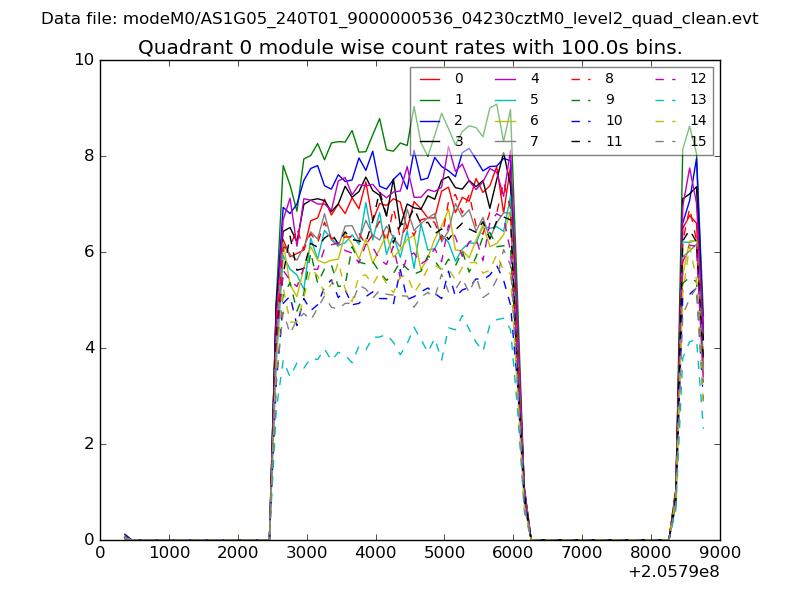 |
 |
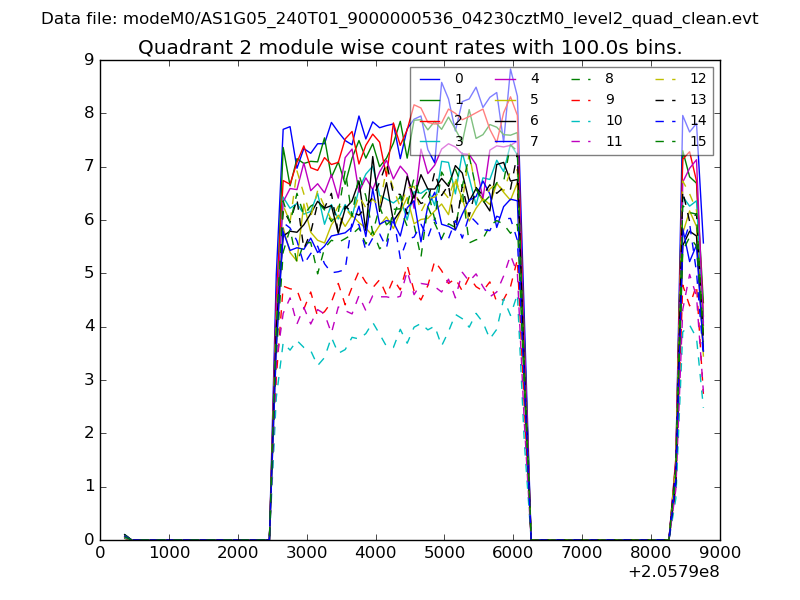
| Module-wise count rates for Quadrant B Data is divided into 100 sec bins |
 |
 |
| Module-wise count rates for Quadrant C Data is divided into 100 sec bins |
 |
 |
| Module-wise count rates for Quadrant D Data is divided into 100 sec bins |
 |
 |
| Parameter | Plot |
|---|---|
| CZT HV Monitor | 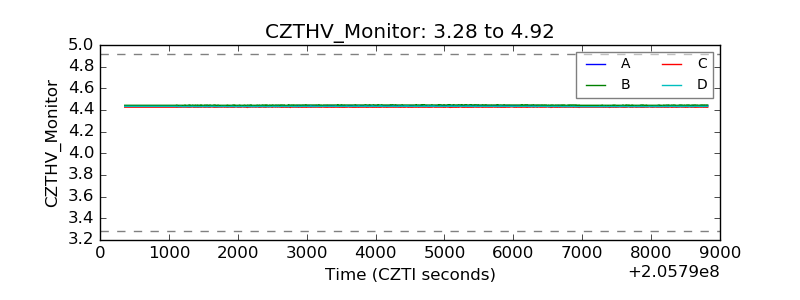 |
| D_VDD | 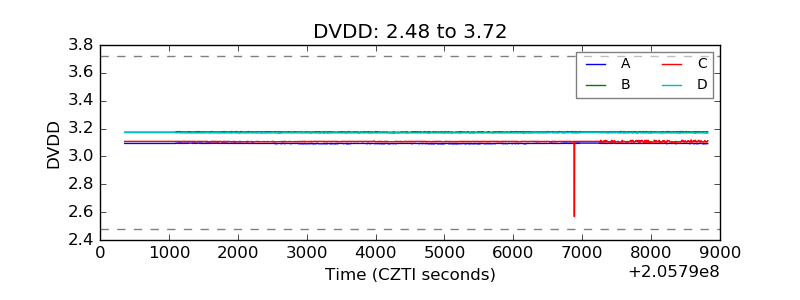 |
| Temperature 1 | 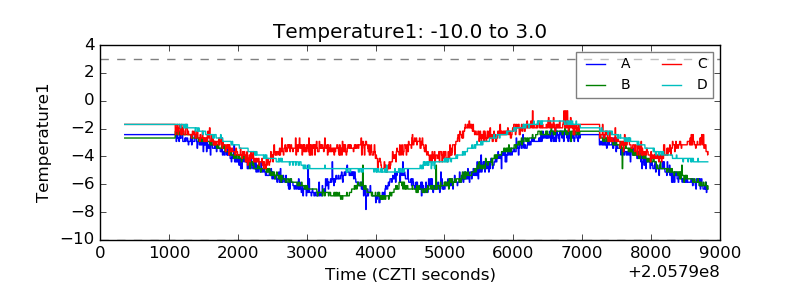 |
| Veto HV Monitor | 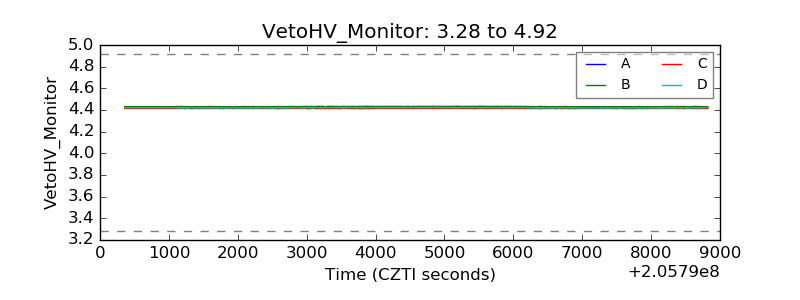 |
| Veto LLD | 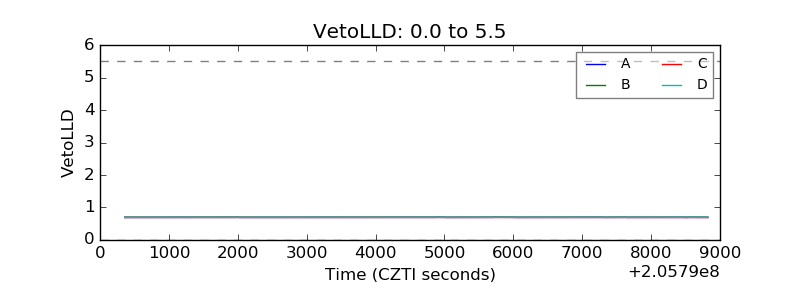 |
| Alpha Counter | 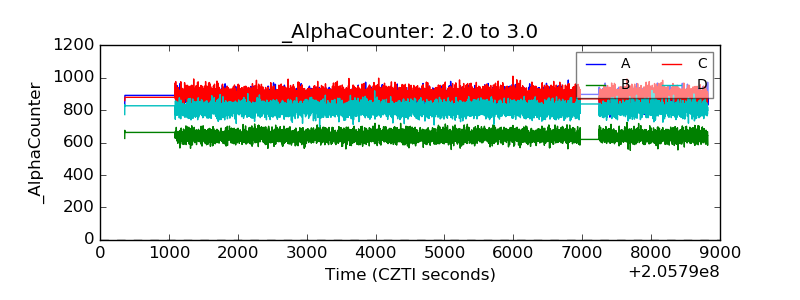 |
| _CPM_Rate | 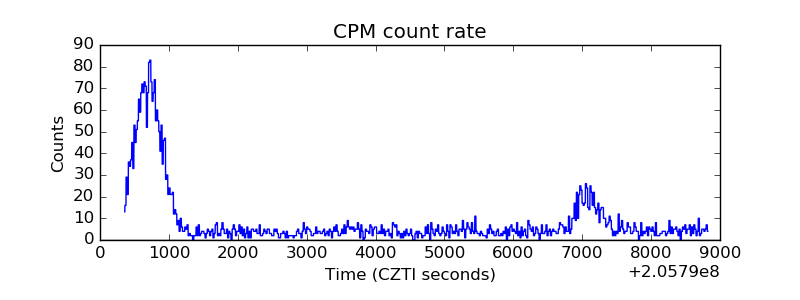 |
| CZT Counter | 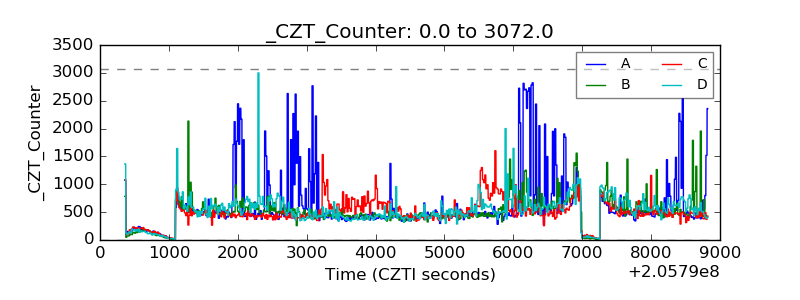 |
| +2.5 Volts monitor | 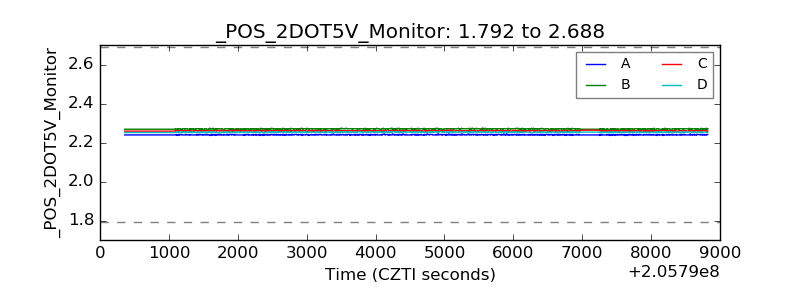 |
| +5 Volts monitor |  |
| _ROLL_ROT | 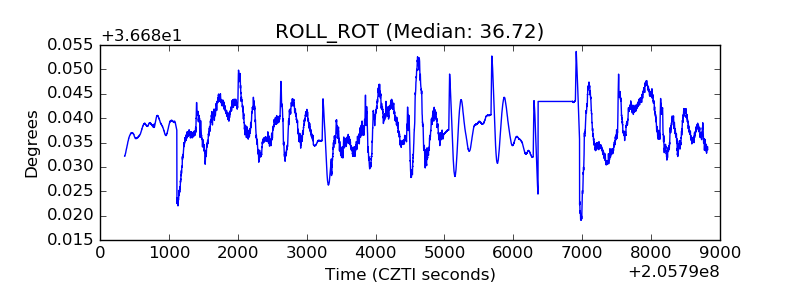 |
| _Roll_DEC | 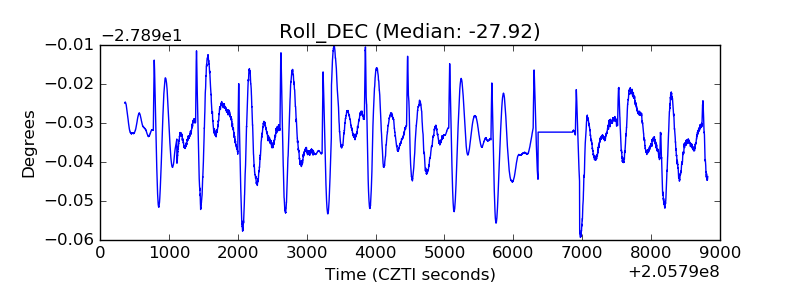 |
| _Roll_RA | 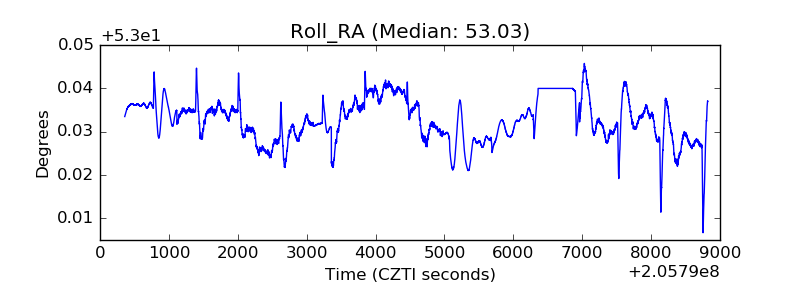 |
| Veto Counter | 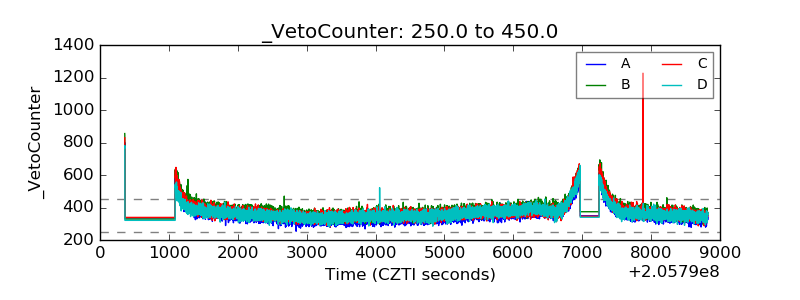 |