| Param | Original file | Final file |
|---|---|---|
| Filename | modeM0/AS1G05_240T01_9000000536_04231cztM0_level2.evt | modeM0/AS1G05_240T01_9000000536_04231cztM0_level2_quad_clean.evt |
| Size (bytes) | 598,092,480 | 75,818,880 |
| Size | 570.4 MB | 72.3 MB |
| Events in quadrant A | 4,664,781 | 442,118 |
| Events in quadrant B | 4,532,140 | 447,143 |
| Events in quadrant C | 3,764,892 | 434,176 |
| Events in quadrant D | 4,613,351 | 420,769 |
| Mode SS | |||
|---|---|---|---|
| Quadrant | BADHDUFLAG | Total packets | Discarded packets |
| A | 0 | 162 | 0 |
| B | 0 | 162 | 0 |
| C | 0 | 162 | 0 |
| D | 0 | 162 | 0 |
| Mode M9 | |||
|---|---|---|---|
| Quadrant | BADHDUFLAG | Total packets | Discarded packets |
| A | 0 | 5 | 0 |
| B | 0 | 5 | 0 |
| C | 0 | 5 | 0 |
| D | 0 | 5 | 0 |
| Mode M0 | |||
|---|---|---|---|
| Quadrant | BADHDUFLAG | Total packets | Discarded packets |
| A | 0 | 19433 | 36 |
| B | 0 | 18958 | 54 |
| C | 0 | 16683 | 24 |
| D | 0 | 19202 | 42 |
| Quadrant | Total seconds | Saturated seconds | Saturation percentage |
|---|---|---|---|
| A | 7942 | 408 | 5.137245% |
| B | 7936 | 366 | 4.611895% |
| C | 7945 | 158 | 1.988672% |
| D | 7942 | 239 | 3.009318% |
Noise dominated data is calculated using 1-second bins in cleaned event files. If a bin has >2000 counts, and if more than 50% of those come from <1% of pixels, then it is considered to be noise-dominated and hence unusable.
| Quadrant | # 1 sec bins | Bins with >0 counts | Bins with >2000 counts | High rate bins dominated by noise | Noise dominated (total time) | Noise dominated (detector-on time) | Marked lightcurve |
|---|---|---|---|---|---|---|---|
| A | 8316 | 7959 | 177 | 177 | 2.13% | 2.22% | 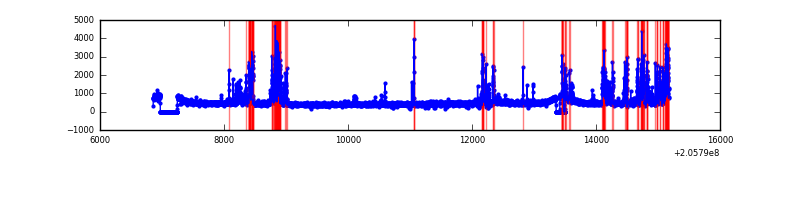 |
| B | 8316 | 7959 | 65 | 65 | 0.78% | 0.82% | 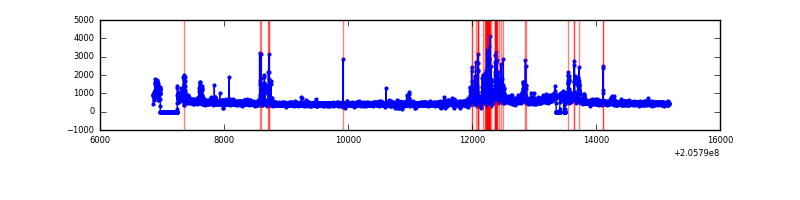 |
| C | 8316 | 7959 | 11 | 11 | 0.13% | 0.14% | 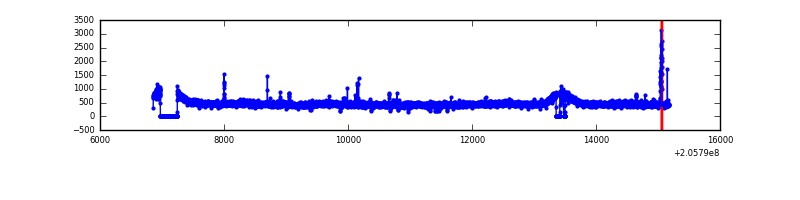 |
| D | 8316 | 7959 | 67 | 67 | 0.81% | 0.84% | 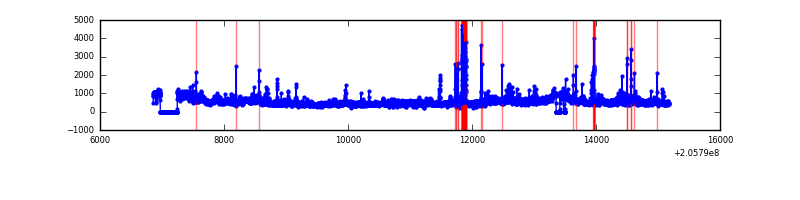 |
Top three noisy pixels from each quadrant. If the there are fewer than three noisy pixels in the level2.evt file, extra rows are filled as -1
| Pixel properties | Quadrant properties | ||||||
|---|---|---|---|---|---|---|---|
| Quadrant | DetID | PixID | Counts | Sigma | Mean | Median | Sigma |
| A | 0 | 50 | 985159 | 5119.32 | 931 | 909 | 192.3 |
| A | 15 | 234 | 80249 | 412.67 | 931 | 909 | 192.3 |
| A | 12 | 194 | 9644 | 45.43 | 931 | 909 | 192.3 |
| B | 14 | 167 | 336404 | 1821.56 | 943 | 920 | 184.2 |
| B | 3 | 0 | 231947 | 1254.39 | 943 | 920 | 184.2 |
| B | 15 | 204 | 219580 | 1187.25 | 943 | 920 | 184.2 |
| C | 9 | 144 | 94890 | 440.91 | 913 | 915 | 213.1 |
| C | 10 | 65 | 73116 | 338.75 | 913 | 915 | 213.1 |
| C | 8 | 128 | 12790 | 55.71 | 913 | 915 | 213.1 |
| D | 11 | 132 | 660063 | 2972.92 | 905 | 874 | 221.7 |
| D | 13 | 239 | 160373 | 719.34 | 905 | 874 | 221.7 |
| D | 2 | 232 | 101397 | 453.36 | 905 | 874 | 221.7 |
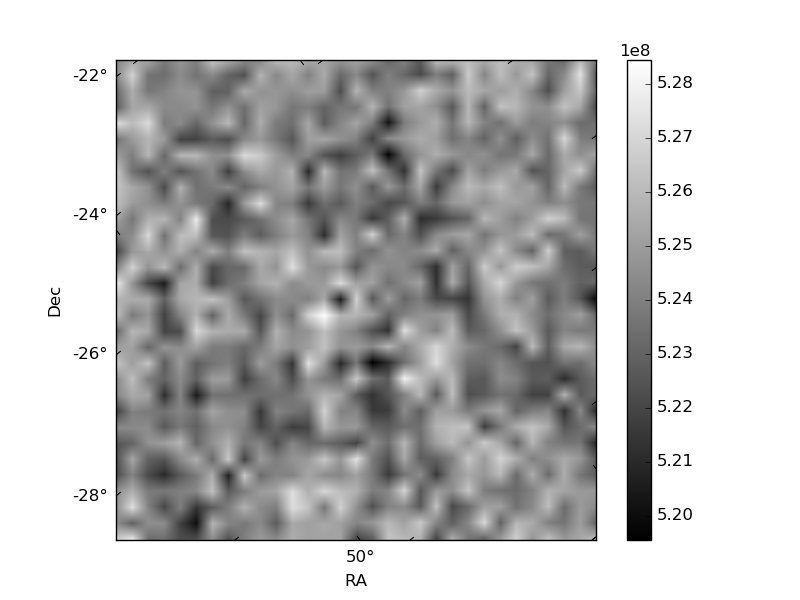
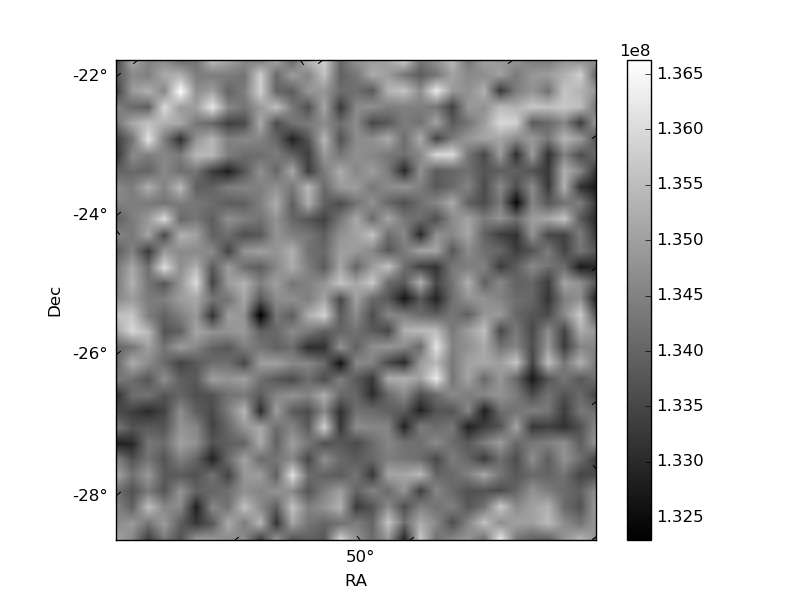
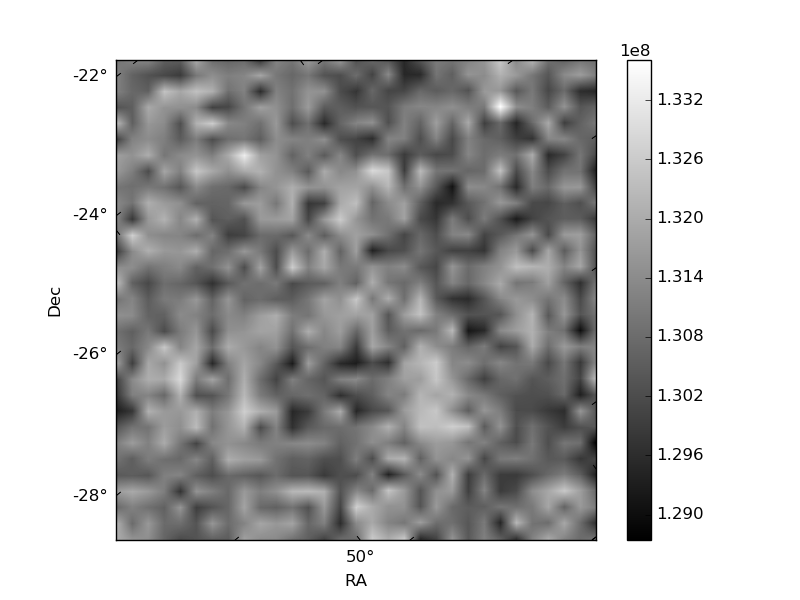
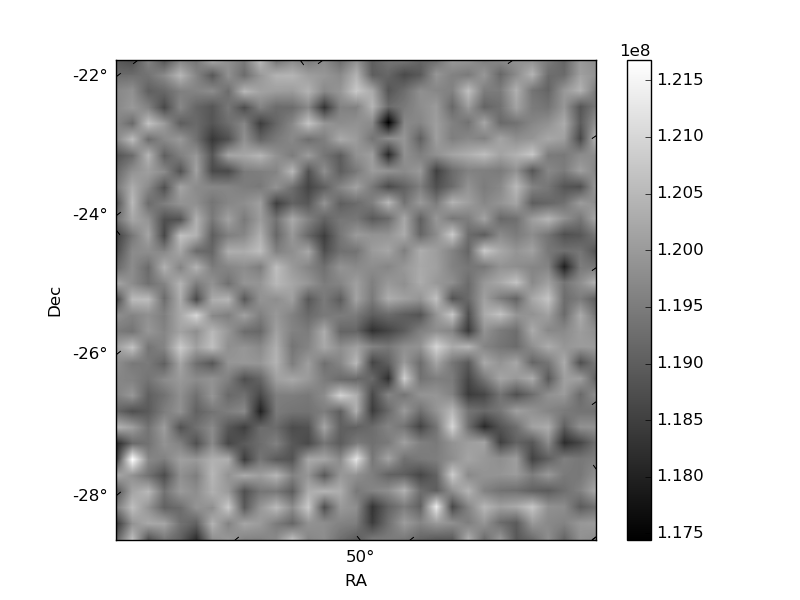
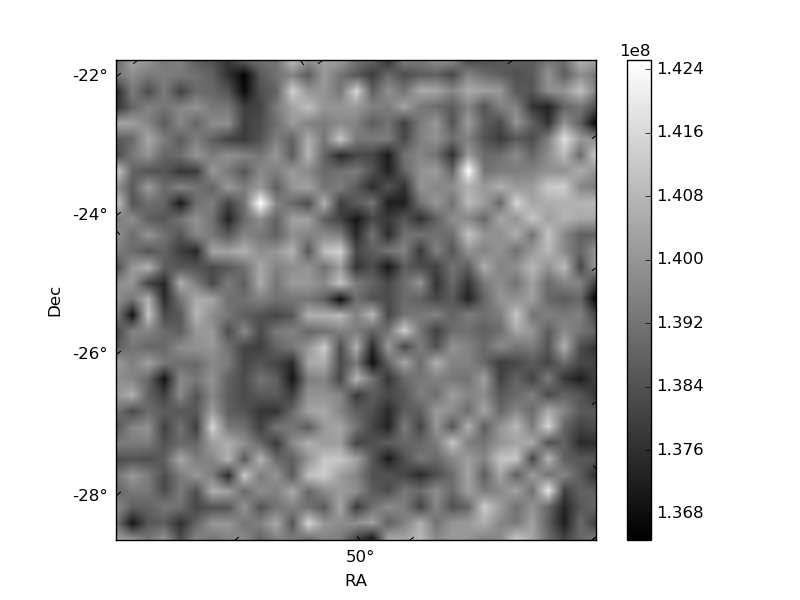
Histogram calculated using DETX and DETY for each event in the final _common_clean file
| Quadrant A | 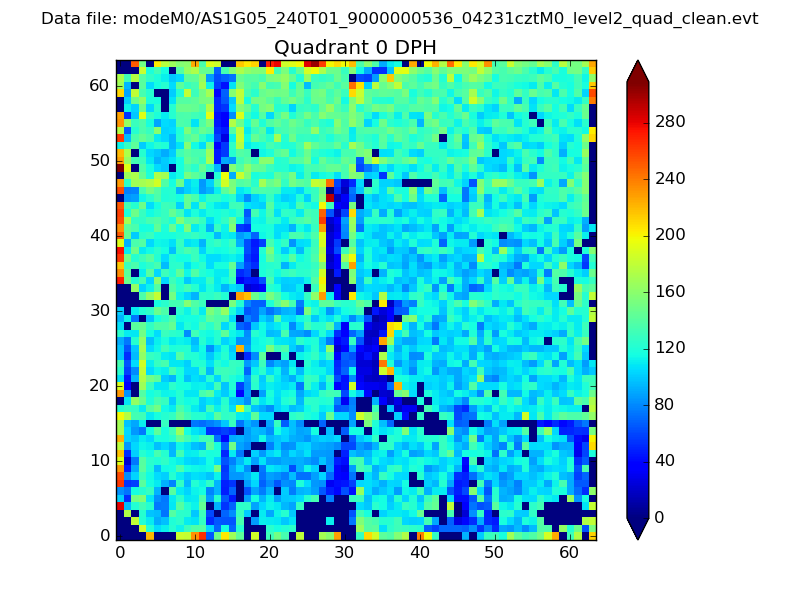 |
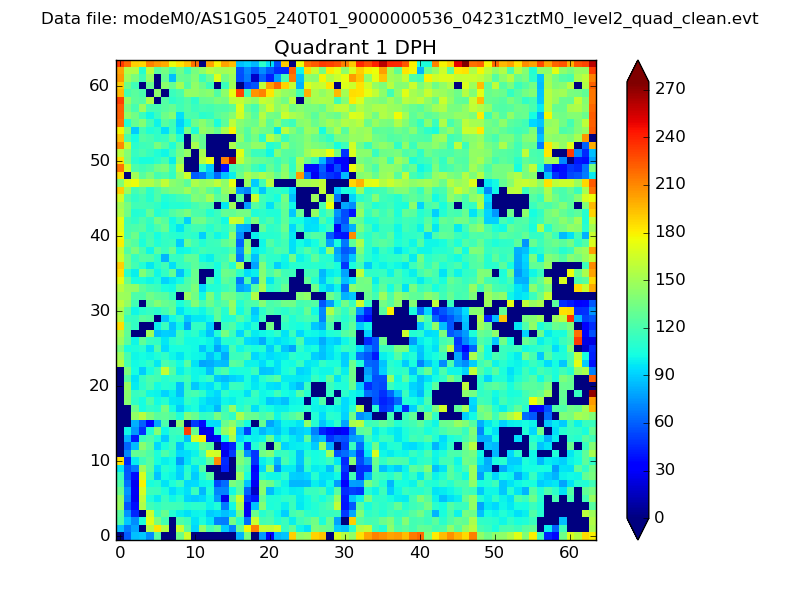 |
Quadrant B |
|---|---|---|---|
| Quadrant D | 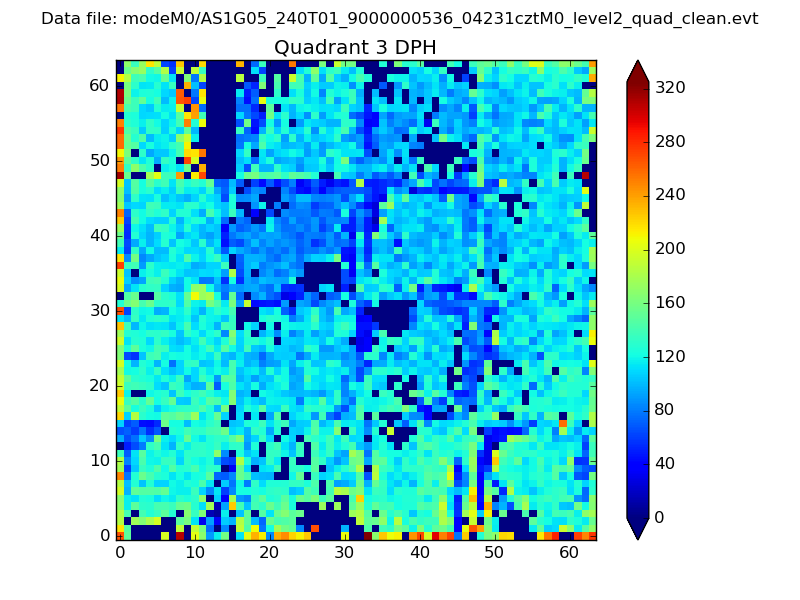 |
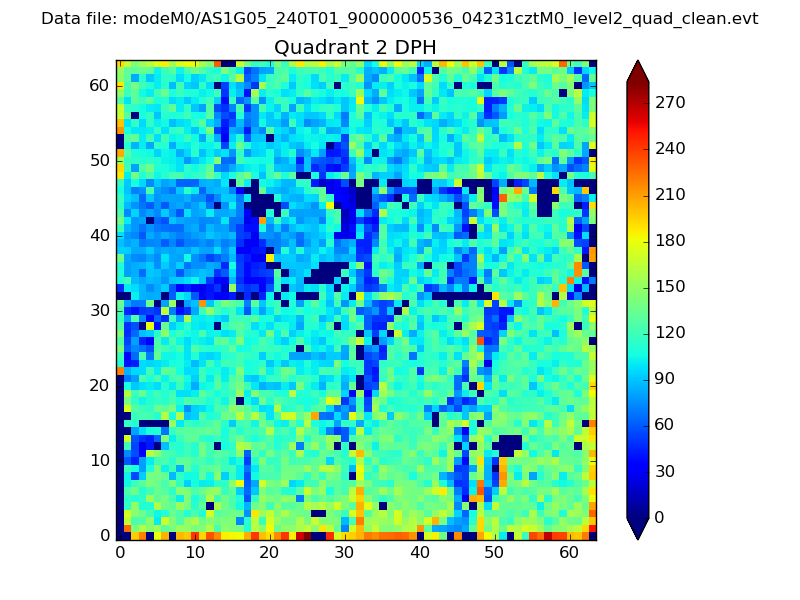 |
Quadrant C |
| Plot type | Count rate plots | Images |
|---|---|---|
| Comparison with Poisson distribution Blue bars denote a histogram of data divided into 1 sec bins. Red curve is a Poisson curve with rate = median count rate of data. |
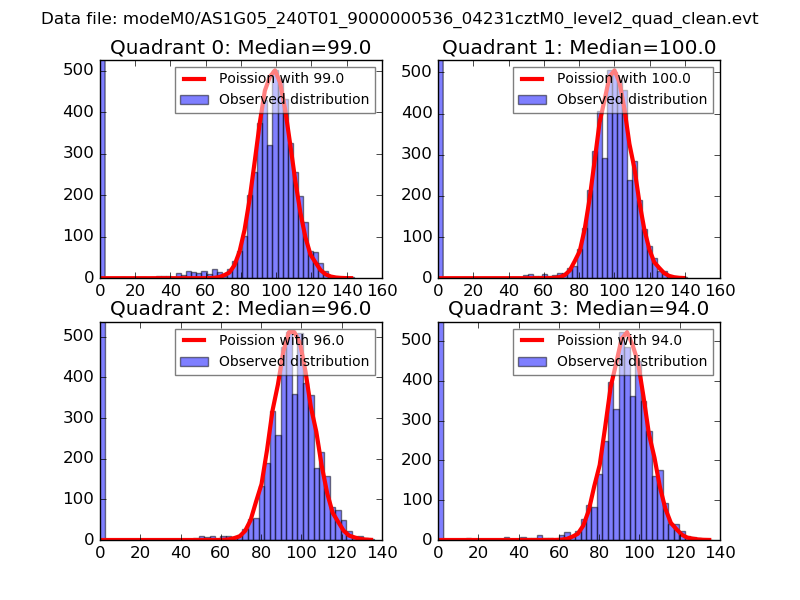 |
 |
| Quadrant-wise count rates Data is divided into 100 sec bins |
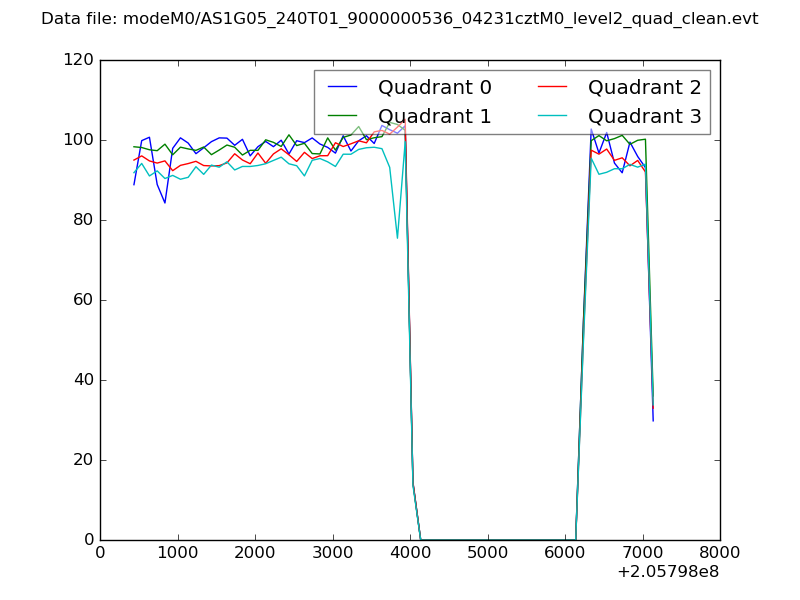 |
|
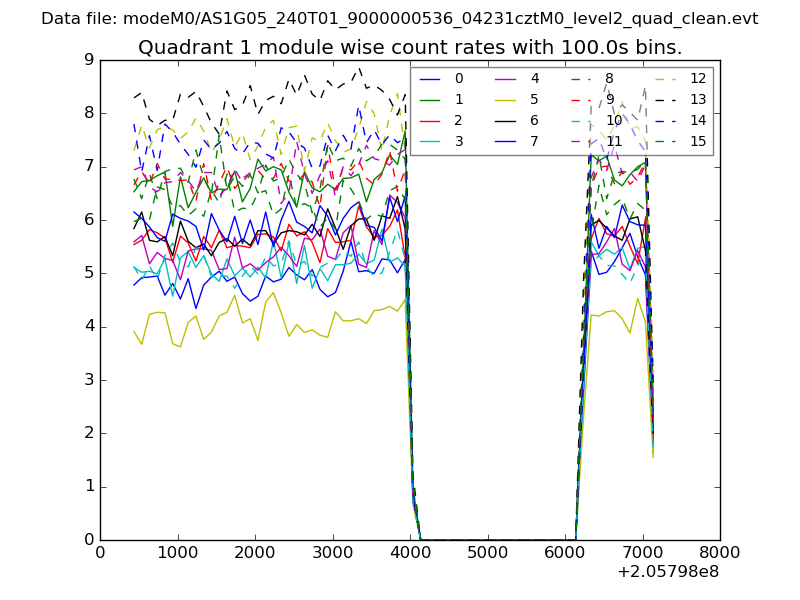
| Module-wise count rates for Quadrant A Data is divided into 100 sec bins |
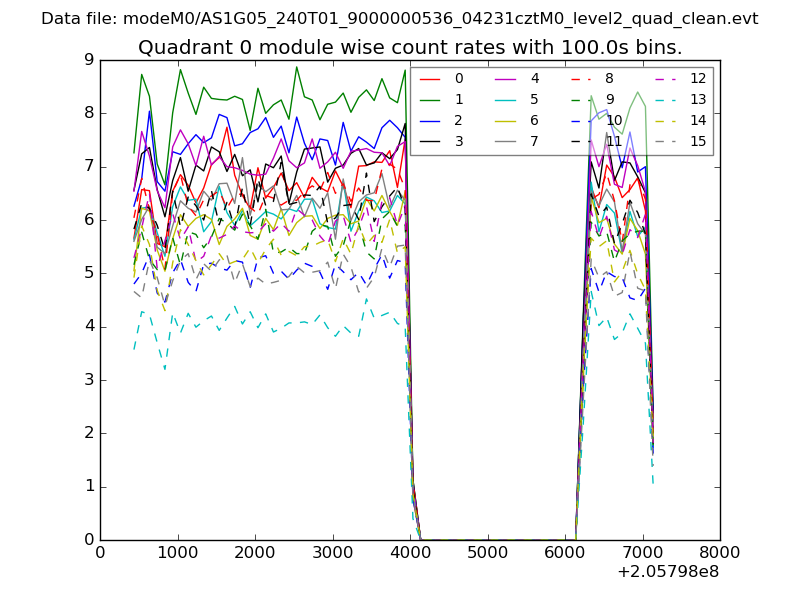 |
 |
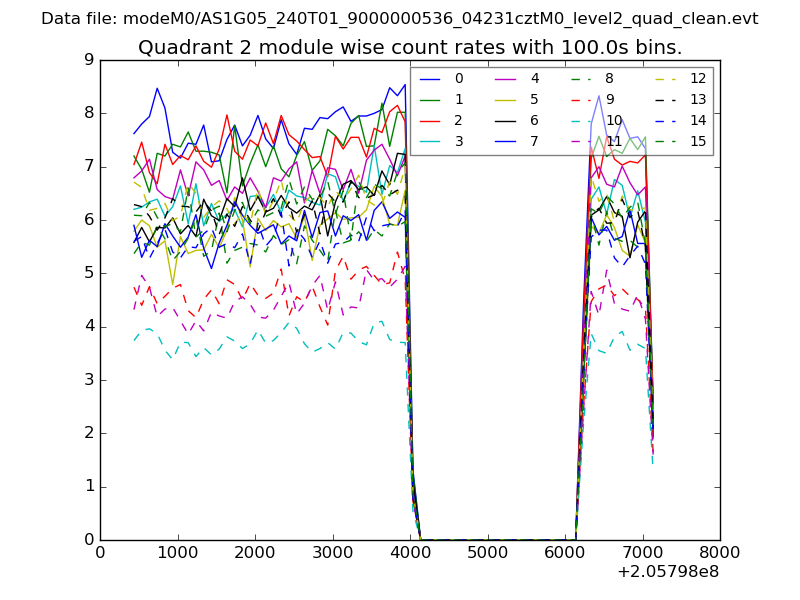
| Module-wise count rates for Quadrant B Data is divided into 100 sec bins |
 |
 |
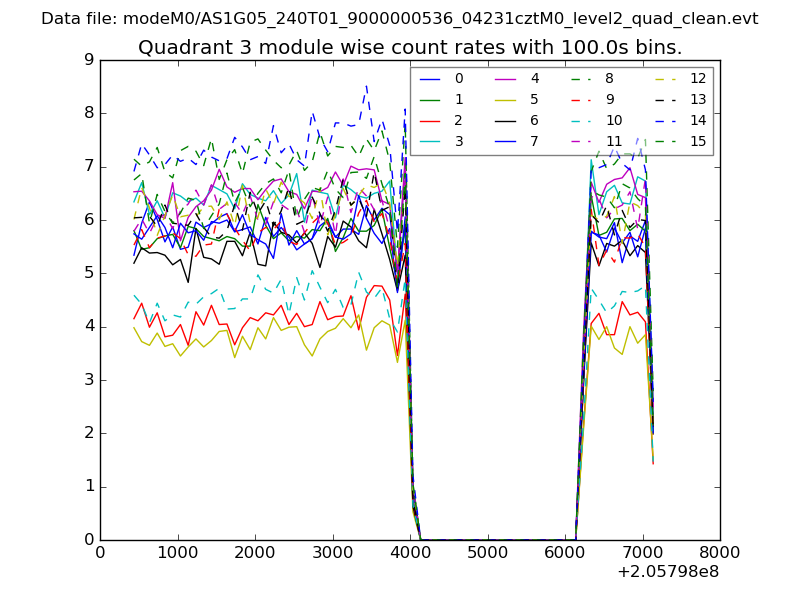
| Module-wise count rates for Quadrant C Data is divided into 100 sec bins |
 |
 |
| Module-wise count rates for Quadrant D Data is divided into 100 sec bins |
 |
 |
| Parameter | Plot |
|---|---|
| CZT HV Monitor | 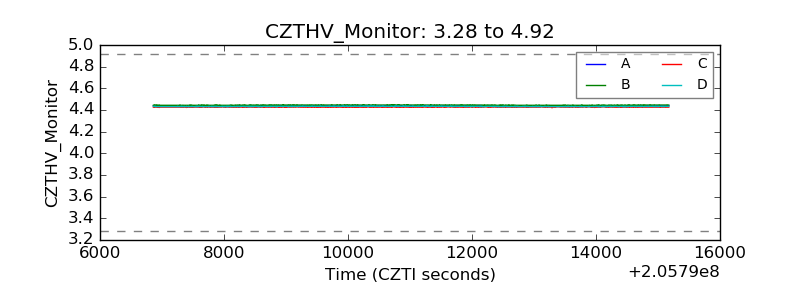 |
| D_VDD | 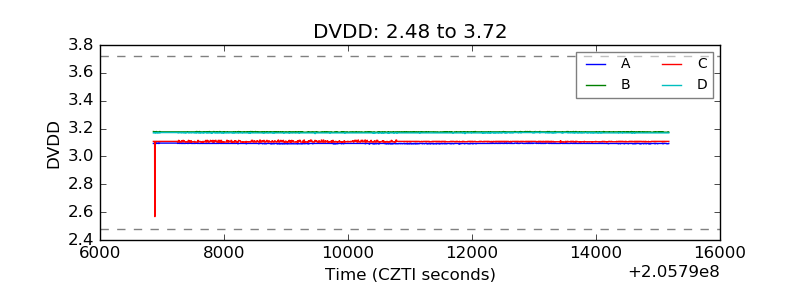 |
| Temperature 1 |  |
| Veto HV Monitor | 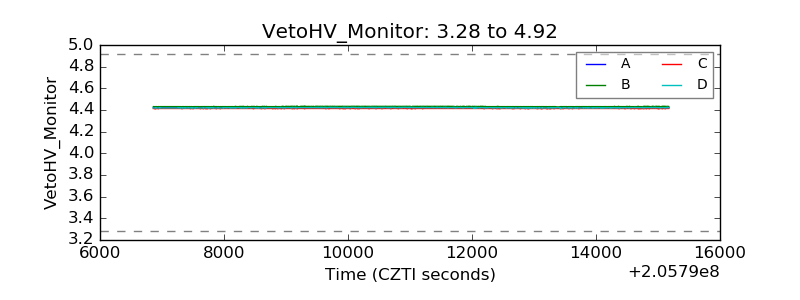 |
| Veto LLD |  |
| Alpha Counter | 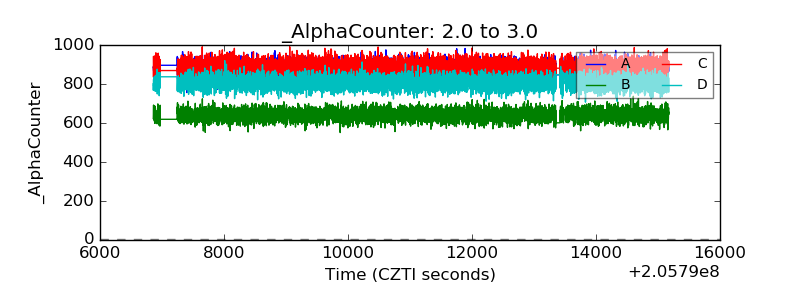 |
| _CPM_Rate | 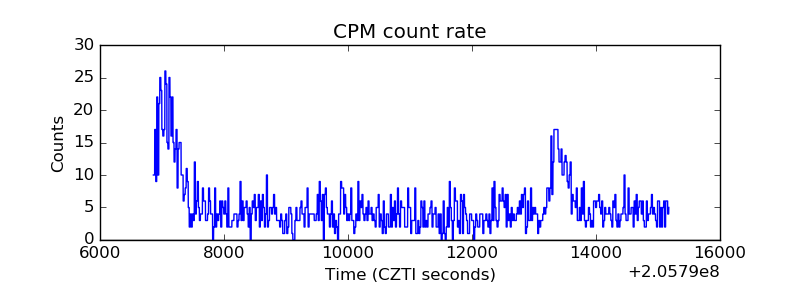 |
| CZT Counter | 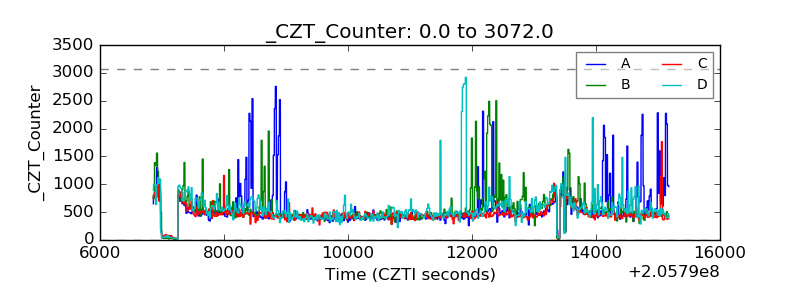 |
| +2.5 Volts monitor |  |
| +5 Volts monitor | 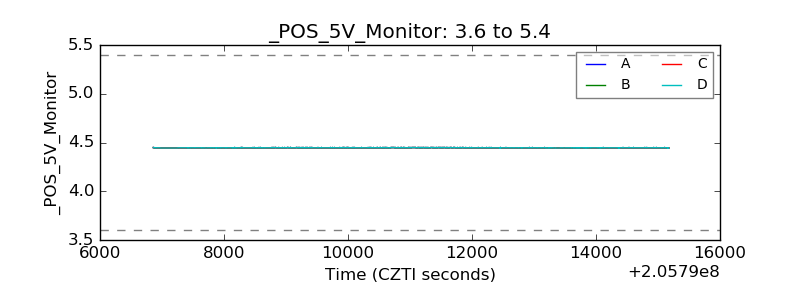 |
| _ROLL_ROT |  |
| _Roll_DEC | 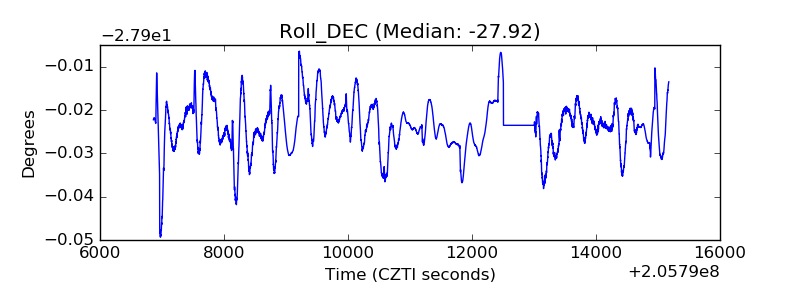 |
| _Roll_RA | 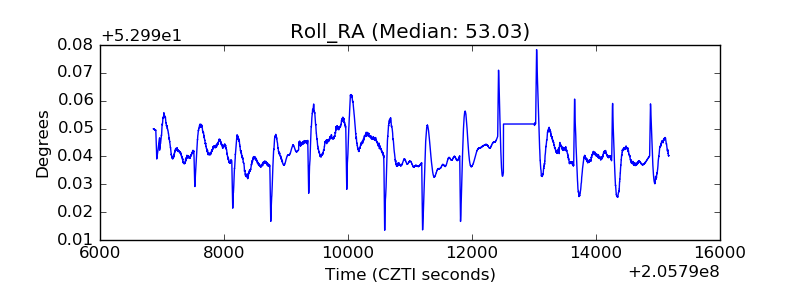 |
| Veto Counter | 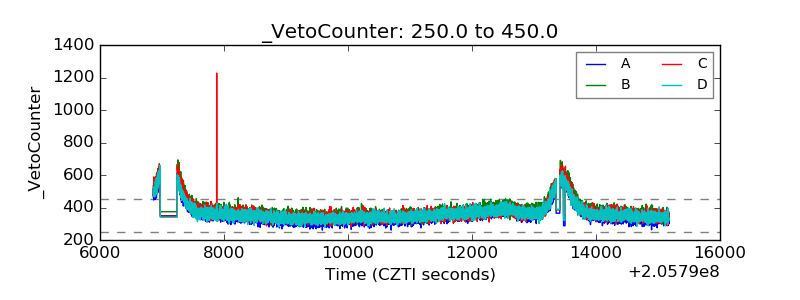 |