| Param | Original file | Final file |
|---|---|---|
| Filename | modeM0/AS1G05_240T01_9000000536_04232cztM0_level2.evt | modeM0/AS1G05_240T01_9000000536_04232cztM0_level2_quad_clean.evt |
| Size (bytes) | 603,688,320 | 81,901,440 |
| Size | 575.7 MB | 78.1 MB |
| Events in quadrant A | 5,492,482 | 474,369 |
| Events in quadrant B | 4,332,029 | 491,152 |
| Events in quadrant C | 3,799,537 | 483,192 |
| Events in quadrant D | 4,109,594 | 468,573 |
| Mode SS | |||
|---|---|---|---|
| Quadrant | BADHDUFLAG | Total packets | Discarded packets |
| A | 0 | 164 | 0 |
| B | 0 | 164 | 0 |
| C | 0 | 164 | 0 |
| D | 0 | 164 | 0 |
| Mode M9 | |||
|---|---|---|---|
| Quadrant | BADHDUFLAG | Total packets | Discarded packets |
| A | 0 | 5 | 0 |
| B | 0 | 5 | 0 |
| C | 0 | 5 | 0 |
| D | 0 | 5 | 0 |
| Mode M0 | |||
|---|---|---|---|
| Quadrant | BADHDUFLAG | Total packets | Discarded packets |
| A | 0 | 21931 | 7 |
| B | 0 | 18369 | 2 |
| C | 0 | 17035 | 6 |
| D | 0 | 17940 | 6 |
| Quadrant | Total seconds | Saturated seconds | Saturation percentage |
|---|---|---|---|
| A | 8106 | 633 | 7.809030% |
| B | 8108 | 258 | 3.182042% |
| C | 8106 | 133 | 1.640760% |
| D | 8106 | 141 | 1.739452% |
Noise dominated data is calculated using 1-second bins in cleaned event files. If a bin has >2000 counts, and if more than 50% of those come from <1% of pixels, then it is considered to be noise-dominated and hence unusable.
| Quadrant | # 1 sec bins | Bins with >0 counts | Bins with >2000 counts | High rate bins dominated by noise | Noise dominated (total time) | Noise dominated (detector-on time) | Marked lightcurve |
|---|---|---|---|---|---|---|---|
| A | 8488 | 8111 | 378 | 378 | 4.45% | 4.66% |  |
| B | 8488 | 8111 | 31 | 31 | 0.37% | 0.38% | 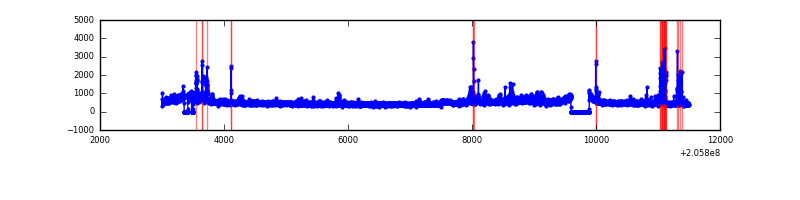 |
| C | 8488 | 8111 | 11 | 11 | 0.13% | 0.14% | 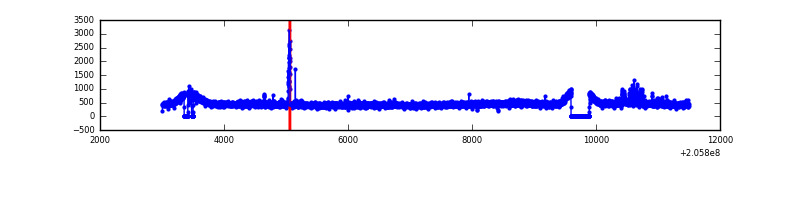 |
| D | 8488 | 8111 | 28 | 28 | 0.33% | 0.35% | 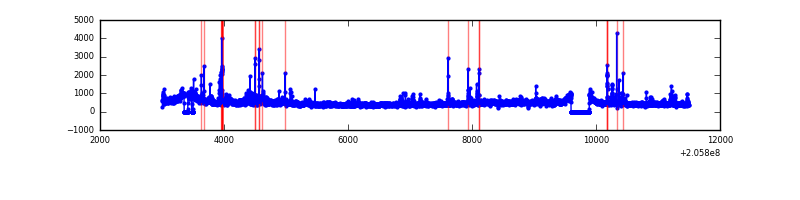 |
Top three noisy pixels from each quadrant. If the there are fewer than three noisy pixels in the level2.evt file, extra rows are filled as -1
| Pixel properties | Quadrant properties | ||||||
|---|---|---|---|---|---|---|---|
| Quadrant | DetID | PixID | Counts | Sigma | Mean | Median | Sigma |
| A | 0 | 50 | 1547307 | 7960.99 | 935 | 911 | 194.2 |
| A | 15 | 234 | 162063 | 829.63 | 935 | 911 | 194.2 |
| A | 12 | 247 | 129505 | 662.01 | 935 | 911 | 194.2 |
| B | 15 | 204 | 235286 | 1239.1 | 965 | 939 | 189.1 |
| B | 14 | 167 | 146128 | 767.68 | 965 | 939 | 189.1 |
| B | 4 | 170 | 91752 | 480.17 | 965 | 939 | 189.1 |
| C | 7 | 247 | 61579 | 277.54 | 933 | 934 | 218.5 |
| C | 10 | 65 | 55883 | 251.47 | 933 | 934 | 218.5 |
| C | 9 | 144 | 40819 | 182.53 | 933 | 934 | 218.5 |
| D | 11 | 132 | 294351 | 1305.6 | 926 | 900 | 224.8 |
| D | 1 | 52 | 98153 | 432.69 | 926 | 900 | 224.8 |
| D | 9 | 85 | 61164 | 268.12 | 926 | 900 | 224.8 |
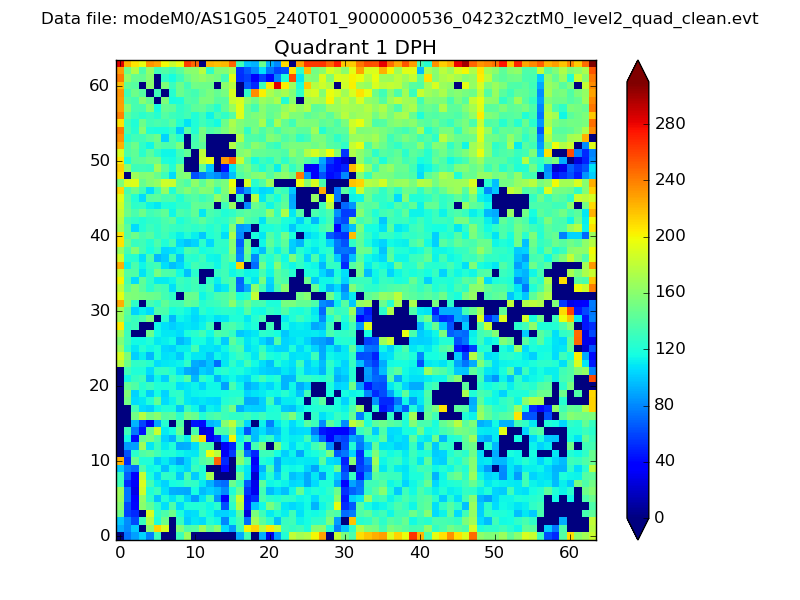
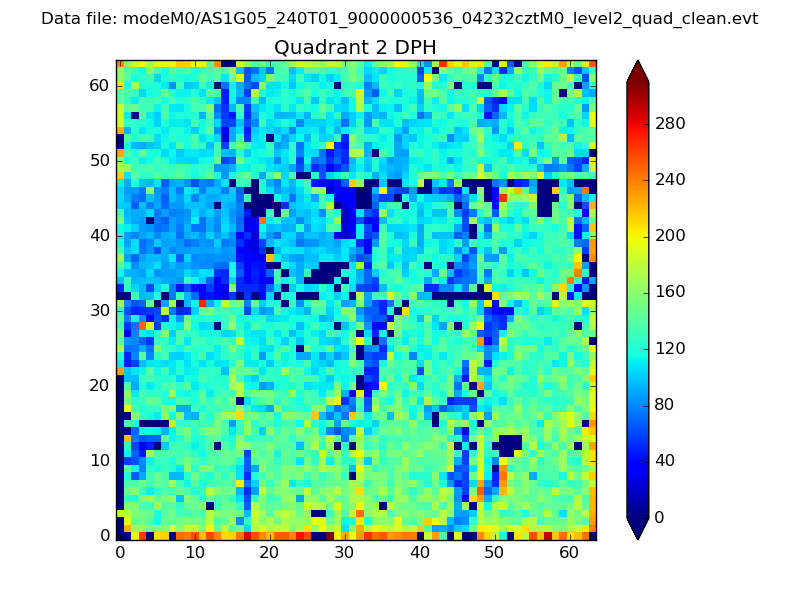
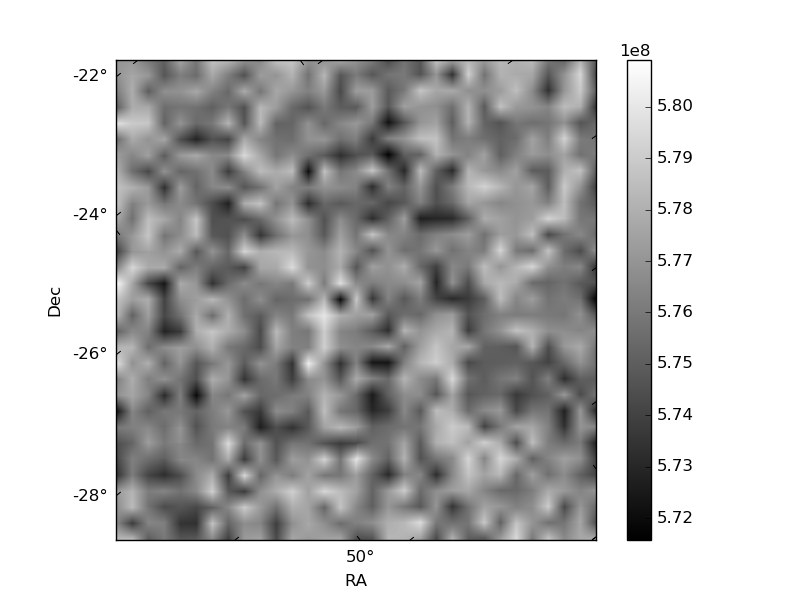
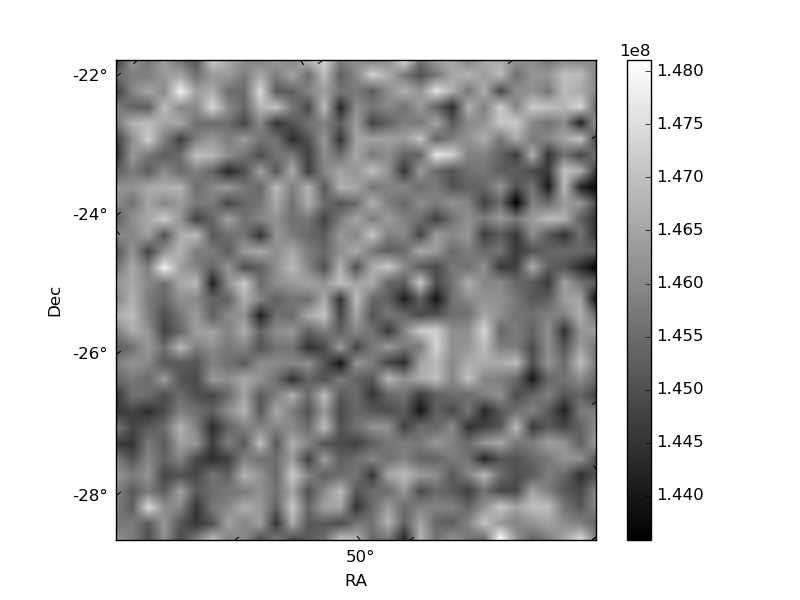
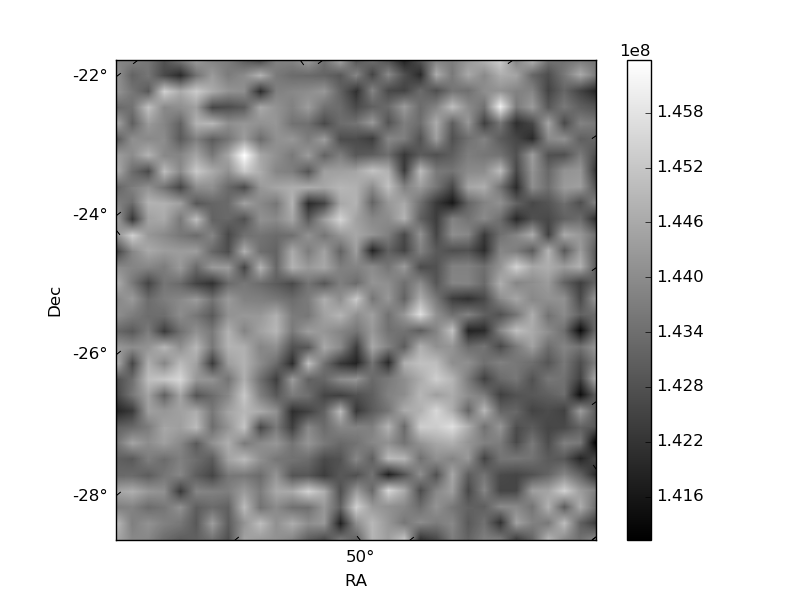
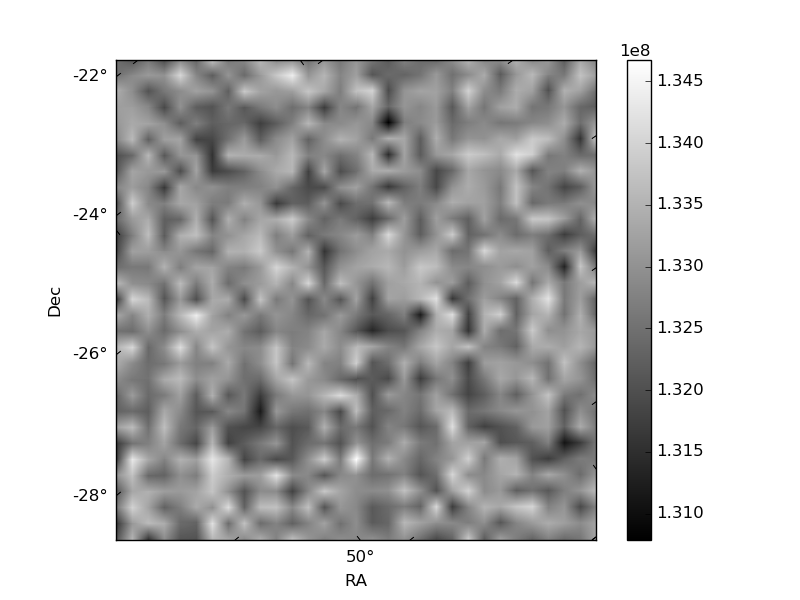
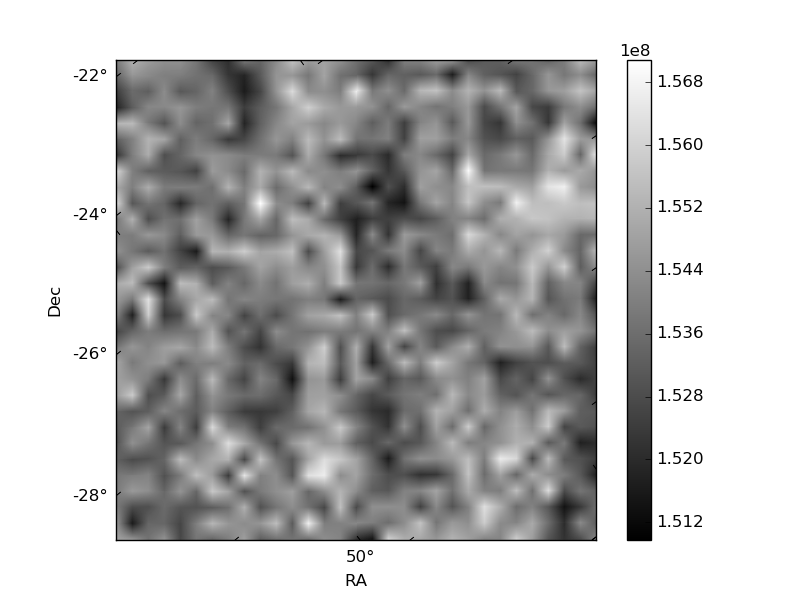
Histogram calculated using DETX and DETY for each event in the final _common_clean file
| Quadrant A | 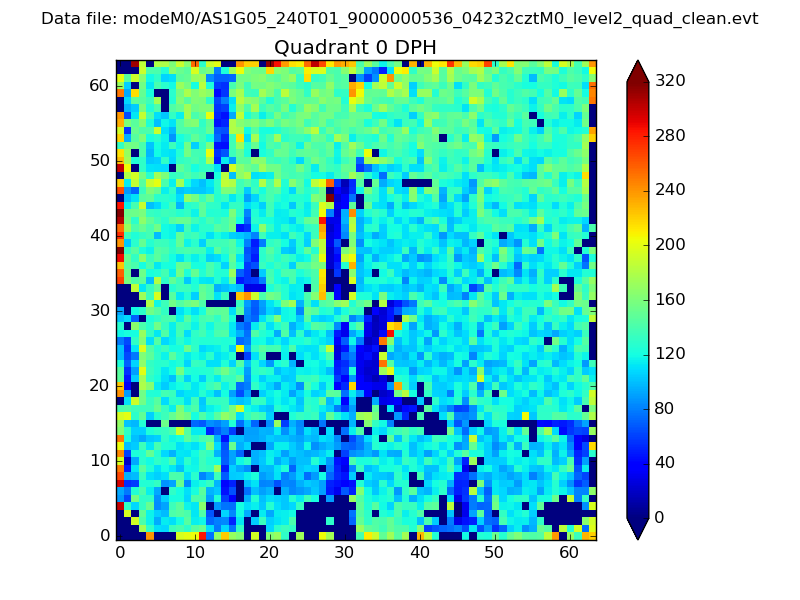 |
 |
Quadrant B |
|---|---|---|---|
| Quadrant D | 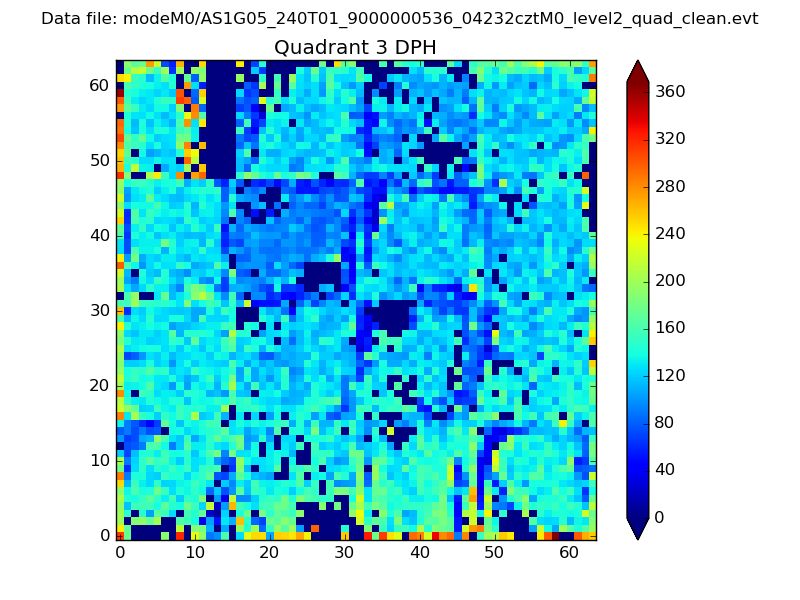 |
 |
Quadrant C |
| Plot type | Count rate plots | Images |
|---|---|---|
| Comparison with Poisson distribution Blue bars denote a histogram of data divided into 1 sec bins. Red curve is a Poisson curve with rate = median count rate of data. |
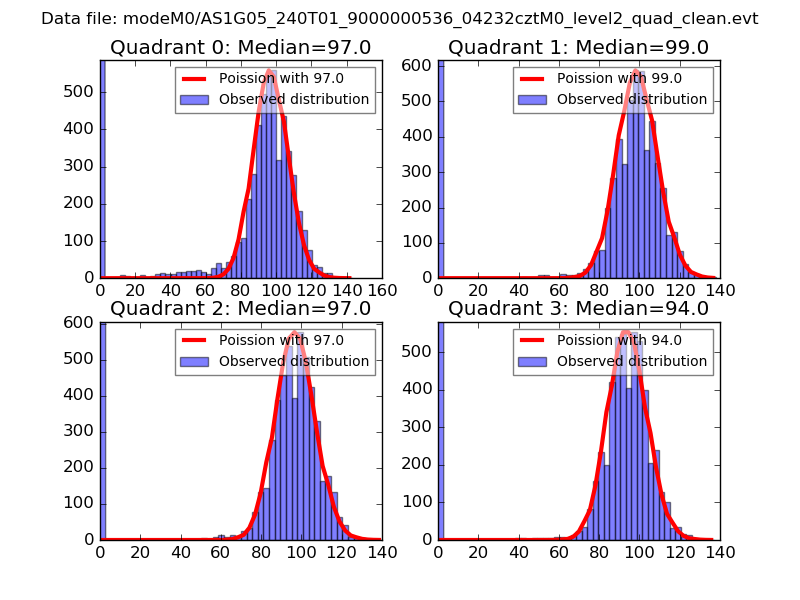 |
 |
| Quadrant-wise count rates Data is divided into 100 sec bins |
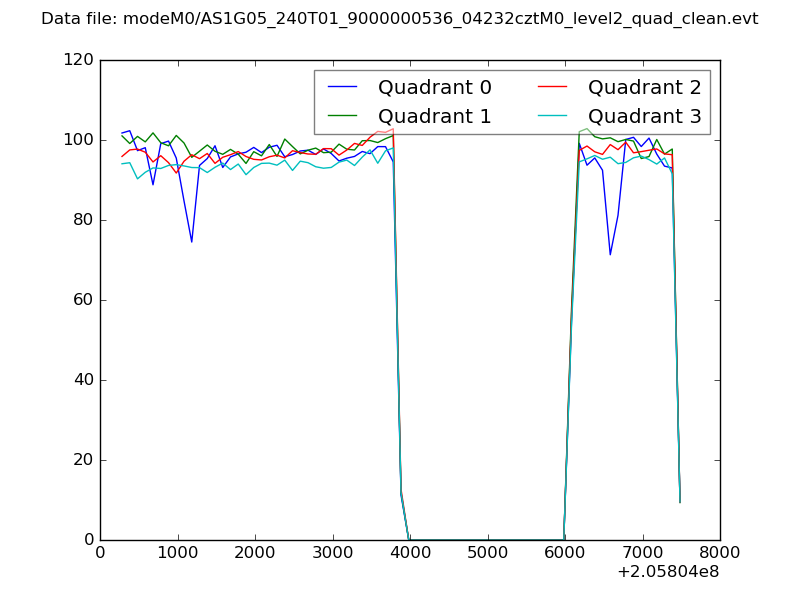 |
|
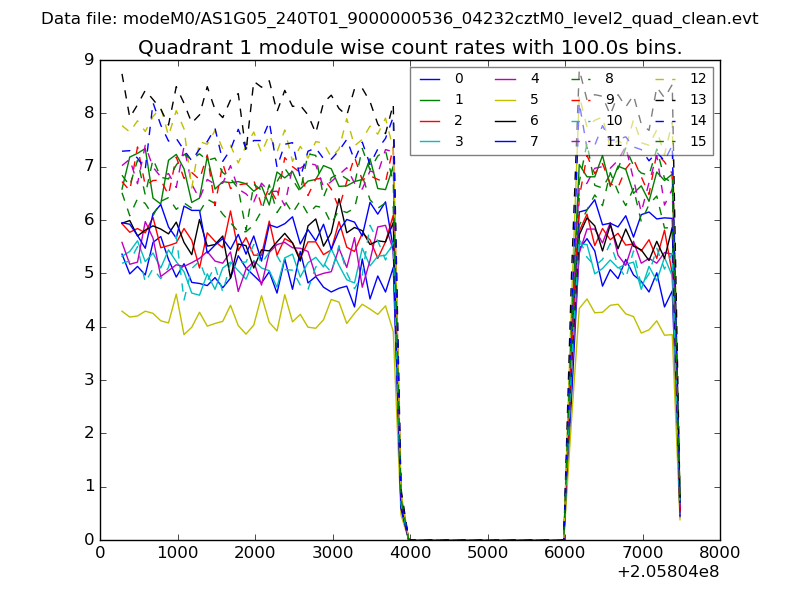
| Module-wise count rates for Quadrant A Data is divided into 100 sec bins |
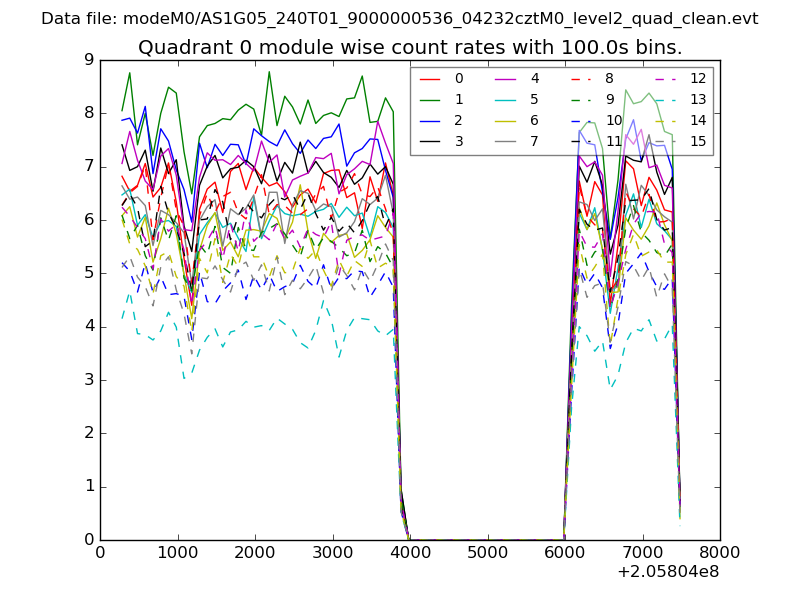 |
 |
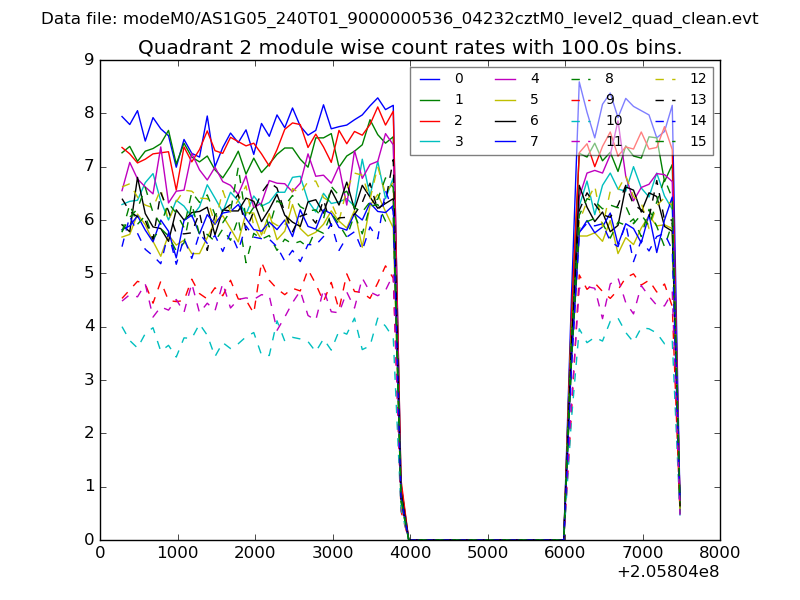
| Module-wise count rates for Quadrant B Data is divided into 100 sec bins |
 |
 |
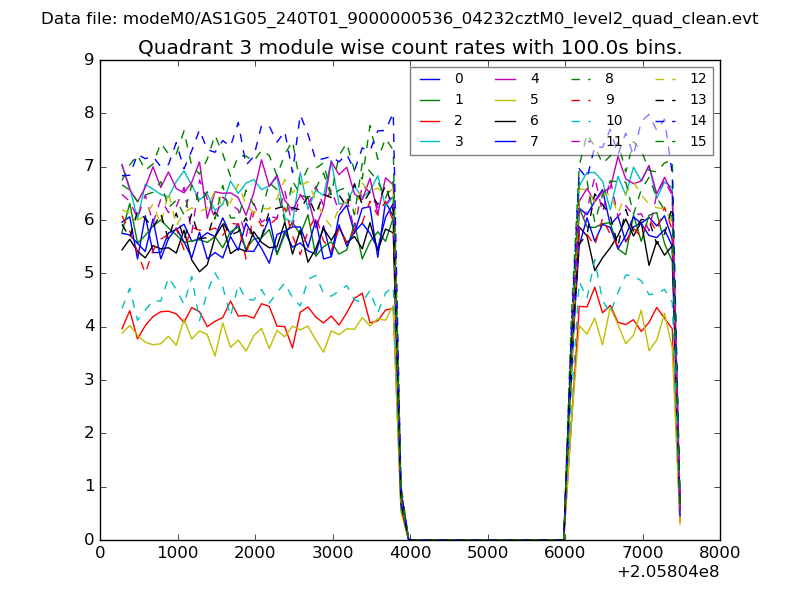
| Module-wise count rates for Quadrant C Data is divided into 100 sec bins |
 |
 |
| Module-wise count rates for Quadrant D Data is divided into 100 sec bins |
 |
 |
| Parameter | Plot |
|---|---|
| CZT HV Monitor | 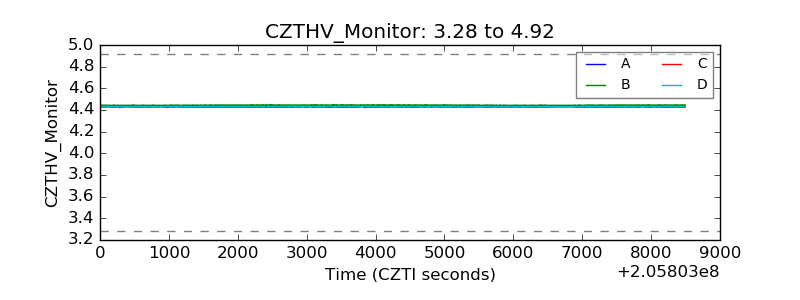 |
| D_VDD | 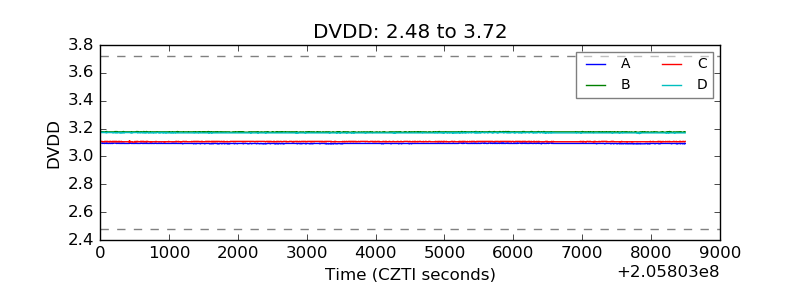 |
| Temperature 1 | 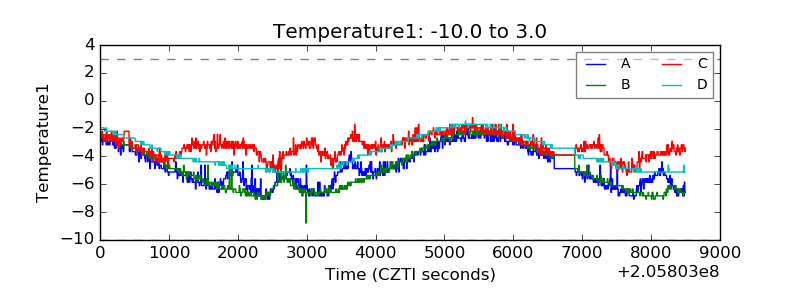 |
| Veto HV Monitor | 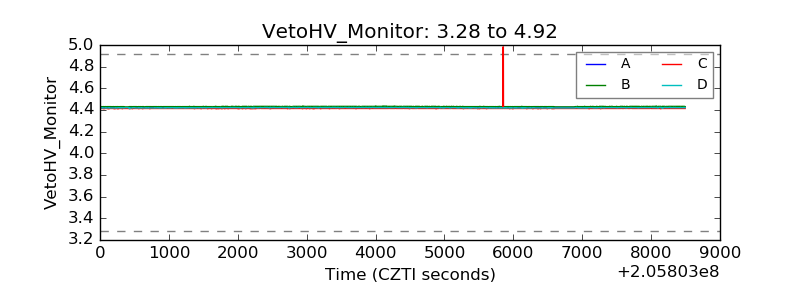 |
| Veto LLD | 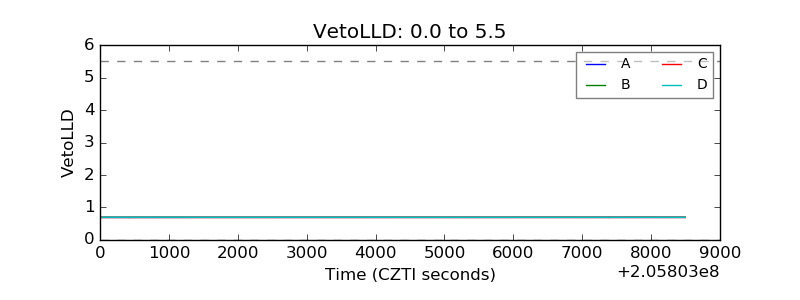 |
| Alpha Counter | 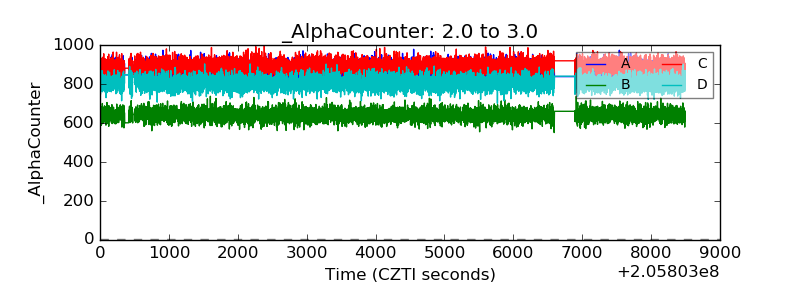 |
| _CPM_Rate | 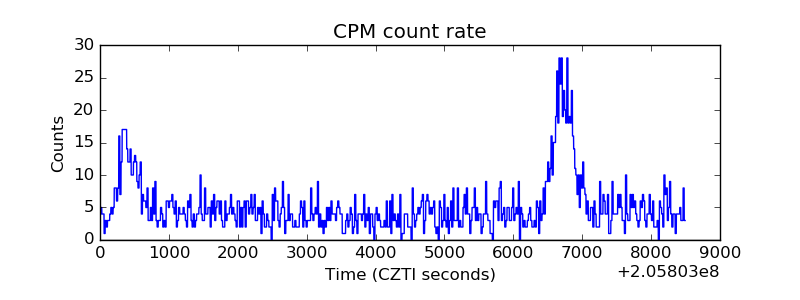 |
| CZT Counter | 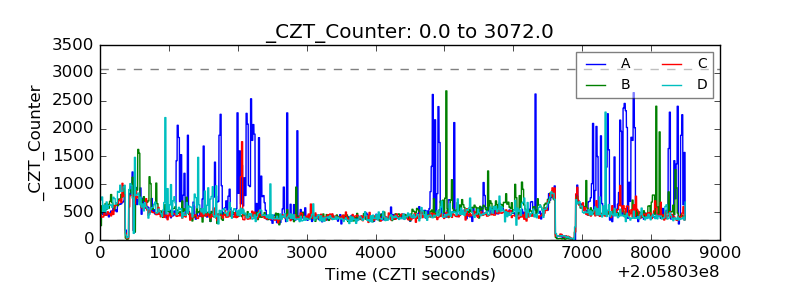 |
| +2.5 Volts monitor |  |
| +5 Volts monitor |  |
| _ROLL_ROT | 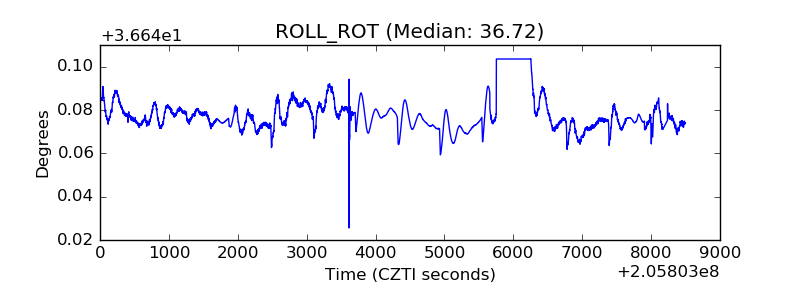 |
| _Roll_DEC | 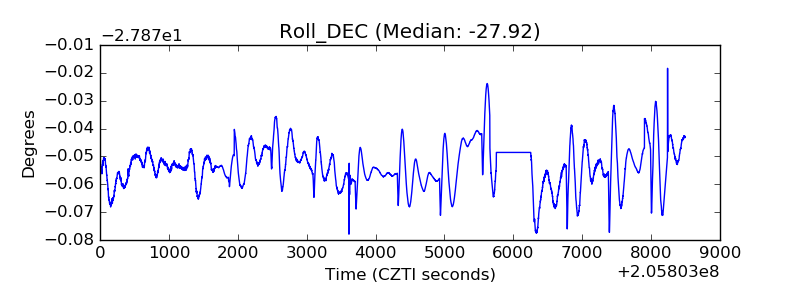 |
| _Roll_RA | 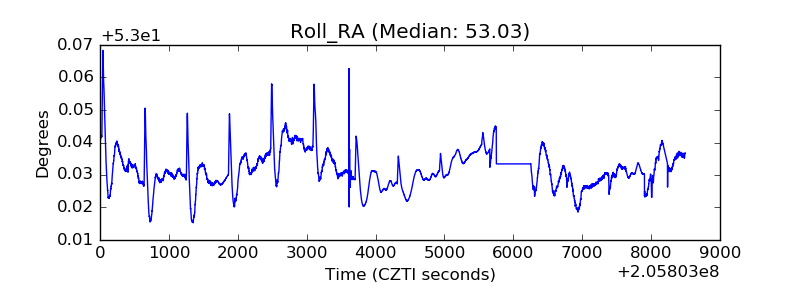 |
| Veto Counter | 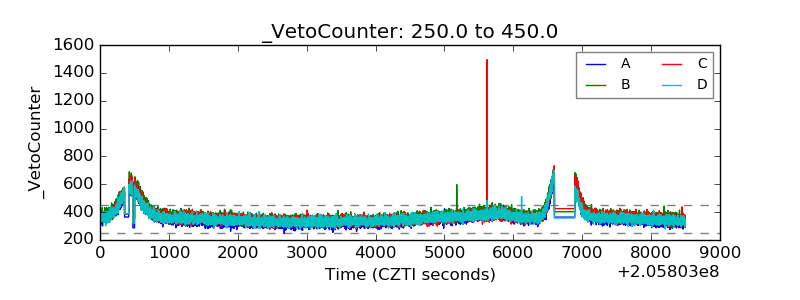 |