| Param | Original file | Final file |
|---|---|---|
| Filename | modeM0/AS1G05_240T01_9000000536_04234cztM0_level2.evt | modeM0/AS1G05_240T01_9000000536_04234cztM0_level2_quad_clean.evt |
| Size (bytes) | 927,023,040 | 134,015,040 |
| Size | 884.1 MB | 127.8 MB |
| Events in quadrant A | 7,541,675 | 792,911 |
| Events in quadrant B | 6,688,465 | 804,370 |
| Events in quadrant C | 6,373,115 | 800,793 |
| Events in quadrant D | 6,595,072 | 765,510 |
| Mode SS | |||
|---|---|---|---|
| Quadrant | BADHDUFLAG | Total packets | Discarded packets |
| A | 0 | 272 | 4 |
| B | 0 | 272 | 6 |
| C | 0 | 272 | 2 |
| D | 0 | 272 | 4 |
| Mode M9 | |||
|---|---|---|---|
| Quadrant | BADHDUFLAG | Total packets | Discarded packets |
| A | 0 | 15 | 1 |
| B | 0 | 15 | 1 |
| C | 0 | 15 | 1 |
| D | 0 | 15 | 0 |
| Mode M0 | |||
|---|---|---|---|
| Quadrant | BADHDUFLAG | Total packets | Discarded packets |
| A | 0 | 32543 | 977 |
| B | 0 | 29638 | 891 |
| C | 0 | 28800 | 771 |
| D | 0 | 29676 | 799 |
| Quadrant | Total seconds | Saturated seconds | Saturation percentage |
|---|---|---|---|
| A | 12916 | 621 | 4.807990% |
| B | 12931 | 219 | 1.693605% |
| C | 12951 | 131 | 1.011505% |
| D | 12928 | 289 | 2.235458% |
Noise dominated data is calculated using 1-second bins in cleaned event files. If a bin has >2000 counts, and if more than 50% of those come from <1% of pixels, then it is considered to be noise-dominated and hence unusable.
| Quadrant | # 1 sec bins | Bins with >0 counts | Bins with >2000 counts | High rate bins dominated by noise | Noise dominated (total time) | Noise dominated (detector-on time) | Marked lightcurve |
|---|---|---|---|---|---|---|---|
| A | 14867 | 13113 | 349 | 349 | 2.35% | 2.66% |  |
| B | 14867 | 13112 | 41 | 41 | 0.28% | 0.31% |  |
| C | 14867 | 13141 | 3 | 3 | 0.02% | 0.02% | 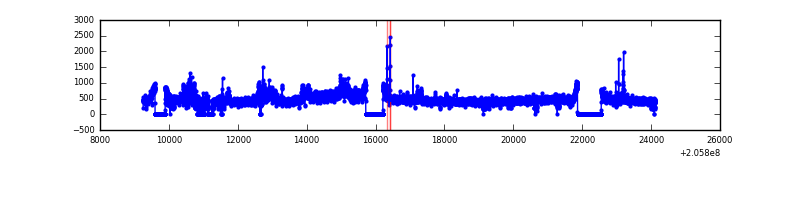 |
| D | 14867 | 13118 | 140 | 140 | 0.94% | 1.07% |  |
Top three noisy pixels from each quadrant. If the there are fewer than three noisy pixels in the level2.evt file, extra rows are filled as -1
| Pixel properties | Quadrant properties | ||||||
|---|---|---|---|---|---|---|---|
| Quadrant | DetID | PixID | Counts | Sigma | Mean | Median | Sigma |
| A | 0 | 50 | 1633097 | 5414.9 | 1467 | 1435 | 301.3 |
| A | 12 | 247 | 114378 | 374.82 | 1467 | 1435 | 301.3 |
| A | 15 | 234 | 70444 | 229.02 | 1467 | 1435 | 301.3 |
| B | 15 | 204 | 321117 | 1101.7 | 1508 | 1473 | 290.1 |
| B | 3 | 0 | 234182 | 802.07 | 1508 | 1473 | 290.1 |
| B | 14 | 167 | 140877 | 480.48 | 1508 | 1473 | 290.1 |
| C | 9 | 144 | 519646 | 1514.53 | 1460 | 1468 | 342.1 |
| C | 7 | 247 | 71723 | 205.34 | 1460 | 1468 | 342.1 |
| C | 10 | 65 | 49415 | 140.14 | 1460 | 1468 | 342.1 |
| D | 2 | 232 | 241567 | 693.28 | 1438 | 1396 | 346.4 |
| D | 2 | 63 | 224899 | 645.17 | 1438 | 1396 | 346.4 |
| D | 15 | 217 | 131280 | 374.92 | 1438 | 1396 | 346.4 |
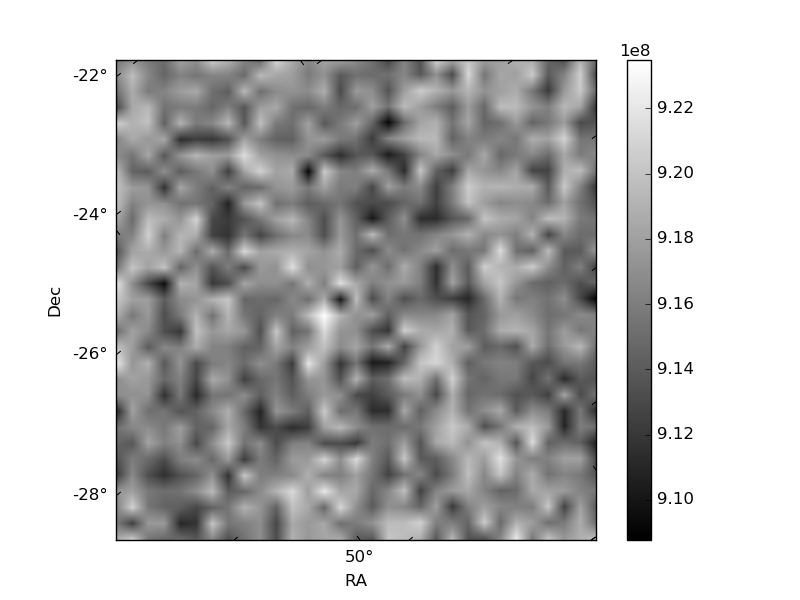
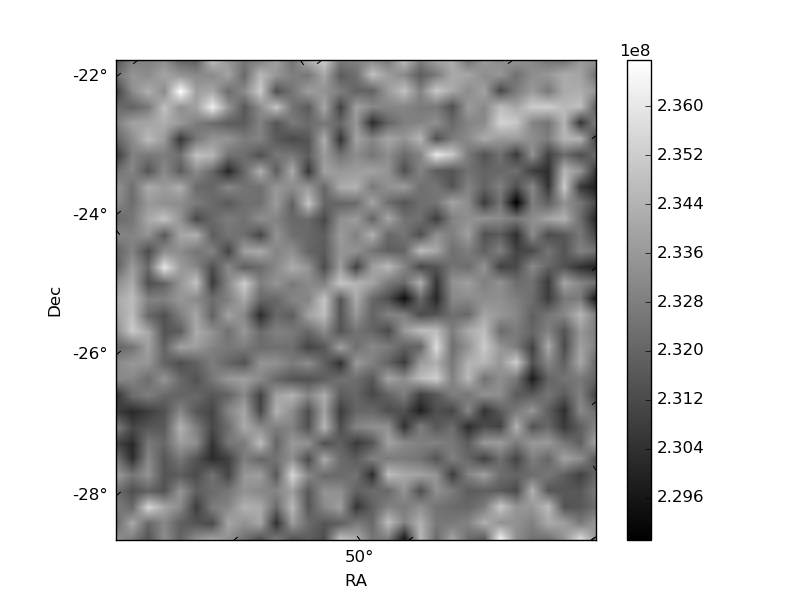
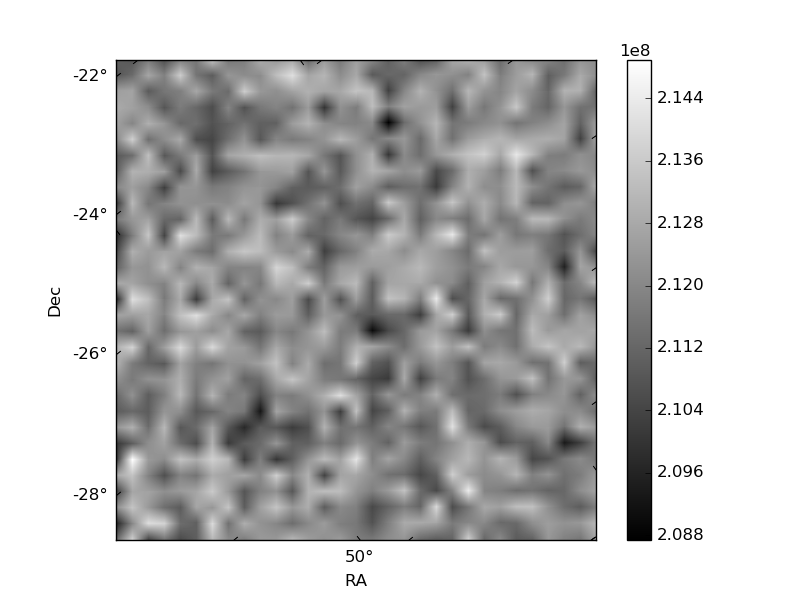
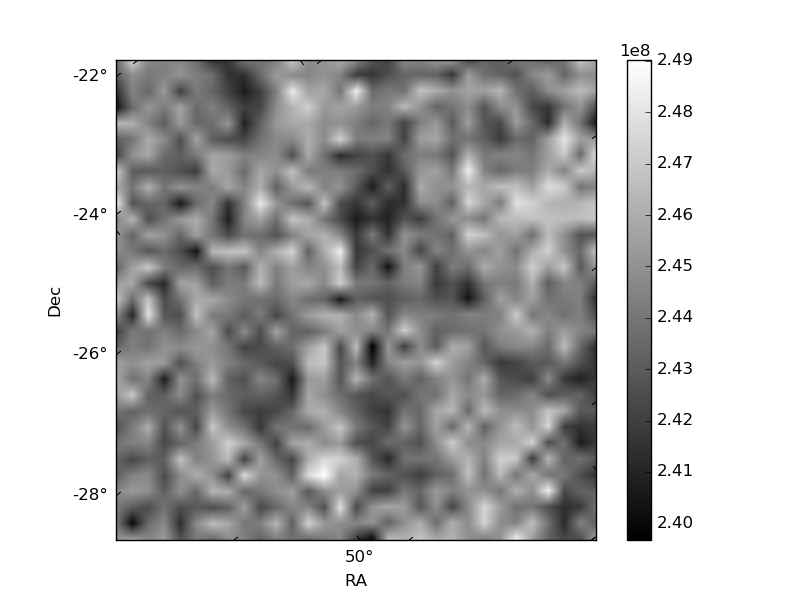
Histogram calculated using DETX and DETY for each event in the final _common_clean file
| Quadrant A | 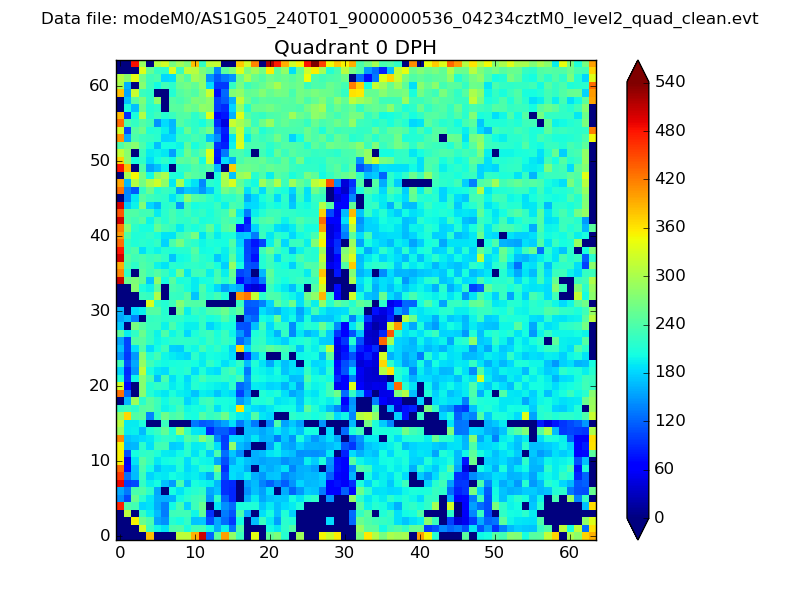 |
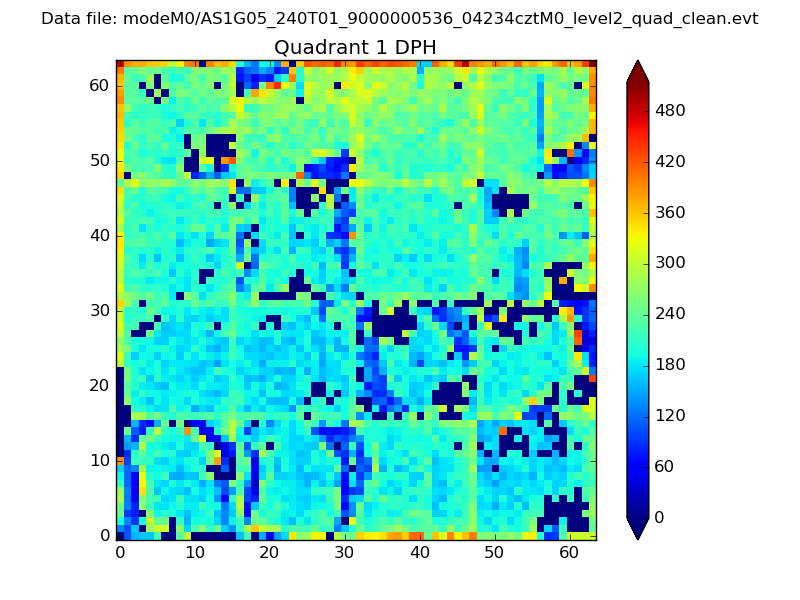 |
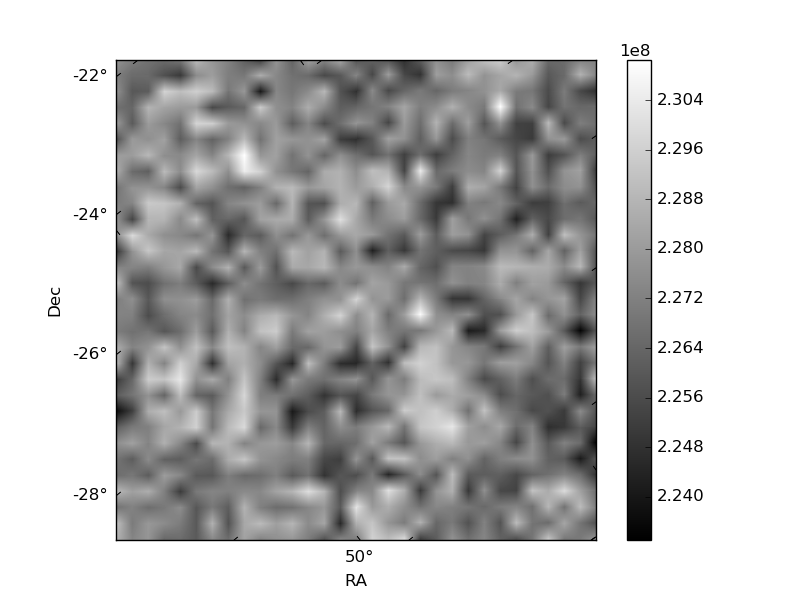
Quadrant B |
|---|---|---|---|
| Quadrant D |  |
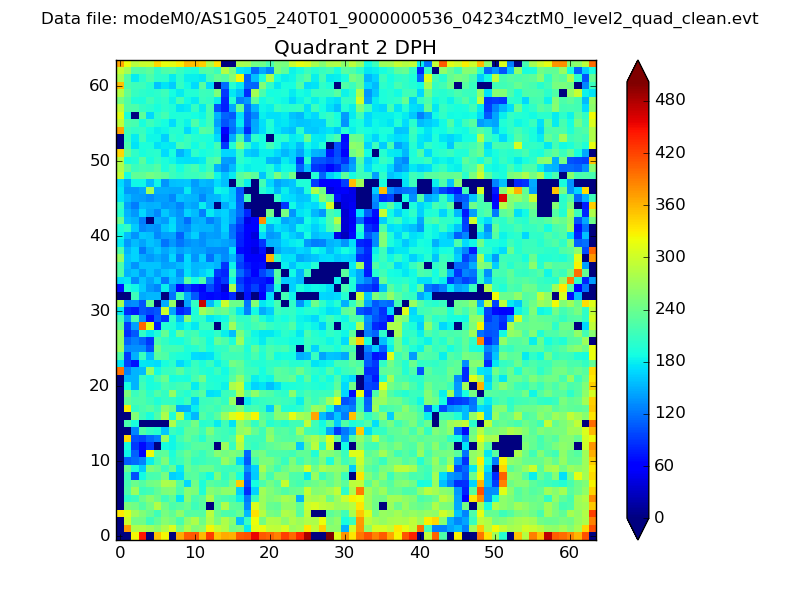 |
Quadrant C |
| Plot type | Count rate plots | Images |
|---|---|---|
| Comparison with Poisson distribution Blue bars denote a histogram of data divided into 1 sec bins. Red curve is a Poisson curve with rate = median count rate of data. |
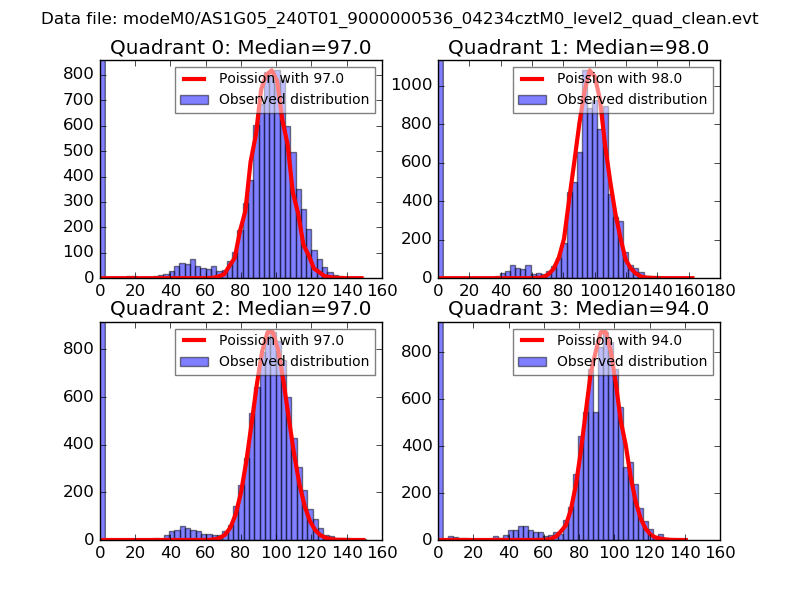 |
 |
| Quadrant-wise count rates Data is divided into 100 sec bins |
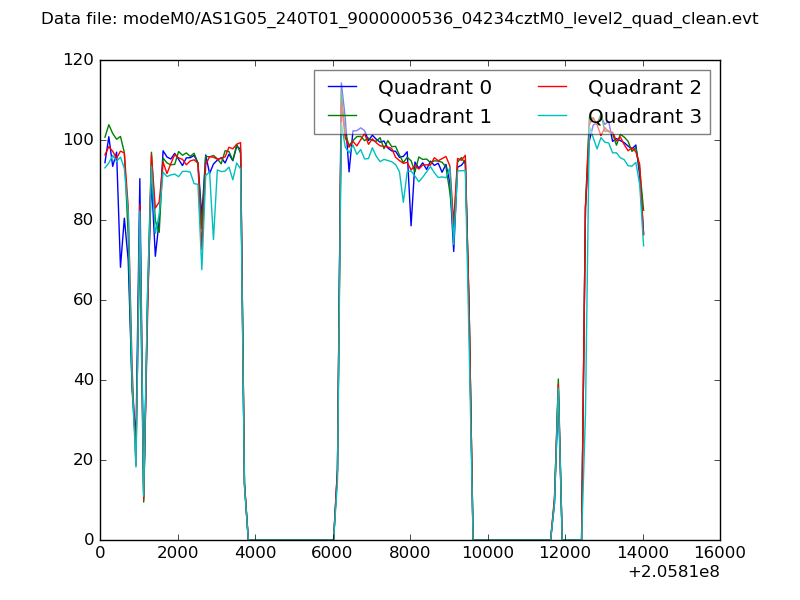 |
|
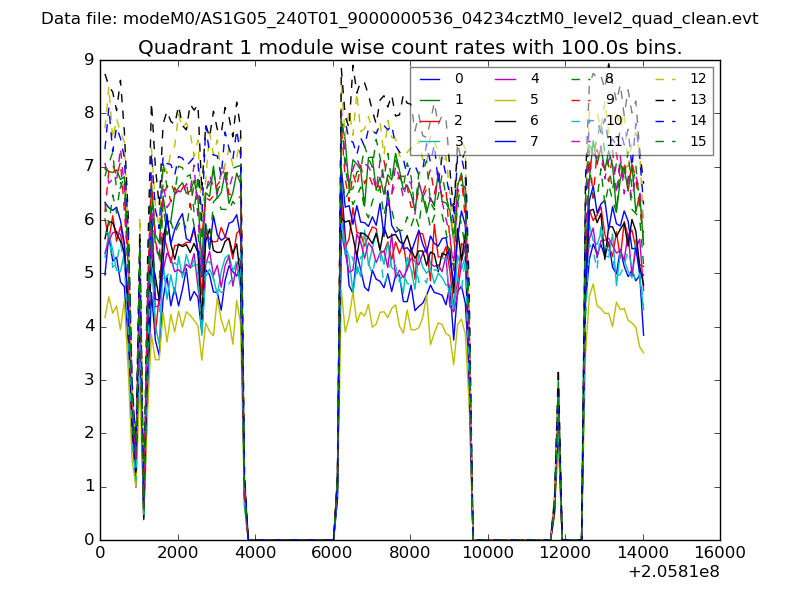
| Module-wise count rates for Quadrant A Data is divided into 100 sec bins |
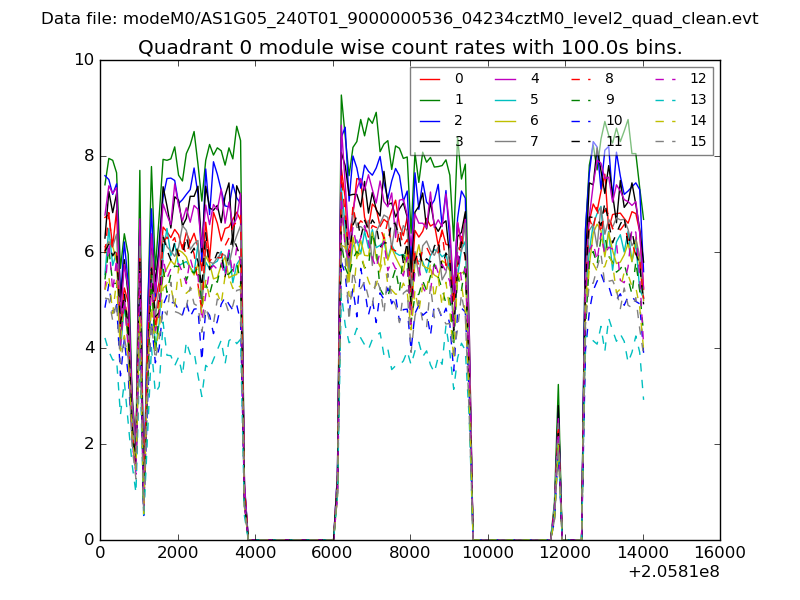 |
 |
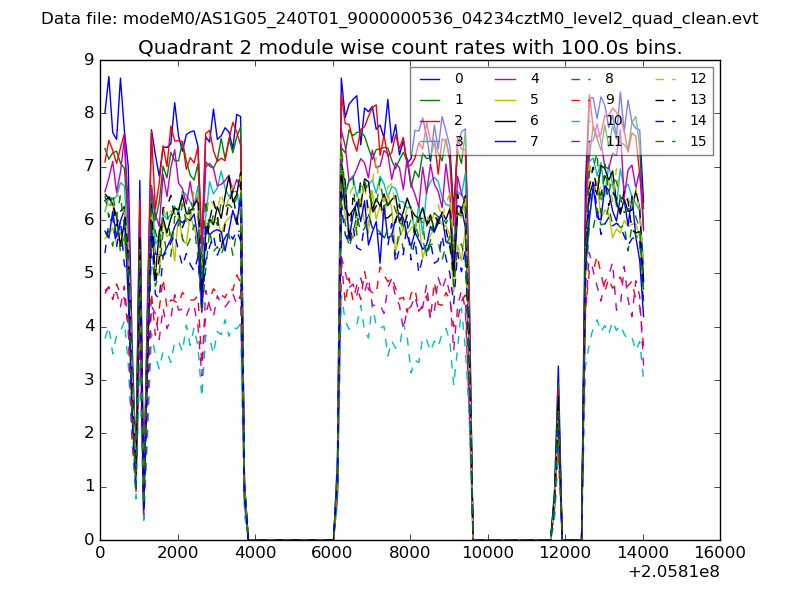
| Module-wise count rates for Quadrant B Data is divided into 100 sec bins |
 |
 |
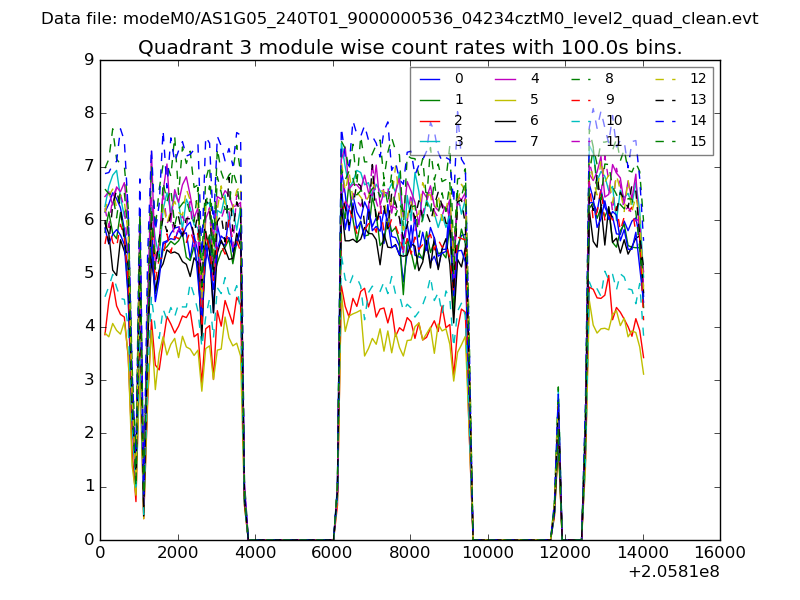
| Module-wise count rates for Quadrant C Data is divided into 100 sec bins |
 |
 |
| Module-wise count rates for Quadrant D Data is divided into 100 sec bins |
 |
 |
| Parameter | Plot |
|---|---|
| CZT HV Monitor | 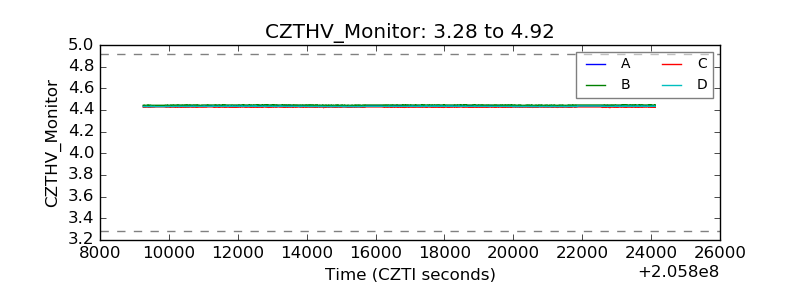 |
| D_VDD | 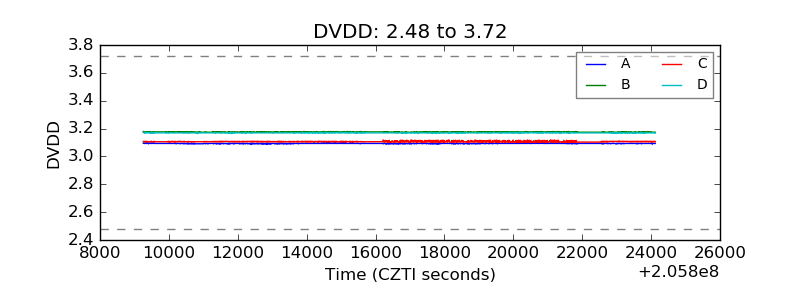 |
| Temperature 1 |  |
| Veto HV Monitor | 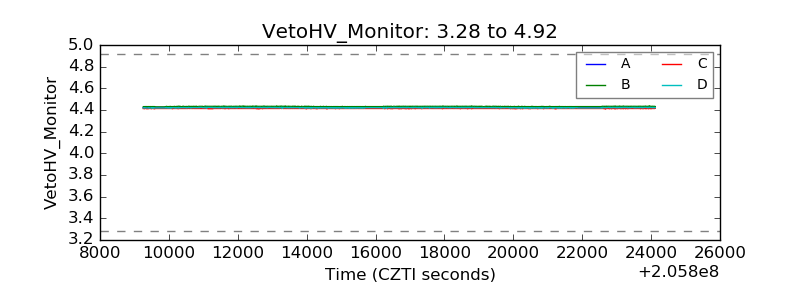 |
| Veto LLD | 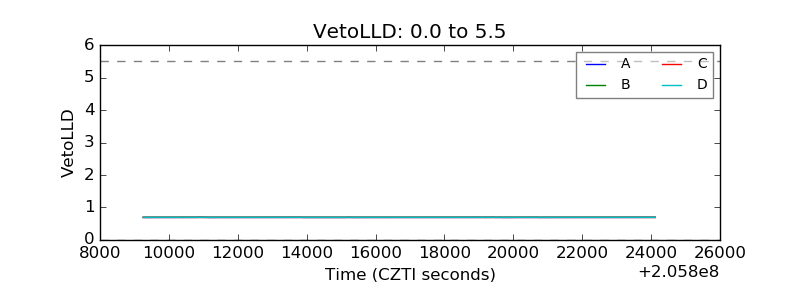 |
| Alpha Counter | 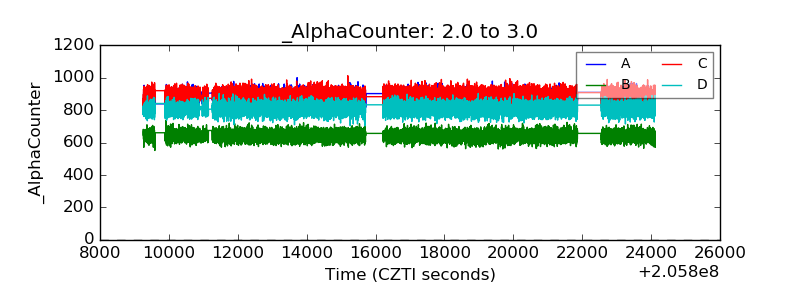 |
| _CPM_Rate | 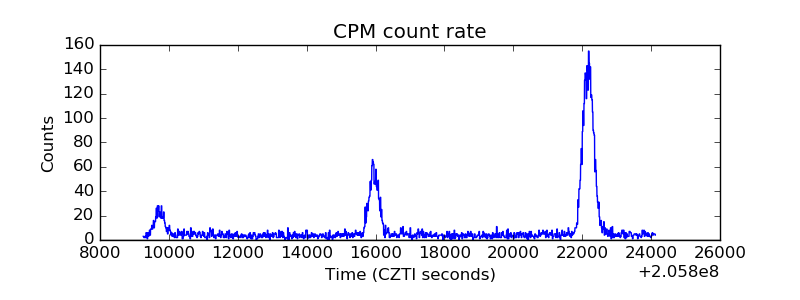 |
| CZT Counter | 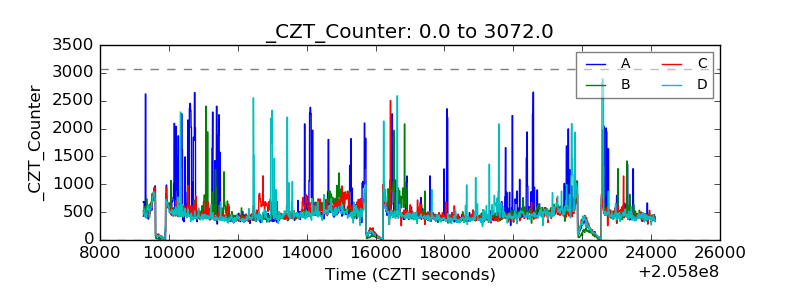 |
| +2.5 Volts monitor |  |
| +5 Volts monitor |  |
| _ROLL_ROT | 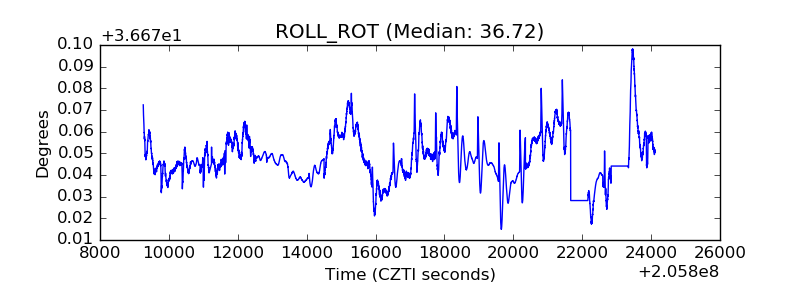 |
| _Roll_DEC | 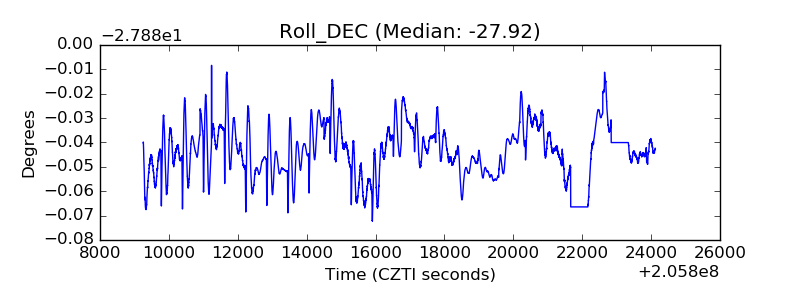 |
| _Roll_RA | 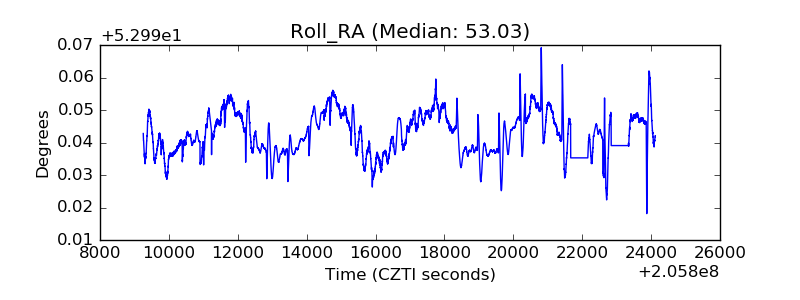 |
| Veto Counter | 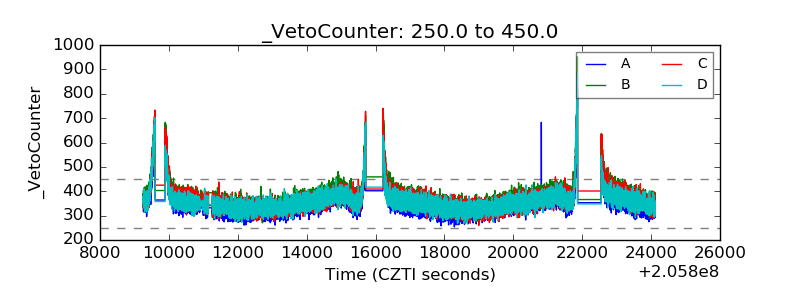 |