| Param | Original file | Final file |
|---|---|---|
| Filename | modeM0/AS1G05_240T01_9000000536_04235cztM0_level2.evt | modeM0/AS1G05_240T01_9000000536_04235cztM0_level2_quad_clean.evt |
| Size (bytes) | 438,647,040 | 64,454,400 |
| Size | 418.3 MB | 61.5 MB |
| Events in quadrant A | 2,879,376 | 392,858 |
| Events in quadrant B | 2,918,501 | 393,651 |
| Events in quadrant C | 2,807,706 | 388,770 |
| Events in quadrant D | 4,261,811 | 347,921 |
| Mode SS | |||
|---|---|---|---|
| Quadrant | BADHDUFLAG | Total packets | Discarded packets |
| A | 0 | 126 | 0 |
| B | 0 | 126 | 0 |
| C | 0 | 126 | 0 |
| D | 0 | 126 | 0 |
| Mode M9 | |||
|---|---|---|---|
| Quadrant | BADHDUFLAG | Total packets | Discarded packets |
| A | 0 | 8 | 0 |
| B | 0 | 8 | 0 |
| C | 0 | 8 | 0 |
| D | 0 | 8 | 0 |
| Mode M0 | |||
|---|---|---|---|
| Quadrant | BADHDUFLAG | Total packets | Discarded packets |
| A | 0 | 13039 | 65 |
| B | 0 | 12749 | 8 |
| C | 0 | 12575 | 6 |
| D | 0 | 17261 | 42 |
| Quadrant | Total seconds | Saturated seconds | Saturation percentage |
|---|---|---|---|
| A | 6121 | 99 | 1.617383% |
| B | 6130 | 48 | 0.783034% |
| C | 6131 | 47 | 0.766596% |
| D | 6127 | 498 | 8.127958% |
Noise dominated data is calculated using 1-second bins in cleaned event files. If a bin has >2000 counts, and if more than 50% of those come from <1% of pixels, then it is considered to be noise-dominated and hence unusable.
| Quadrant | # 1 sec bins | Bins with >0 counts | Bins with >2000 counts | High rate bins dominated by noise | Noise dominated (total time) | Noise dominated (detector-on time) | Marked lightcurve |
|---|---|---|---|---|---|---|---|
| A | 6978 | 6133 | 24 | 24 | 0.34% | 0.39% | 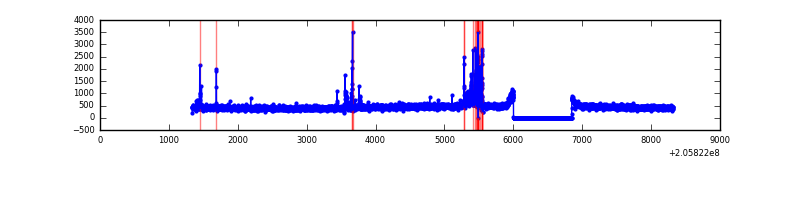 |
| B | 6978 | 6133 | 2 | 2 | 0.03% | 0.03% | 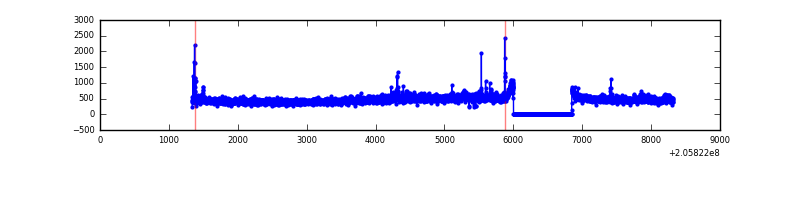 |
| C | 6978 | 6133 | 0 | 0 | 0.00% | 0.00% | 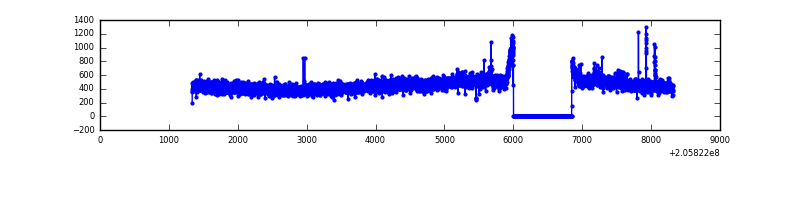 |
| D | 6978 | 6129 | 451 | 451 | 6.46% | 7.36% | 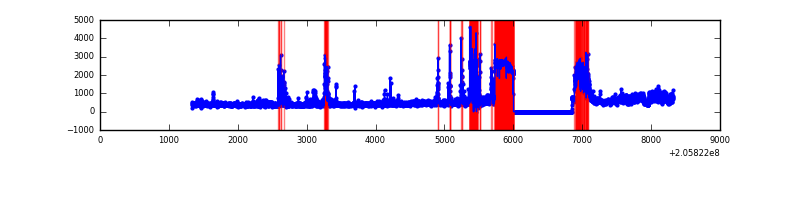 |
Top three noisy pixels from each quadrant. If the there are fewer than three noisy pixels in the level2.evt file, extra rows are filled as -1
| Pixel properties | Quadrant properties | ||||||
|---|---|---|---|---|---|---|---|
| Quadrant | DetID | PixID | Counts | Sigma | Mean | Median | Sigma |
| A | 0 | 50 | 181950 | 1246.77 | 696 | 678 | 145.4 |
| A | 15 | 234 | 12558 | 81.71 | 696 | 678 | 145.4 |
| A | 0 | 226 | 7161 | 44.59 | 696 | 678 | 145.4 |
| B | 15 | 204 | 91687 | 661.6 | 704 | 687 | 137.5 |
| B | 3 | 0 | 42532 | 304.23 | 704 | 687 | 137.5 |
| B | 14 | 167 | 17871 | 124.93 | 704 | 687 | 137.5 |
| C | 9 | 144 | 139327 | 857.81 | 680 | 684 | 161.6 |
| C | 10 | 65 | 6240 | 34.38 | 680 | 684 | 161.6 |
| C | 13 | 61 | 5636 | 30.64 | 680 | 684 | 161.6 |
| D | 2 | 63 | 1494441 | 9633.61 | 638 | 620 | 155.1 |
| D | 13 | 239 | 147266 | 945.72 | 638 | 620 | 155.1 |
| D | 2 | 232 | 87939 | 563.12 | 638 | 620 | 155.1 |
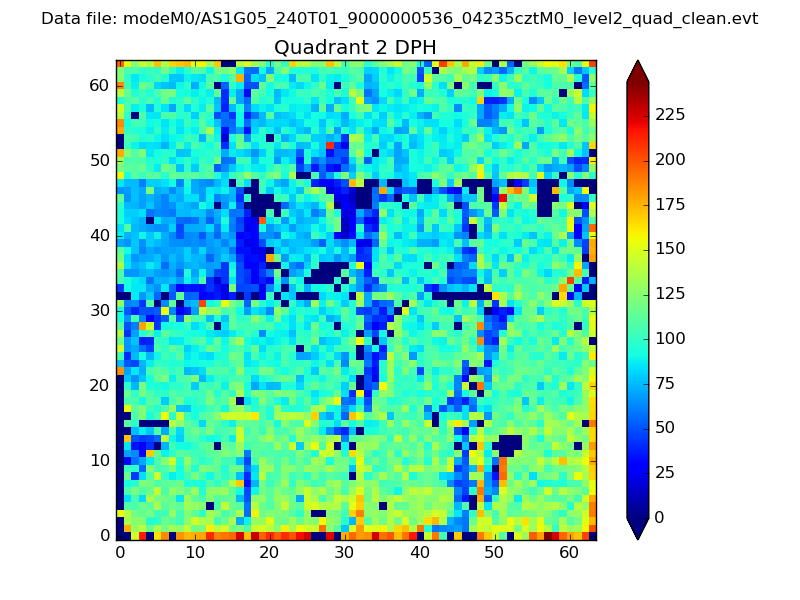
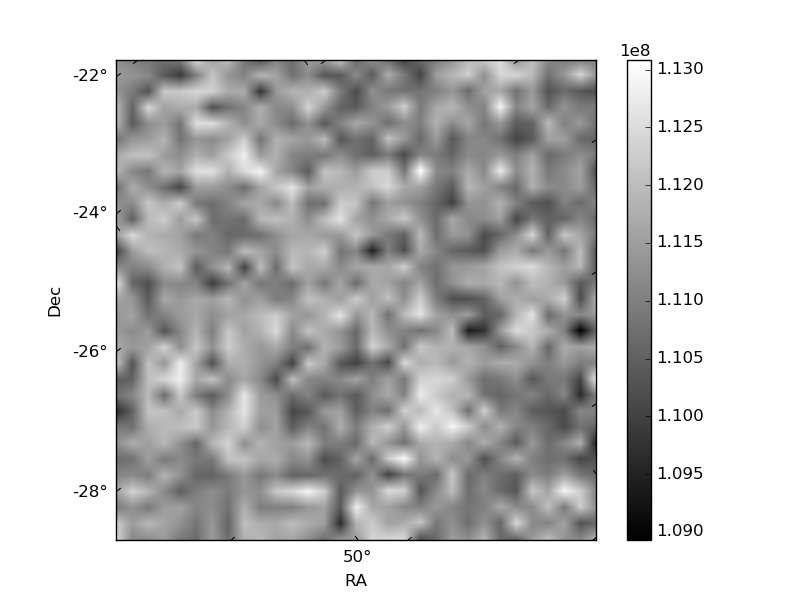
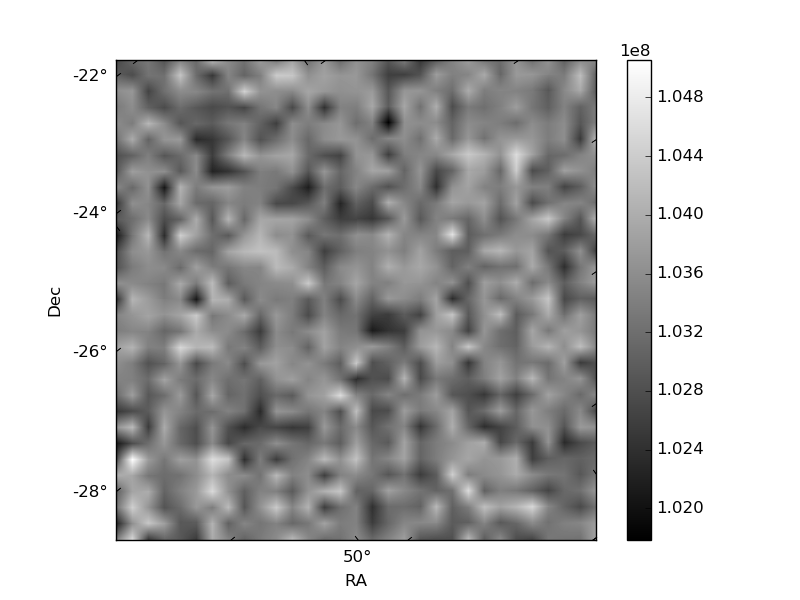
Histogram calculated using DETX and DETY for each event in the final _common_clean file
| Quadrant A | 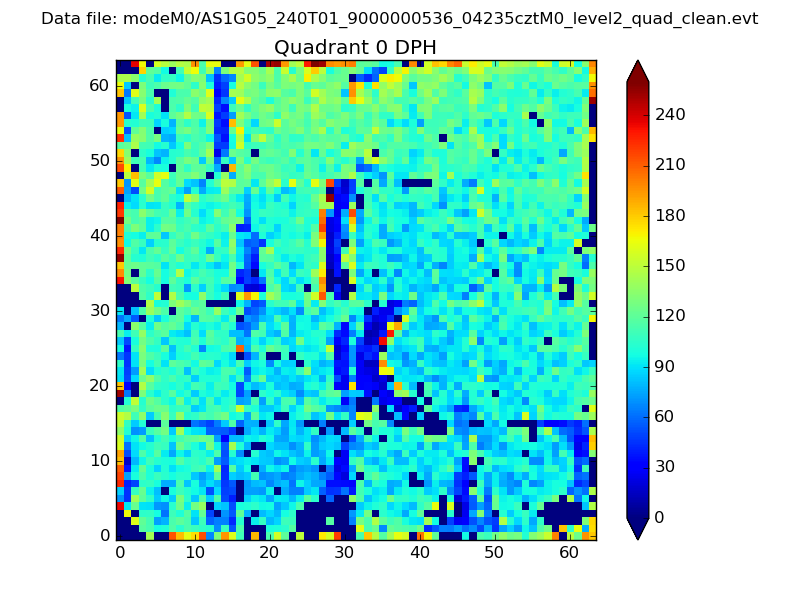 |
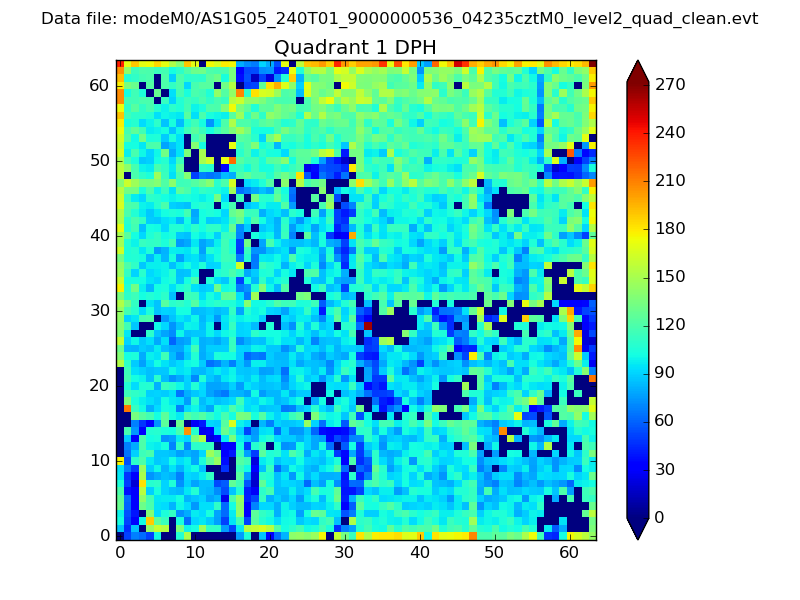 |
Quadrant B |
|---|---|---|---|
| Quadrant D | 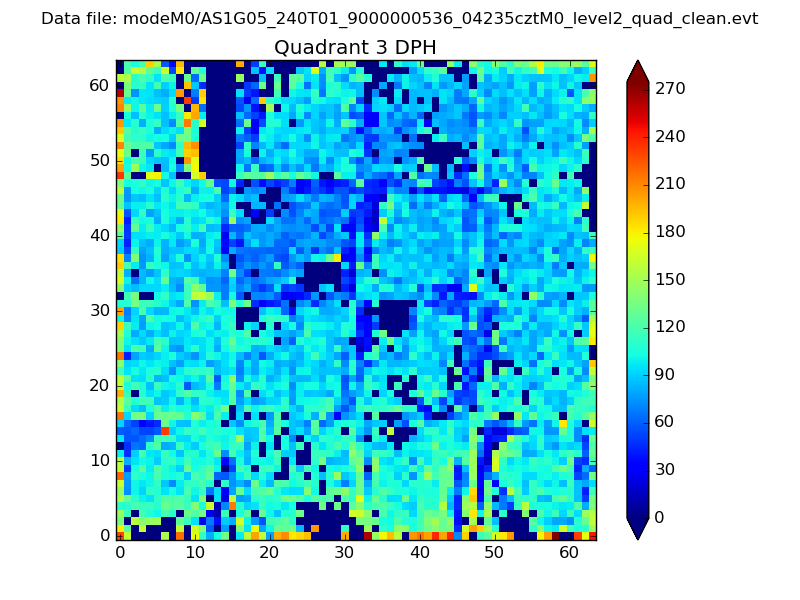 |
 |
Quadrant C |
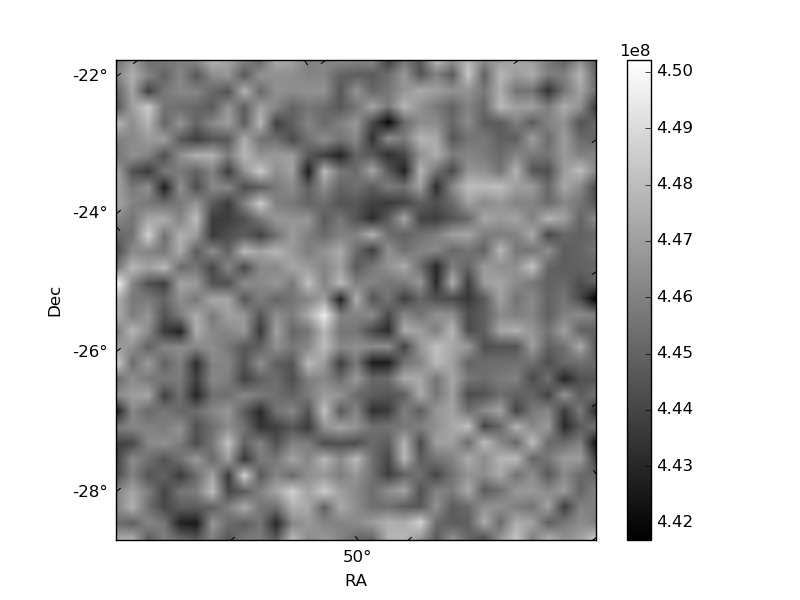
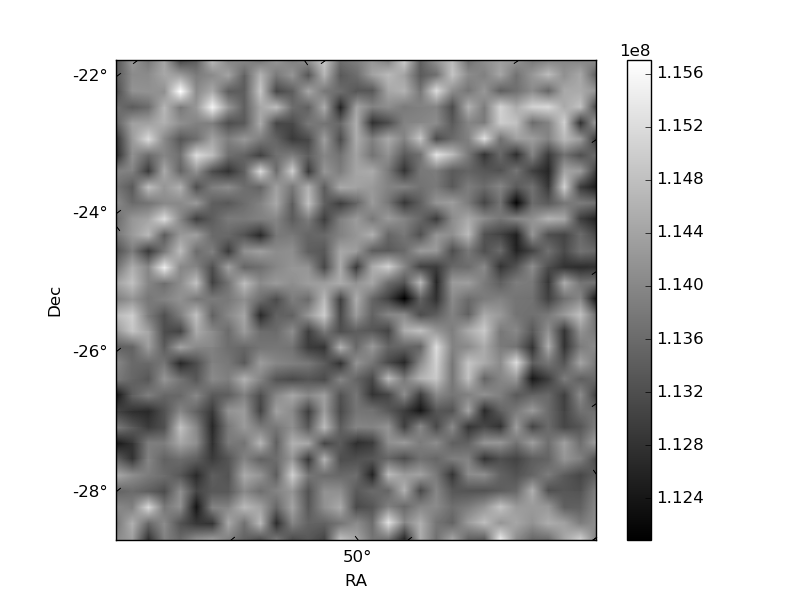
| Plot type | Count rate plots | Images |
|---|---|---|
| Comparison with Poisson distribution Blue bars denote a histogram of data divided into 1 sec bins. Red curve is a Poisson curve with rate = median count rate of data. |
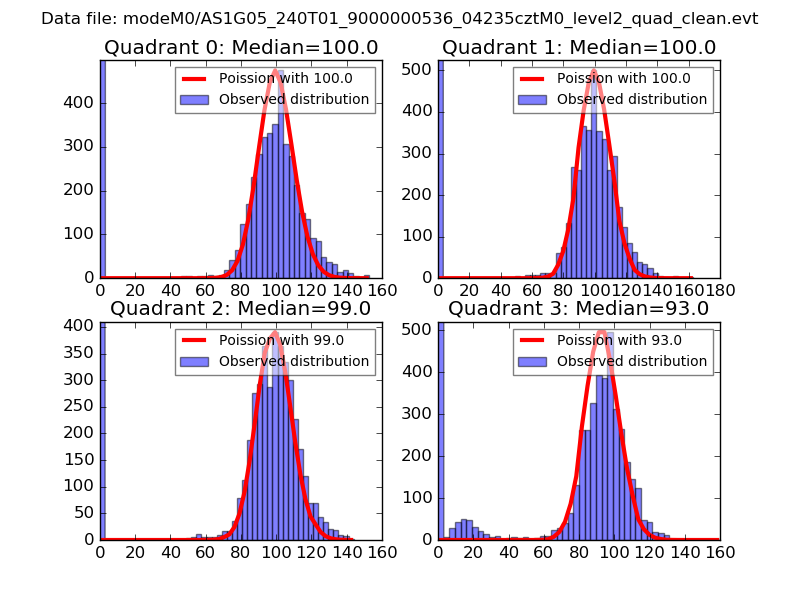 |
 |
| Quadrant-wise count rates Data is divided into 100 sec bins |
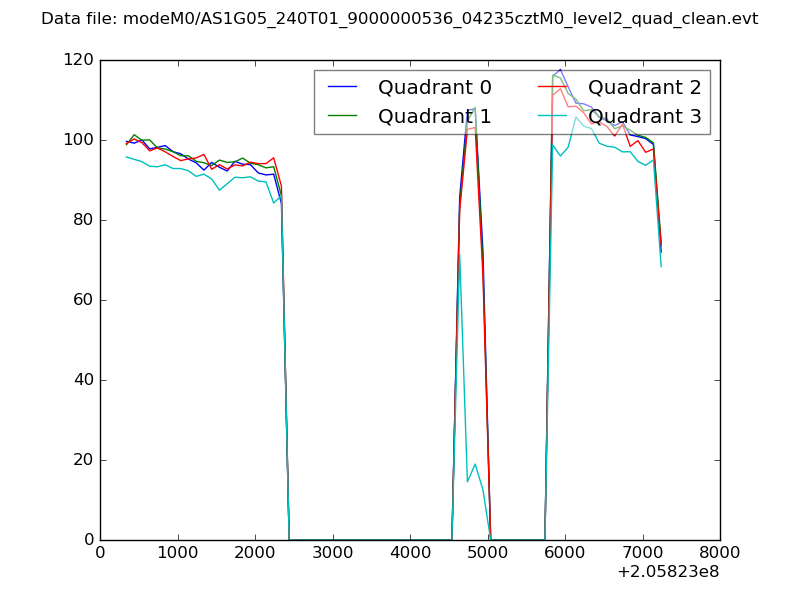 |
|
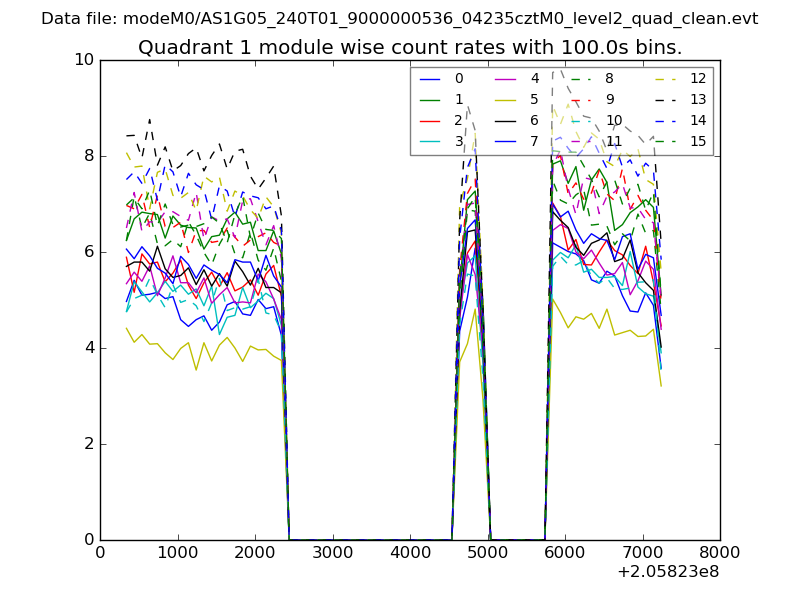
| Module-wise count rates for Quadrant A Data is divided into 100 sec bins |
 |
 |
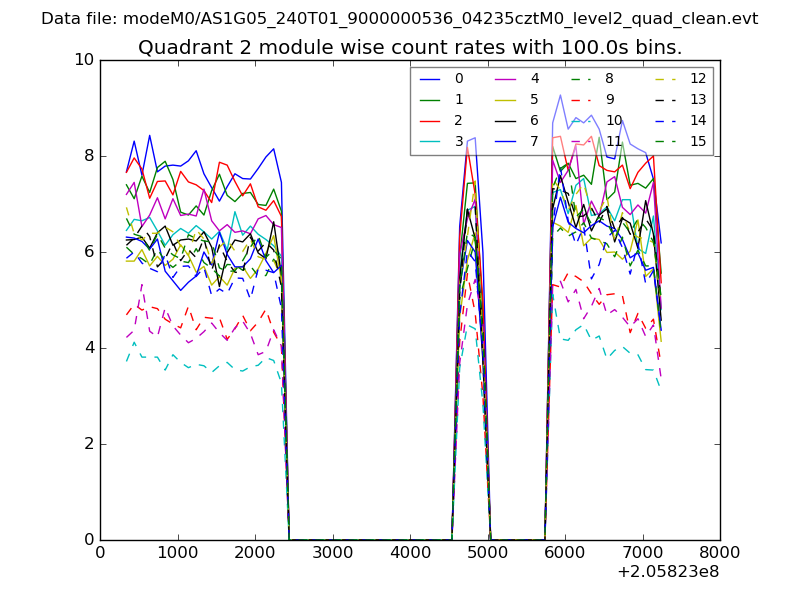
| Module-wise count rates for Quadrant B Data is divided into 100 sec bins |
 |
 |
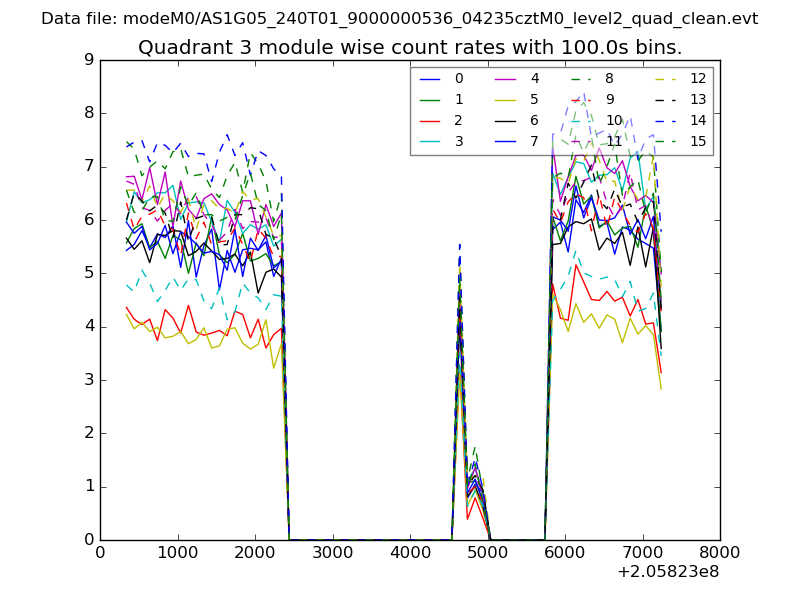
| Module-wise count rates for Quadrant C Data is divided into 100 sec bins |
 |
 |
| Module-wise count rates for Quadrant D Data is divided into 100 sec bins |
 |
 |
| Parameter | Plot |
|---|---|
| CZT HV Monitor | 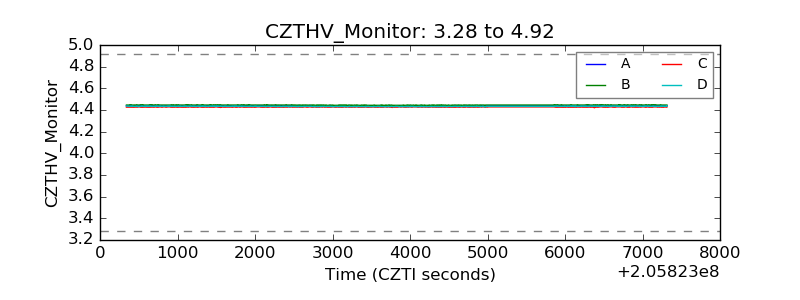 |
| D_VDD | 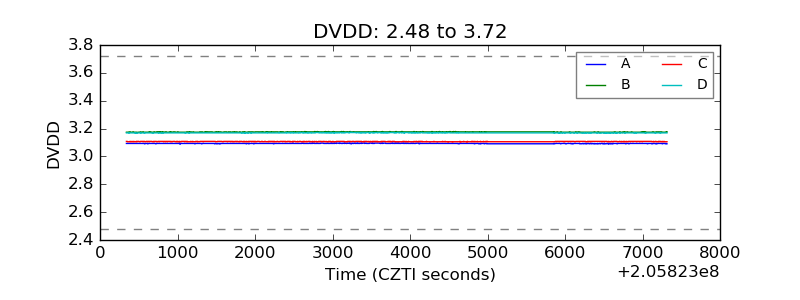 |
| Temperature 1 | 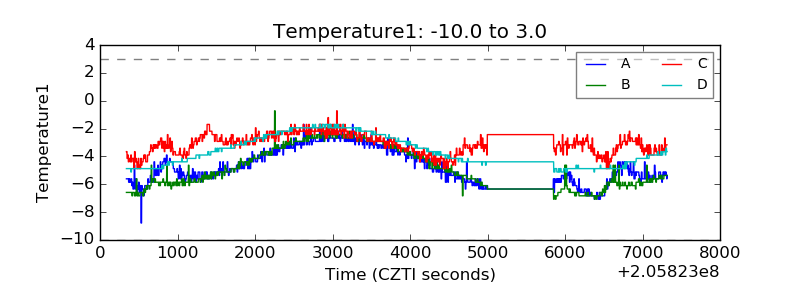 |
| Veto HV Monitor | 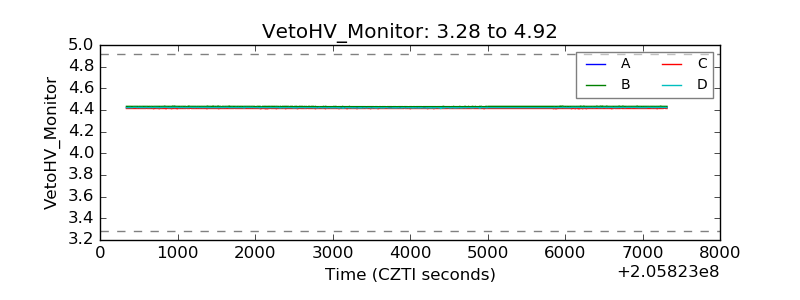 |
| Veto LLD | 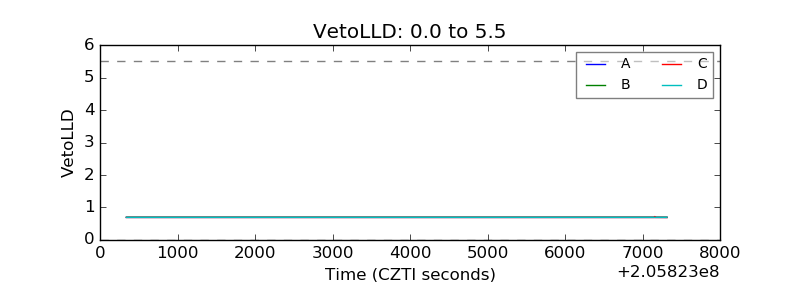 |
| Alpha Counter | 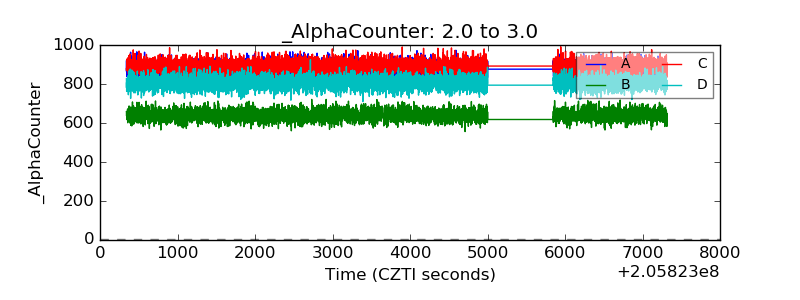 |
| _CPM_Rate |  |
| CZT Counter | 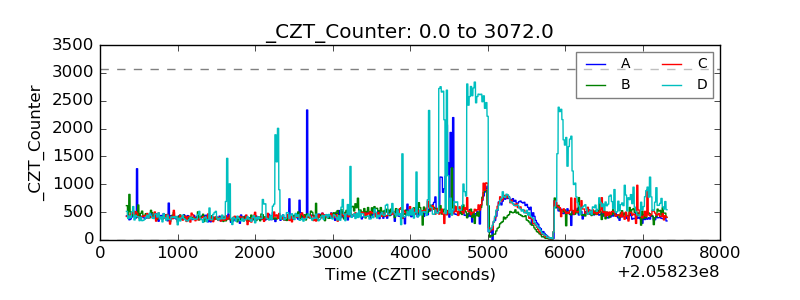 |
| +2.5 Volts monitor |  |
| +5 Volts monitor |  |
| _ROLL_ROT | 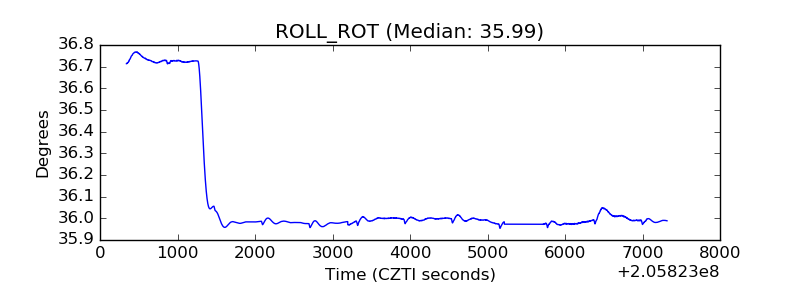 |
| _Roll_DEC | 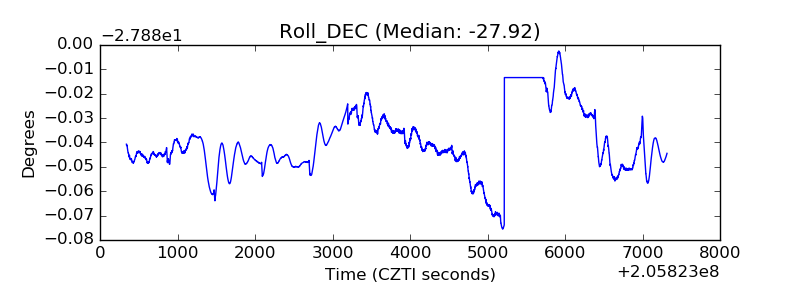 |
| _Roll_RA | 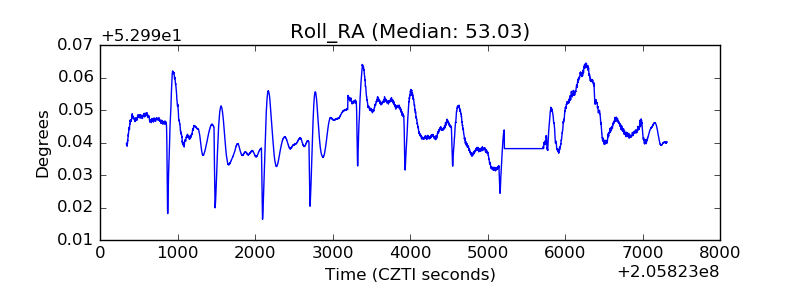 |
| Veto Counter | 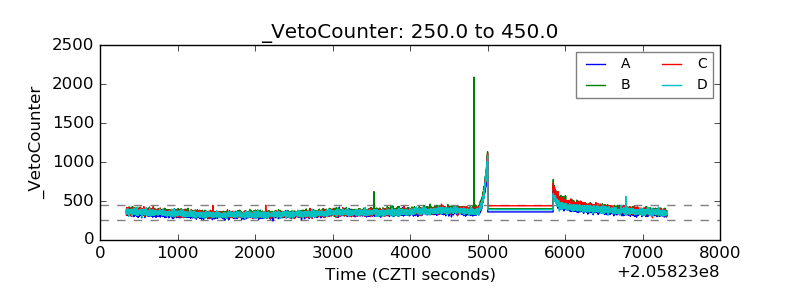 |