| Param | Original file | Final file |
|---|---|---|
| Filename | modeM0/AS1G05_240T01_9000000536_04240cztM0_level2.evt | modeM0/AS1G05_240T01_9000000536_04240cztM0_level2_quad_clean.evt |
| Size (bytes) | 825,687,360 | 67,337,280 |
| Size | 787.4 MB | 64.2 MB |
| Events in quadrant A | 3,278,981 | 423,570 |
| Events in quadrant B | 6,736,832 | 422,123 |
| Events in quadrant C | 3,026,496 | 411,989 |
| Events in quadrant D | 11,533,066 | 333,823 |
| Mode SS | |||
|---|---|---|---|
| Quadrant | BADHDUFLAG | Total packets | Discarded packets |
| A | 0 | 130 | 0 |
| B | 0 | 130 | 0 |
| C | 0 | 130 | 0 |
| D | 0 | 130 | 0 |
| Mode M9 | |||
|---|---|---|---|
| Quadrant | BADHDUFLAG | Total packets | Discarded packets |
| A | 0 | 13 | 0 |
| B | 0 | 13 | 0 |
| C | 0 | 13 | 0 |
| D | 0 | 13 | 0 |
| Mode M0 | |||
|---|---|---|---|
| Quadrant | BADHDUFLAG | Total packets | Discarded packets |
| A | 0 | 13548 | 2 |
| B | 0 | 24564 | 1 |
| C | 0 | 13133 | 1 |
| D | 0 | 38636 | 1 |
| Quadrant | Total seconds | Saturated seconds | Saturation percentage |
|---|---|---|---|
| A | 6405 | 93 | 1.451991% |
| B | 6405 | 842 | 13.145980% |
| C | 6405 | 51 | 0.796253% |
| D | 6405 | 1662 | 25.948478% |
Noise dominated data is calculated using 1-second bins in cleaned event files. If a bin has >2000 counts, and if more than 50% of those come from <1% of pixels, then it is considered to be noise-dominated and hence unusable.
| Quadrant | # 1 sec bins | Bins with >0 counts | Bins with >2000 counts | High rate bins dominated by noise | Noise dominated (total time) | Noise dominated (detector-on time) | Marked lightcurve |
|---|---|---|---|---|---|---|---|
| A | 7675 | 6405 | 1 | 1 | 0.01% | 0.02% | 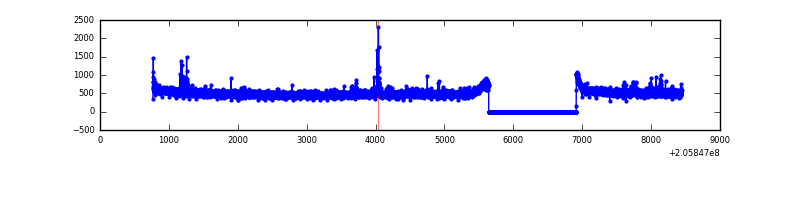 |
| B | 7675 | 6406 | 635 | 635 | 8.27% | 9.91% |  |
| C | 7675 | 6406 | 0 | 0 | 0.00% | 0.00% |  |
| D | 7675 | 6405 | 1682 | 1682 | 21.92% | 26.26% | 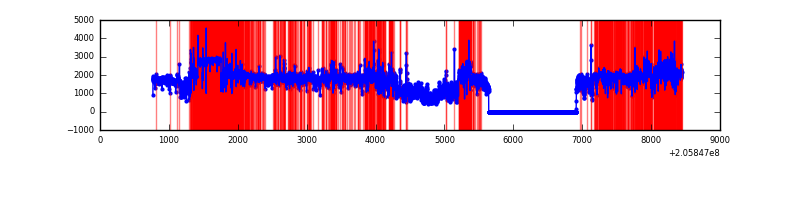 |
Top three noisy pixels from each quadrant. If the there are fewer than three noisy pixels in the level2.evt file, extra rows are filled as -1
| Pixel properties | Quadrant properties | ||||||
|---|---|---|---|---|---|---|---|
| Quadrant | DetID | PixID | Counts | Sigma | Mean | Median | Sigma |
| A | 0 | 149 | 60112 | 361.99 | 816 | 801 | 163.8 |
| A | 8 | 15 | 37050 | 221.24 | 816 | 801 | 163.8 |
| A | 15 | 234 | 17974 | 104.81 | 816 | 801 | 163.8 |
| B | 3 | 0 | 3142061 | 20791.3 | 797 | 781 | 151.1 |
| B | 7 | 252 | 233912 | 1543.03 | 797 | 781 | 151.1 |
| B | 15 | 204 | 181200 | 1194.15 | 797 | 781 | 151.1 |
| C | 13 | 61 | 6487 | 31.93 | 773 | 780 | 178.8 |
| C | 9 | 144 | 3712 | 16.4 | 773 | 780 | 178.8 |
| C | 10 | 65 | 2723 | 10.87 | 773 | 780 | 178.8 |
| D | 2 | 63 | 7770605 | 45520.61 | 715 | 698 | 170.7 |
| D | 15 | 217 | 740982 | 4337.01 | 715 | 698 | 170.7 |
| D | 1 | 52 | 98130 | 570.81 | 715 | 698 | 170.7 |
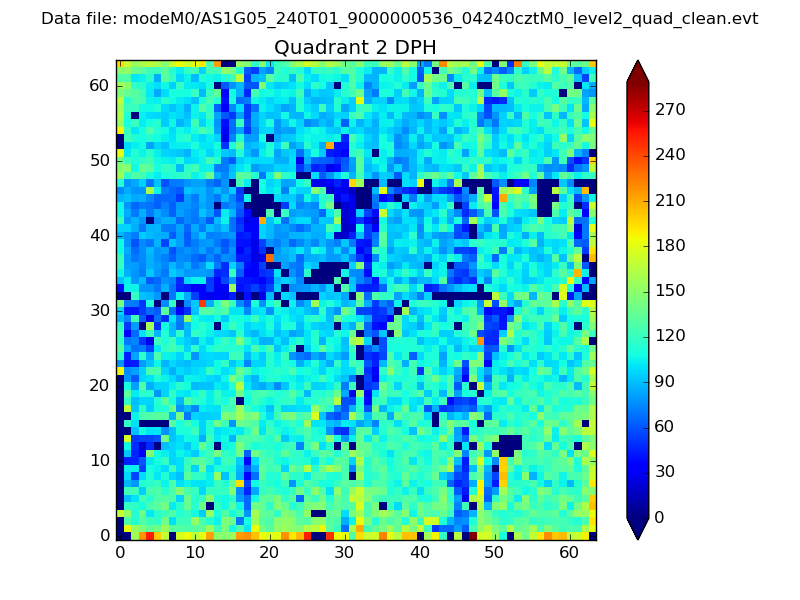
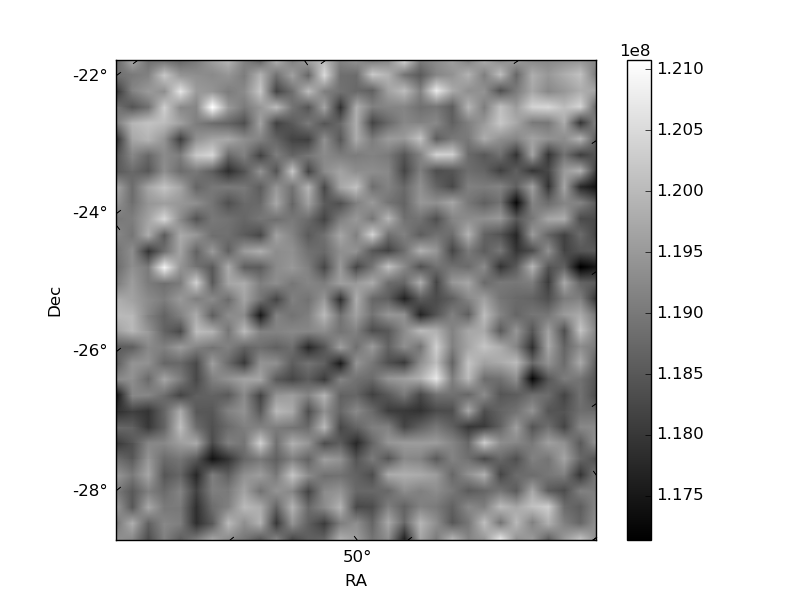
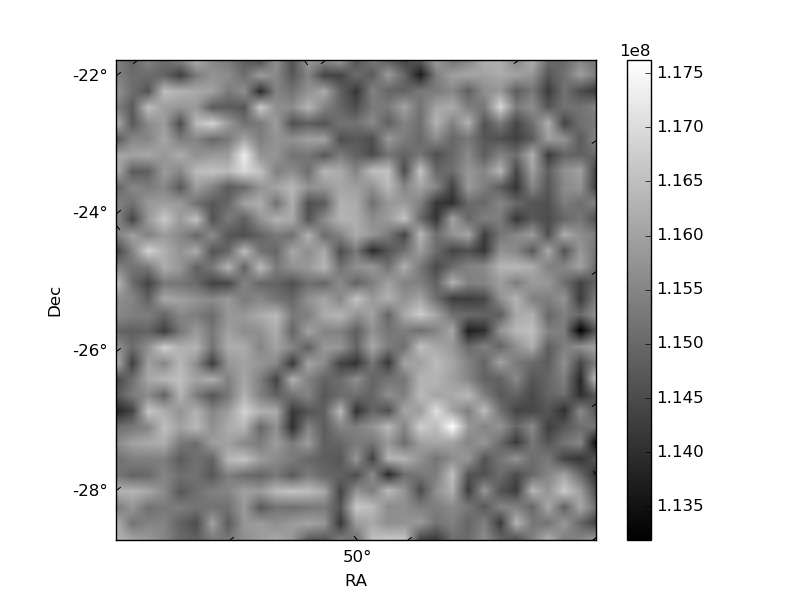
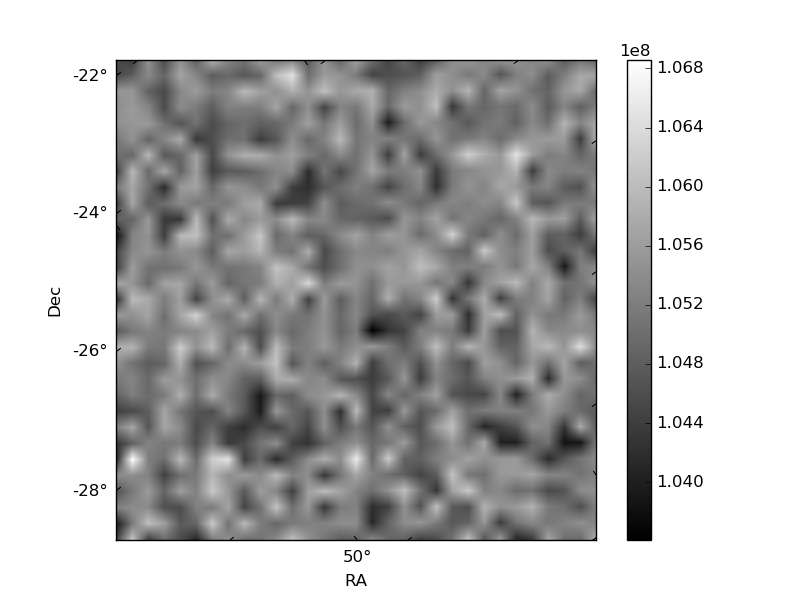
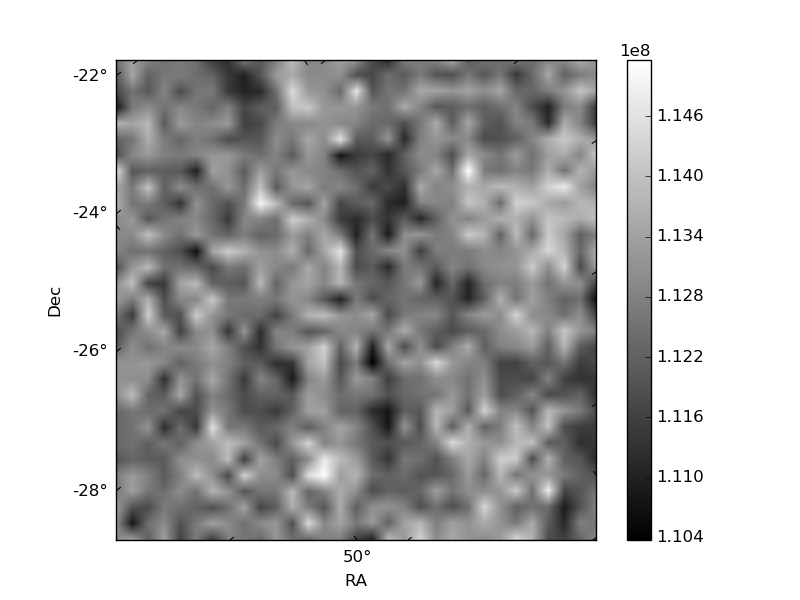
Histogram calculated using DETX and DETY for each event in the final _common_clean file
| Quadrant A | 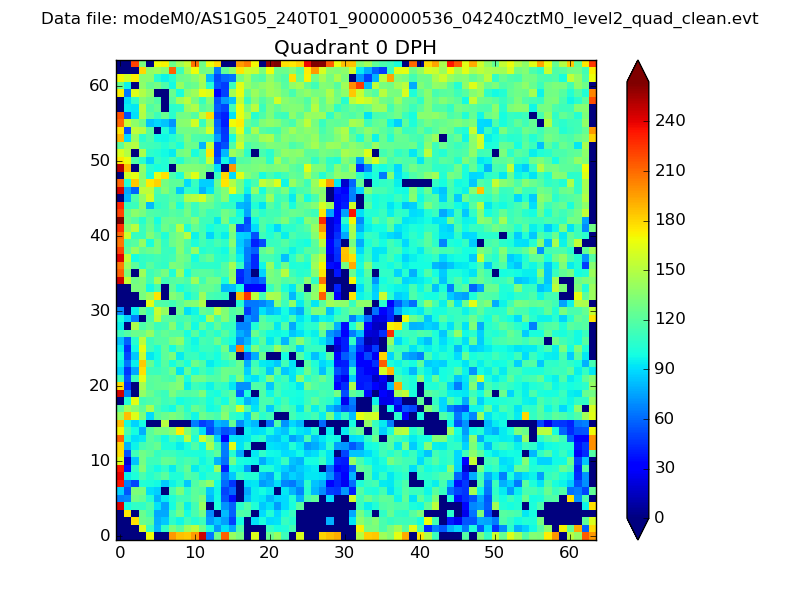 |
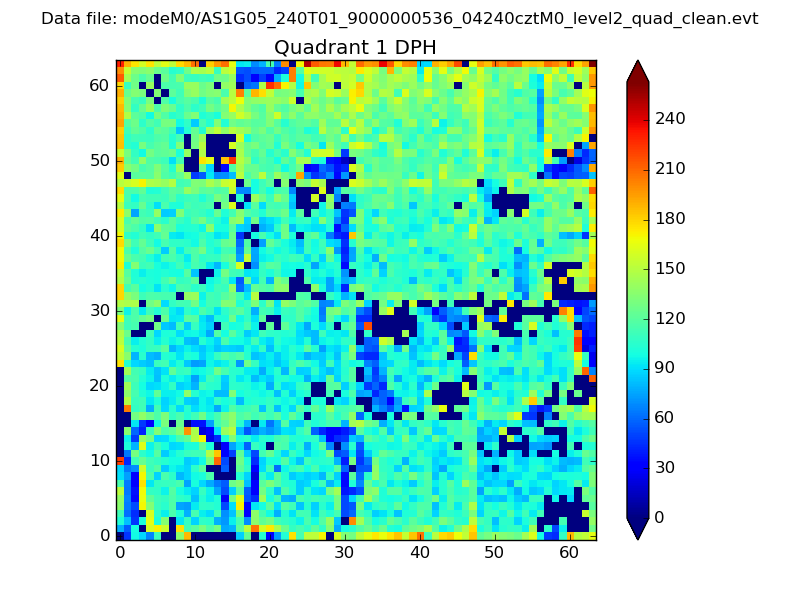 |
Quadrant B |
|---|---|---|---|
| Quadrant D | 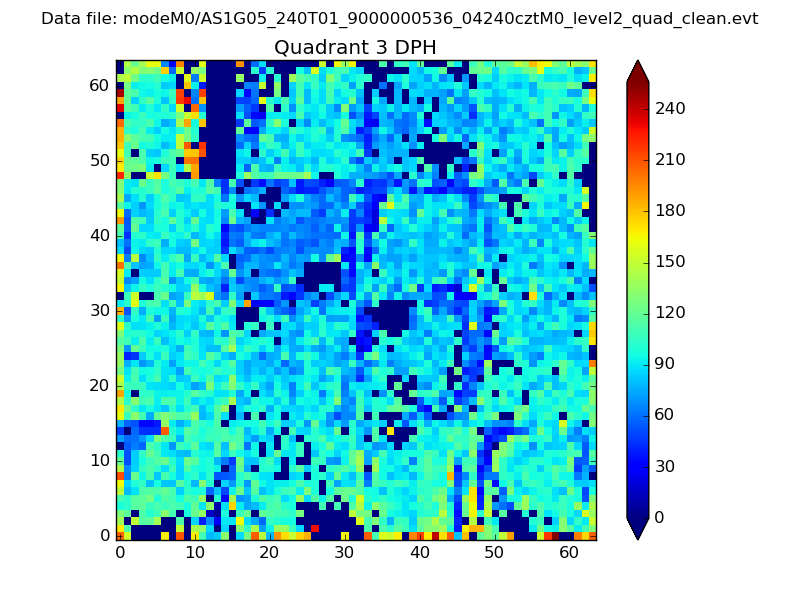 |
 |
Quadrant C |
| Plot type | Count rate plots | Images |
|---|---|---|
| Comparison with Poisson distribution Blue bars denote a histogram of data divided into 1 sec bins. Red curve is a Poisson curve with rate = median count rate of data. |
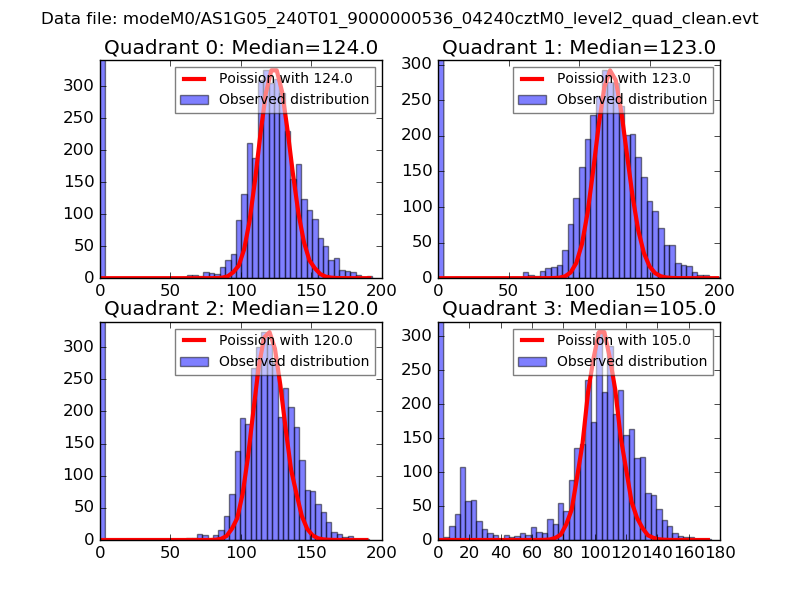 |
 |
| Quadrant-wise count rates Data is divided into 100 sec bins |
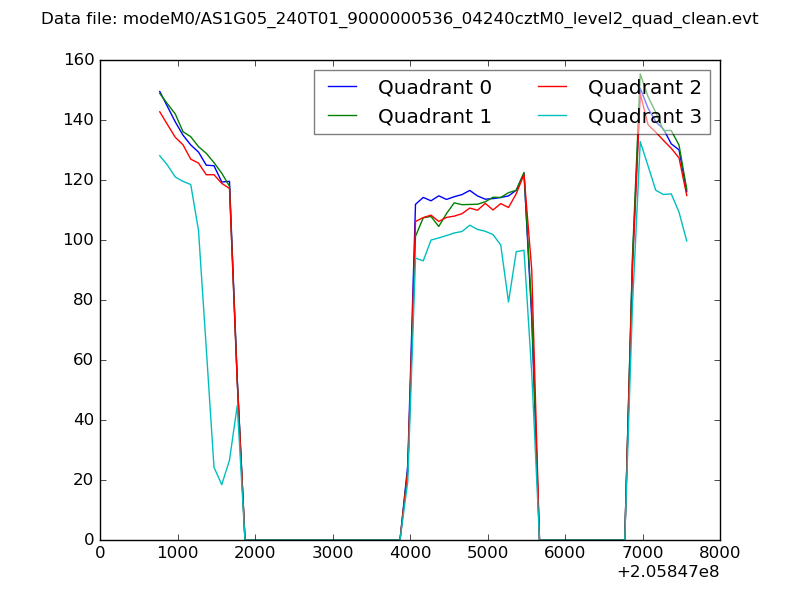 |
|
| Module-wise count rates for Quadrant A Data is divided into 100 sec bins |
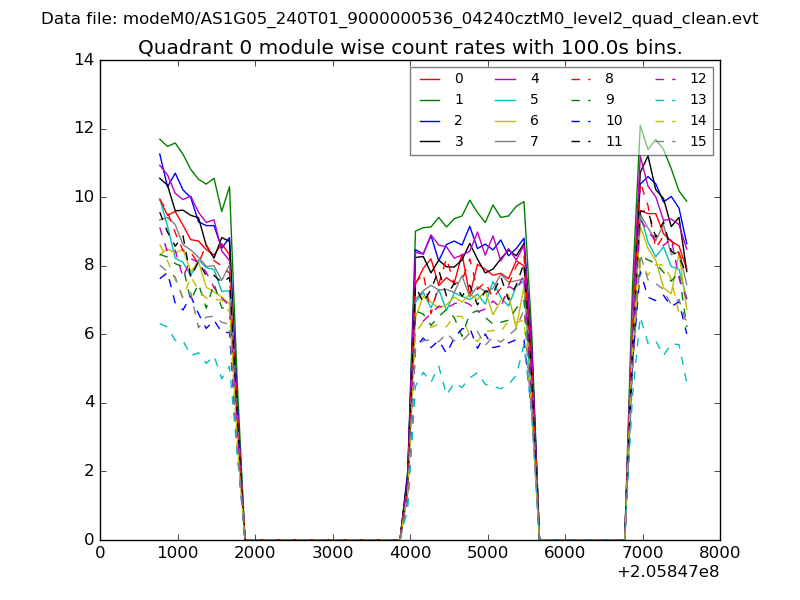 |
 |
| Module-wise count rates for Quadrant B Data is divided into 100 sec bins |
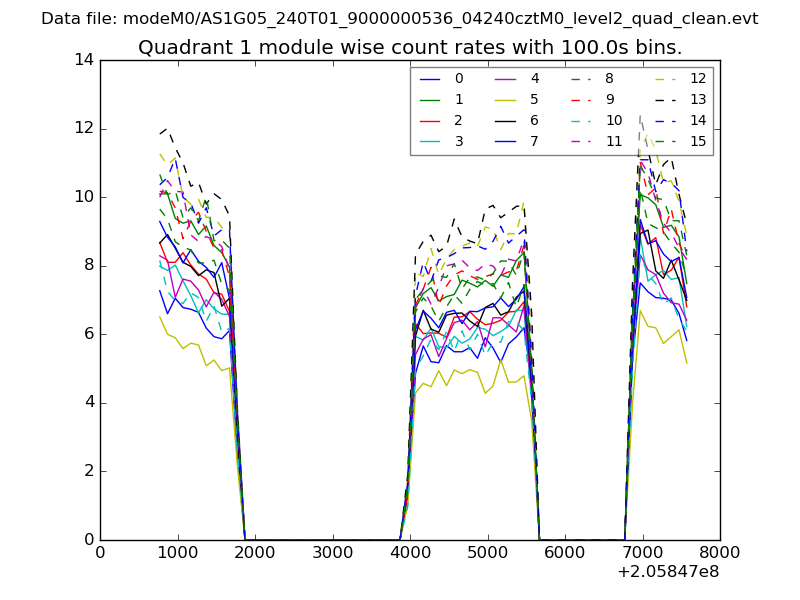 |
 |
| Module-wise count rates for Quadrant C Data is divided into 100 sec bins |
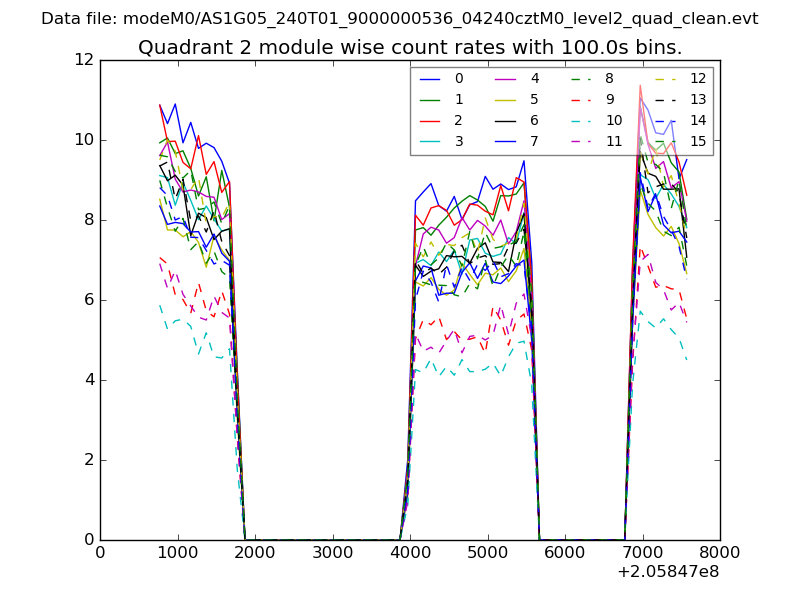 |
 |
| Module-wise count rates for Quadrant D Data is divided into 100 sec bins |
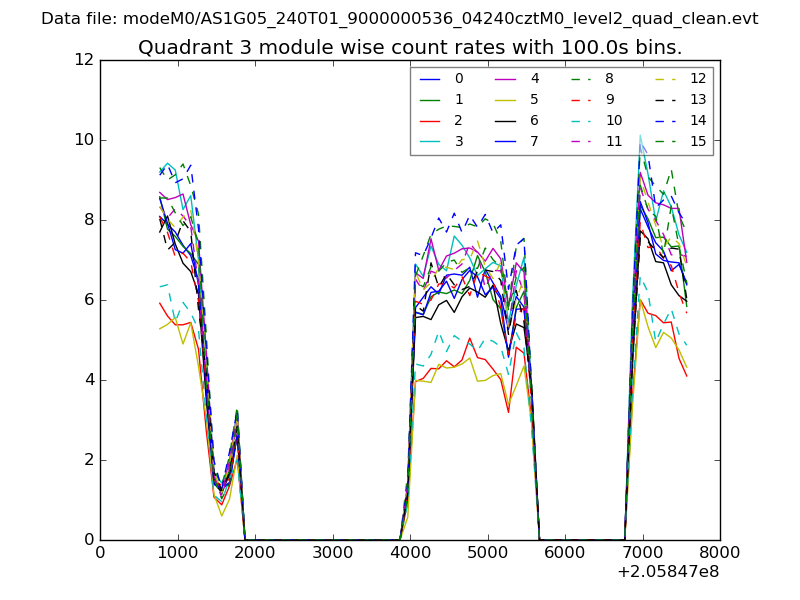 |
 |
| Parameter | Plot |
|---|---|
| CZT HV Monitor | 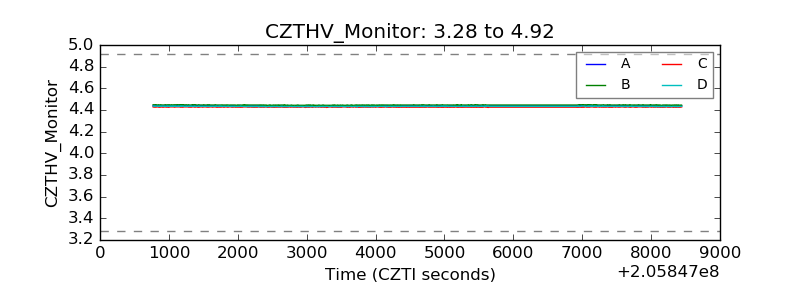 |
| D_VDD | 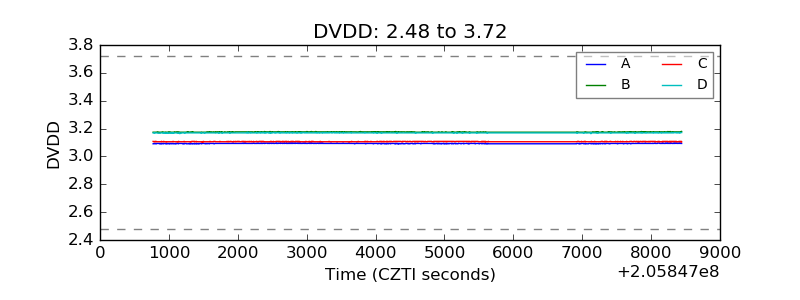 |
| Temperature 1 | 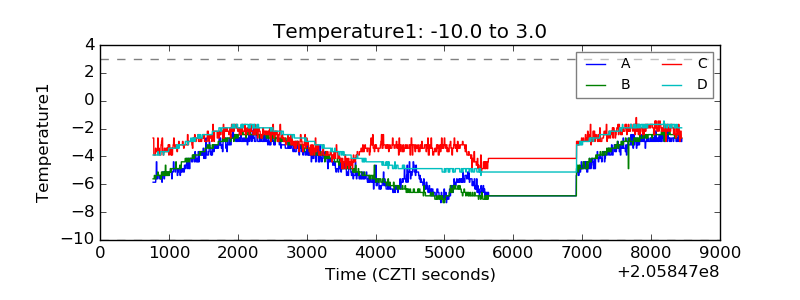 |
| Veto HV Monitor | 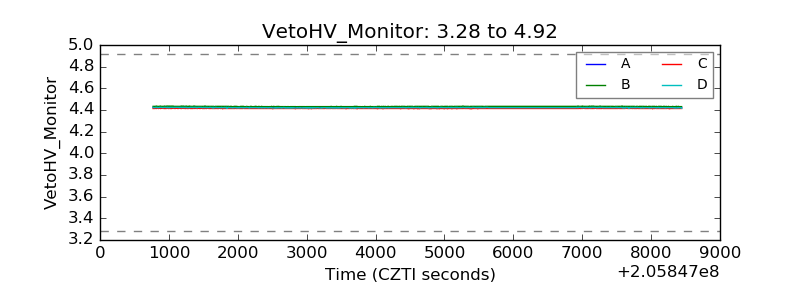 |
| Veto LLD |  |
| Alpha Counter | 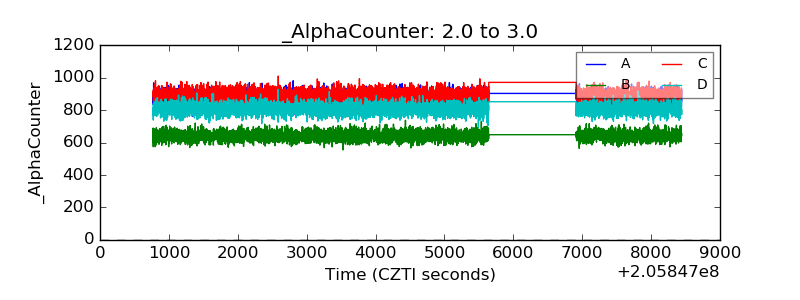 |
| _CPM_Rate | 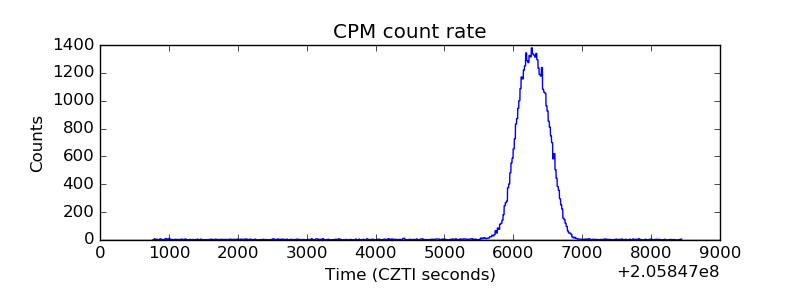 |
| CZT Counter | 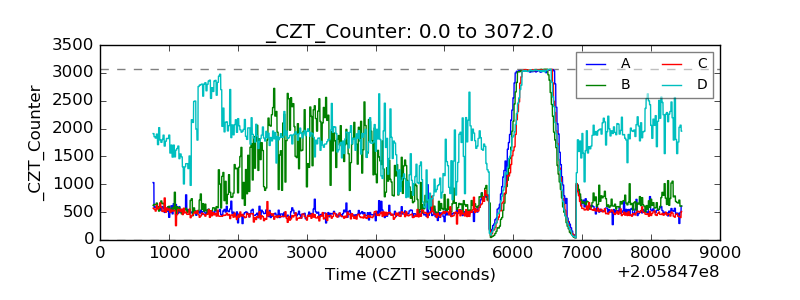 |
| +2.5 Volts monitor |  |
| +5 Volts monitor |  |
| _ROLL_ROT | 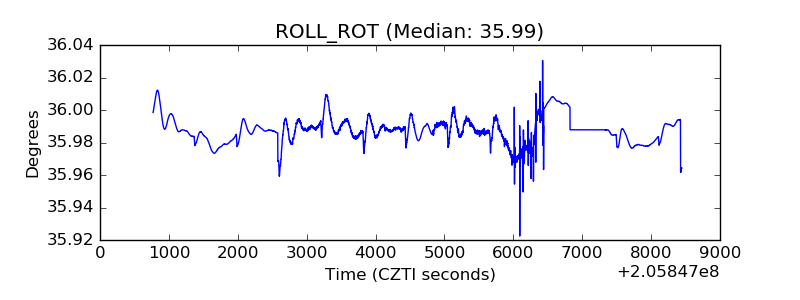 |
| _Roll_DEC | 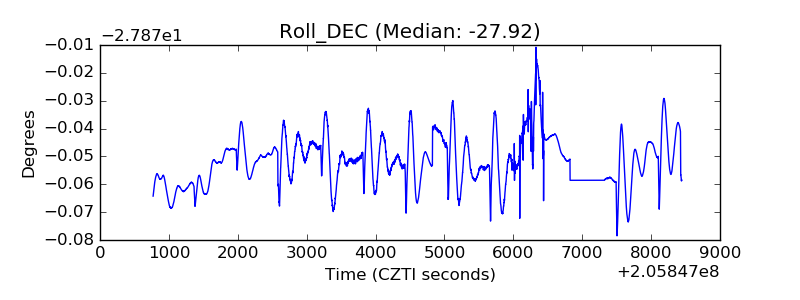 |
| _Roll_RA | 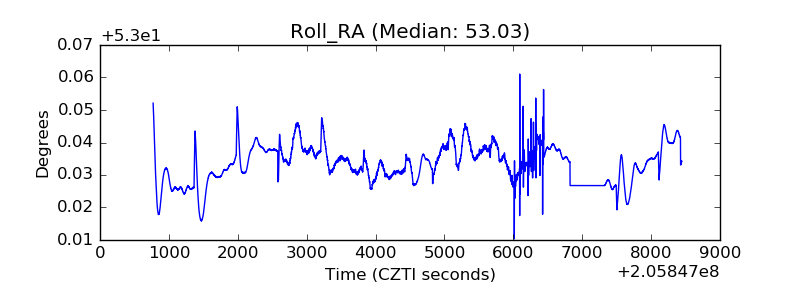 |
| Veto Counter | 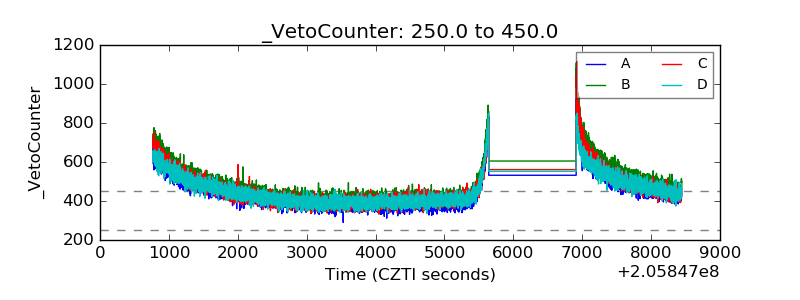 |