| Param | Original file | Final file |
|---|---|---|
| Filename | modeM0/AS1G05_240T01_9000000536_04241cztM0_level2.evt | modeM0/AS1G05_240T01_9000000536_04241cztM0_level2_quad_clean.evt |
| Size (bytes) | 736,038,720 | 53,907,840 |
| Size | 701.9 MB | 51.4 MB |
| Events in quadrant A | 3,099,809 | 320,581 |
| Events in quadrant B | 3,498,949 | 322,524 |
| Events in quadrant C | 2,860,656 | 312,923 |
| Events in quadrant D | 12,423,544 | 253,558 |
| Mode SS | |||
|---|---|---|---|
| Quadrant | BADHDUFLAG | Total packets | Discarded packets |
| A | 0 | 122 | 0 |
| B | 0 | 122 | 0 |
| C | 0 | 122 | 0 |
| D | 0 | 122 | 0 |
| Mode M9 | |||
|---|---|---|---|
| Quadrant | BADHDUFLAG | Total packets | Discarded packets |
| A | 0 | 13 | 0 |
| B | 0 | 13 | 0 |
| C | 0 | 13 | 0 |
| D | 0 | 13 | 0 |
| Mode M0 | |||
|---|---|---|---|
| Quadrant | BADHDUFLAG | Total packets | Discarded packets |
| A | 0 | 12836 | 2 |
| B | 0 | 14292 | 1 |
| C | 0 | 12430 | 1 |
| D | 0 | 41000 | 1 |
| Quadrant | Total seconds | Saturated seconds | Saturation percentage |
|---|---|---|---|
| A | 6041 | 136 | 2.251283% |
| B | 6041 | 137 | 2.267836% |
| C | 6041 | 89 | 1.473266% |
| D | 6041 | 3177 | 52.590631% |
Noise dominated data is calculated using 1-second bins in cleaned event files. If a bin has >2000 counts, and if more than 50% of those come from <1% of pixels, then it is considered to be noise-dominated and hence unusable.
| Quadrant | # 1 sec bins | Bins with >0 counts | Bins with >2000 counts | High rate bins dominated by noise | Noise dominated (total time) | Noise dominated (detector-on time) | Marked lightcurve |
|---|---|---|---|---|---|---|---|
| A | 7301 | 6041 | 2 | 2 | 0.03% | 0.03% | 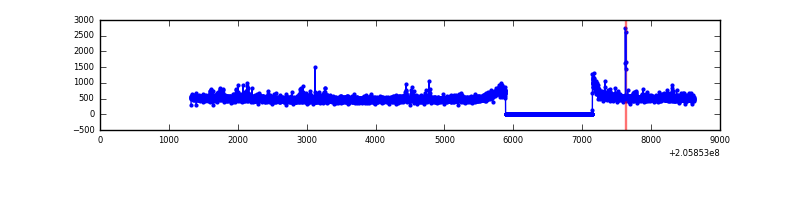 |
| B | 7301 | 6041 | 15 | 15 | 0.21% | 0.25% | 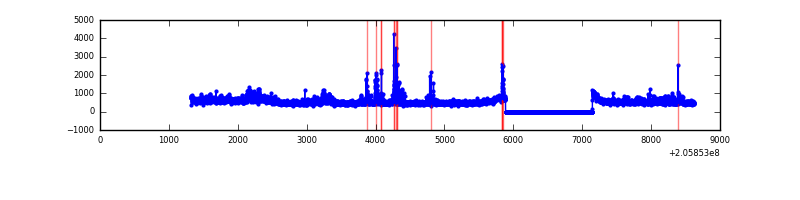 |
| C | 7301 | 6042 | 0 | 0 | 0.00% | 0.00% | 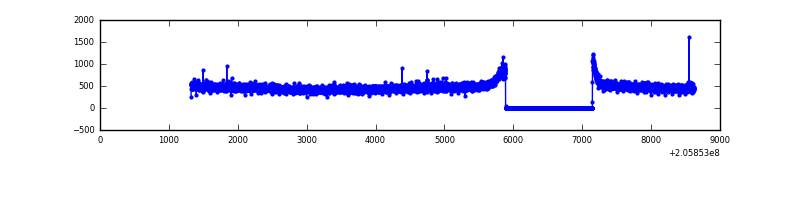 |
| D | 7301 | 6042 | 3190 | 3190 | 43.69% | 52.80% | 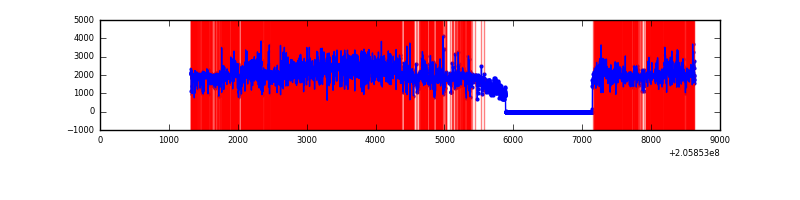 |
Top three noisy pixels from each quadrant. If the there are fewer than three noisy pixels in the level2.evt file, extra rows are filled as -1
| Pixel properties | Quadrant properties | ||||||
|---|---|---|---|---|---|---|---|
| Quadrant | DetID | PixID | Counts | Sigma | Mean | Median | Sigma |
| A | 8 | 15 | 95576 | 615.06 | 764 | 749 | 154.2 |
| A | 0 | 149 | 37568 | 238.81 | 764 | 749 | 154.2 |
| A | 0 | 50 | 11591 | 70.32 | 764 | 749 | 154.2 |
| B | 15 | 204 | 183176 | 1245.9 | 767 | 750 | 146.4 |
| B | 3 | 0 | 131201 | 890.93 | 767 | 750 | 146.4 |
| B | 7 | 252 | 115387 | 782.93 | 767 | 750 | 146.4 |
| C | 10 | 65 | 7371 | 39.36 | 729 | 734 | 168.6 |
| C | 9 | 144 | 7022 | 37.29 | 729 | 734 | 168.6 |
| C | 13 | 61 | 6222 | 32.55 | 729 | 734 | 168.6 |
| D | 2 | 63 | 7991565 | 53113.91 | 632 | 616 | 150.4 |
| D | 2 | 232 | 1597552 | 10614.45 | 632 | 616 | 150.4 |
| D | 1 | 52 | 170262 | 1127.6 | 632 | 616 | 150.4 |
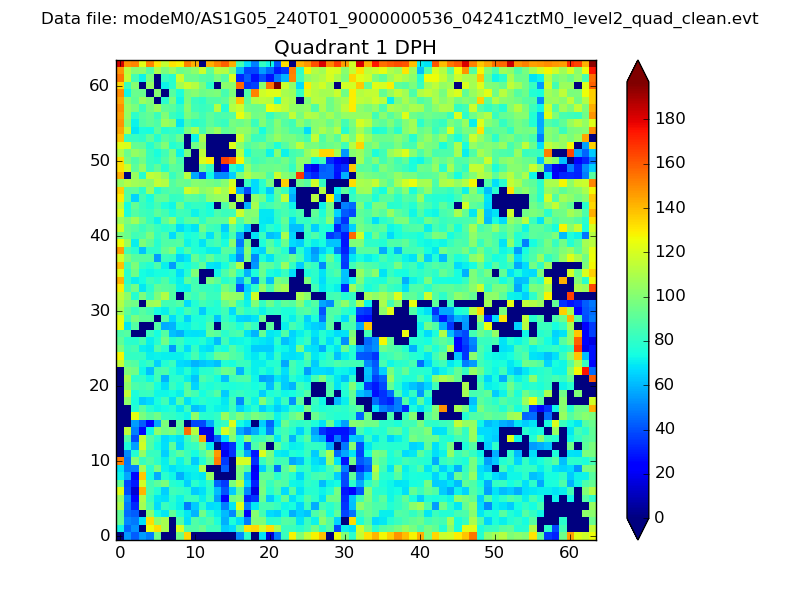
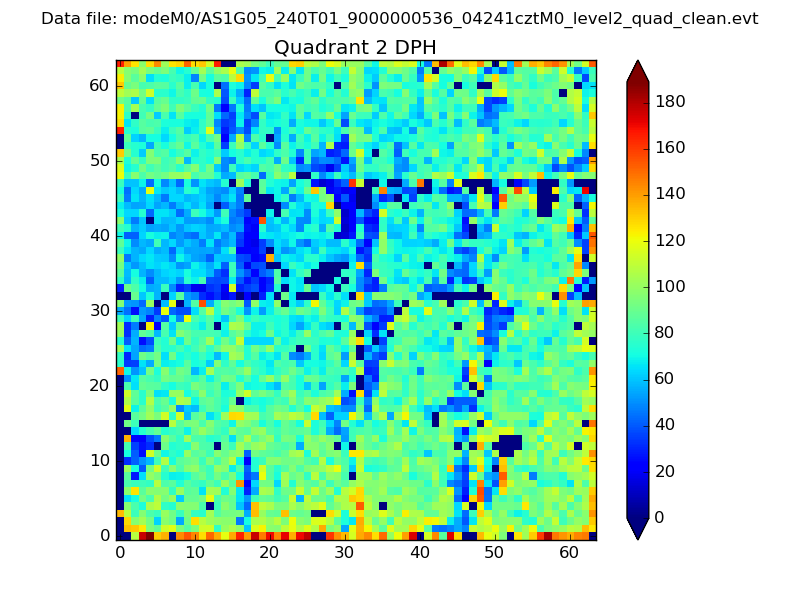
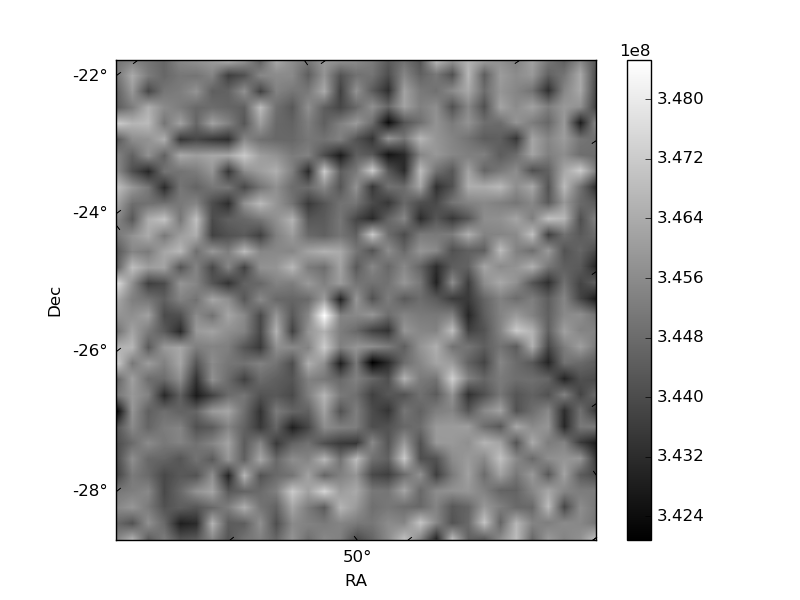
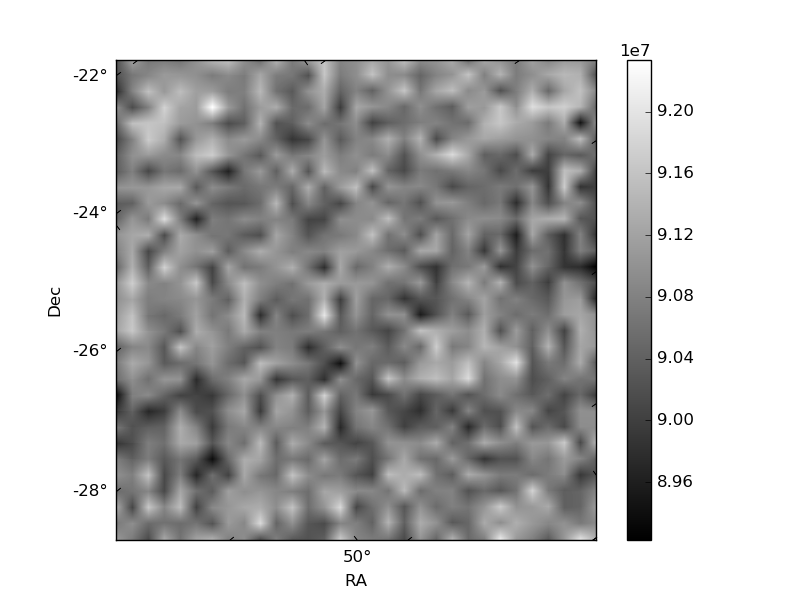
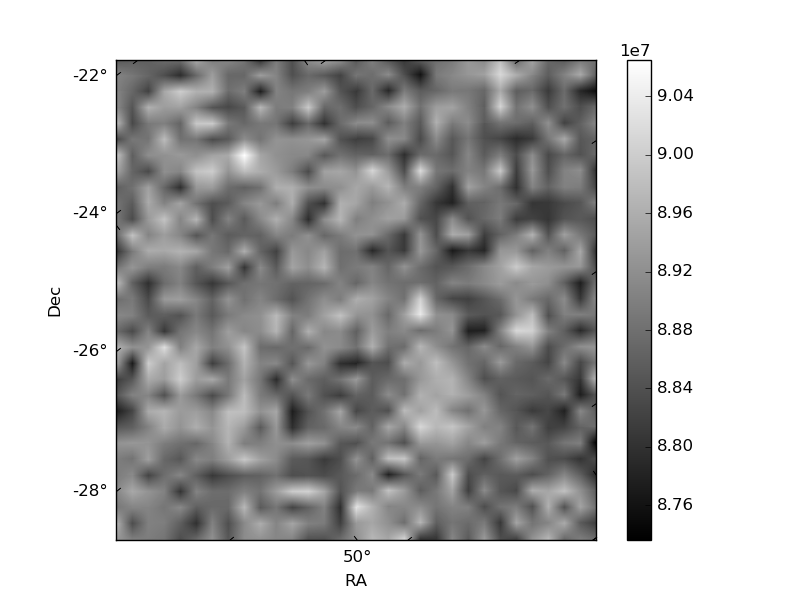
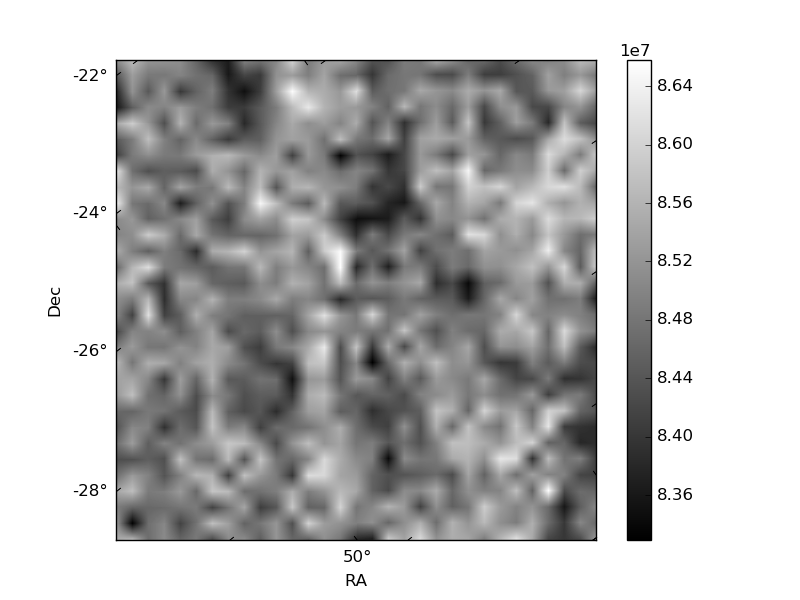
Histogram calculated using DETX and DETY for each event in the final _common_clean file
| Quadrant A |  |
 |
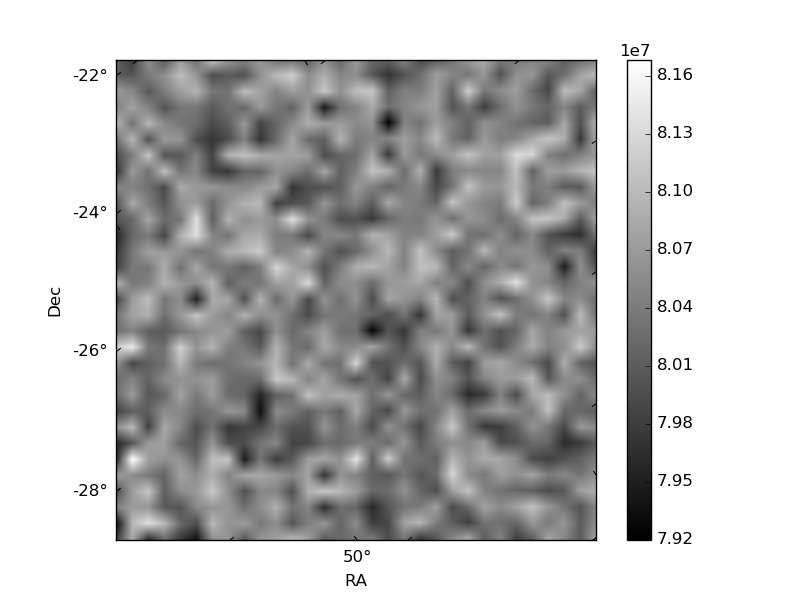
Quadrant B |
|---|---|---|---|
| Quadrant D | 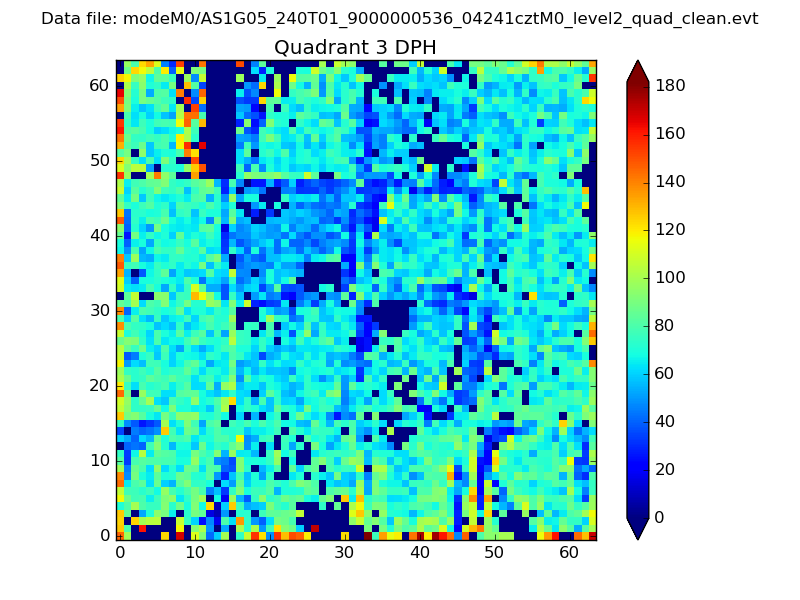 |
 |
Quadrant C |
| Plot type | Count rate plots | Images |
|---|---|---|
| Comparison with Poisson distribution Blue bars denote a histogram of data divided into 1 sec bins. Red curve is a Poisson curve with rate = median count rate of data. |
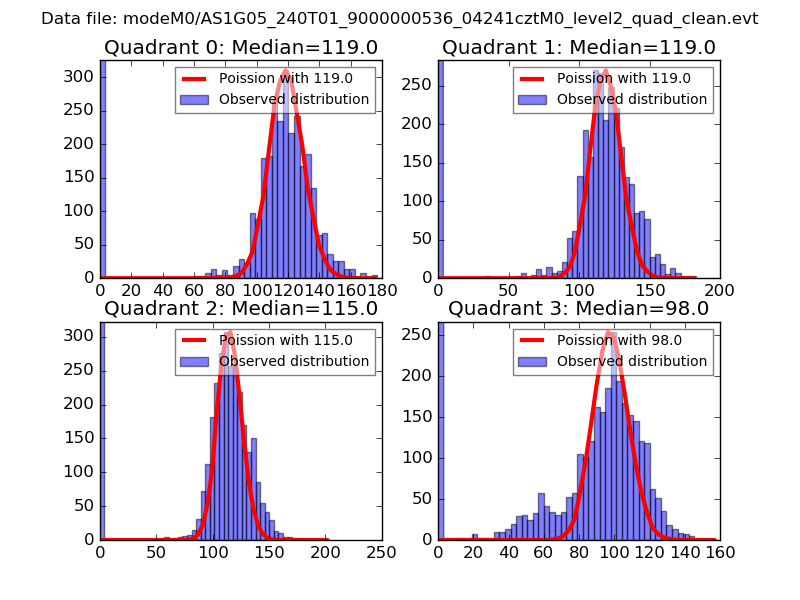 |
 |
| Quadrant-wise count rates Data is divided into 100 sec bins |
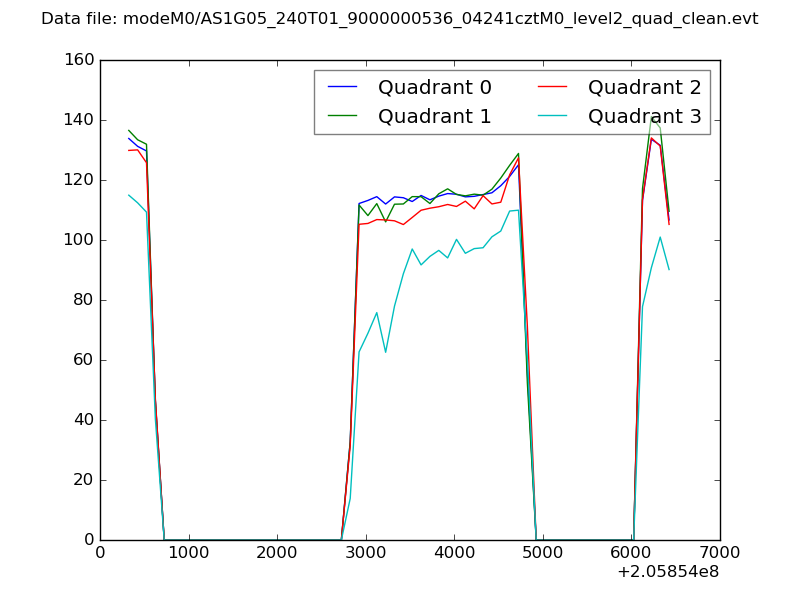 |
|
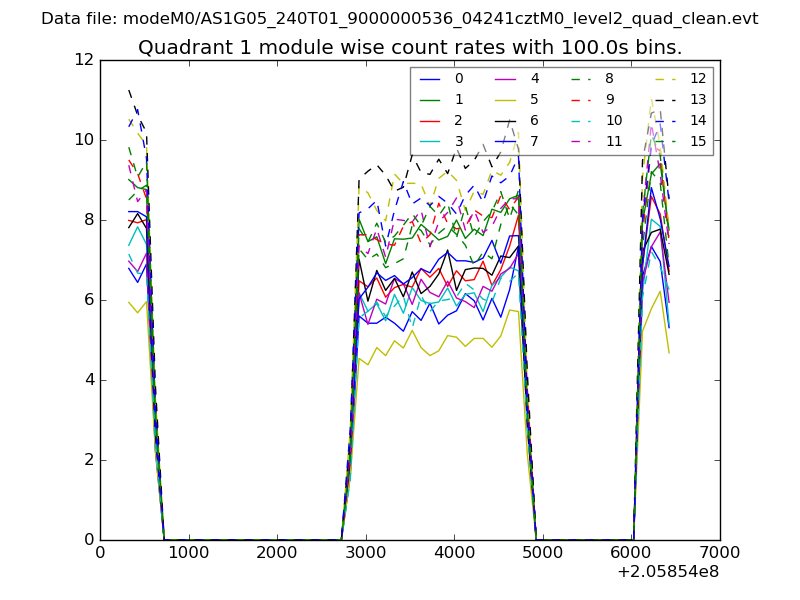
| Module-wise count rates for Quadrant A Data is divided into 100 sec bins |
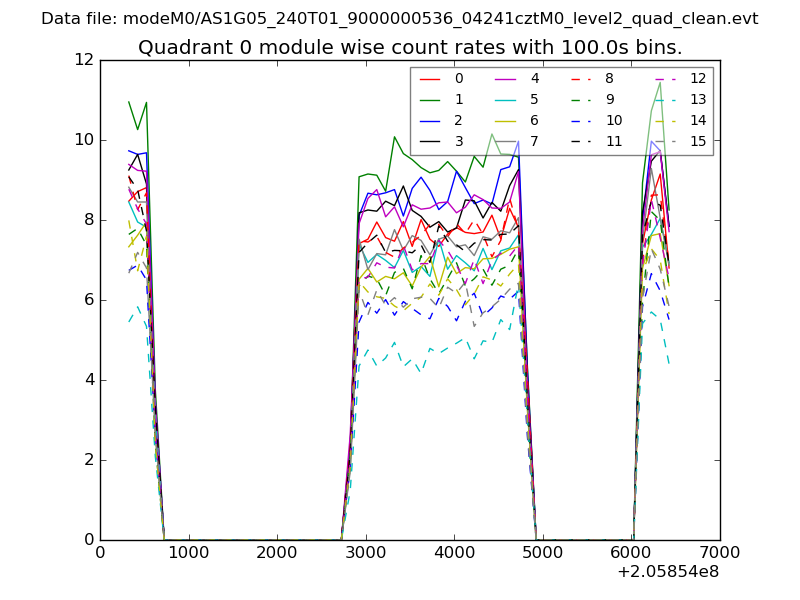 |
 |
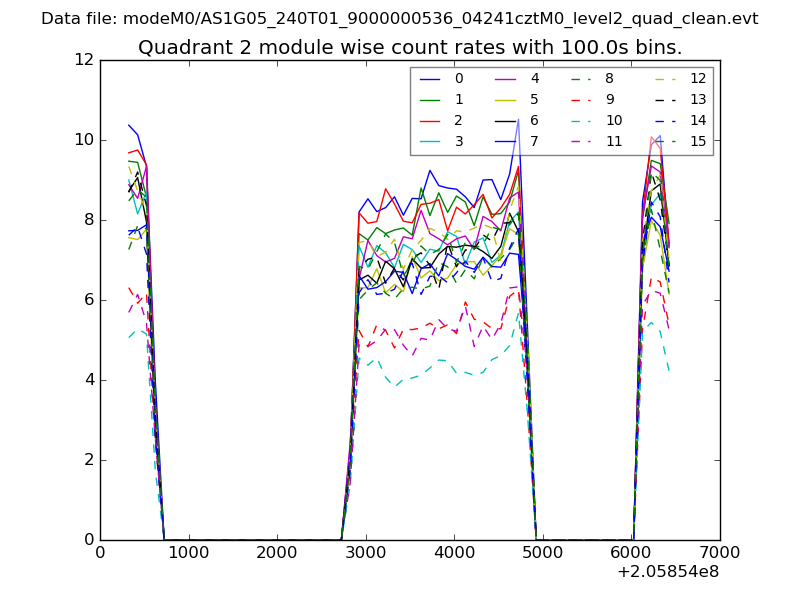
| Module-wise count rates for Quadrant B Data is divided into 100 sec bins |
 |
 |
| Module-wise count rates for Quadrant C Data is divided into 100 sec bins |
 |
 |
| Module-wise count rates for Quadrant D Data is divided into 100 sec bins |
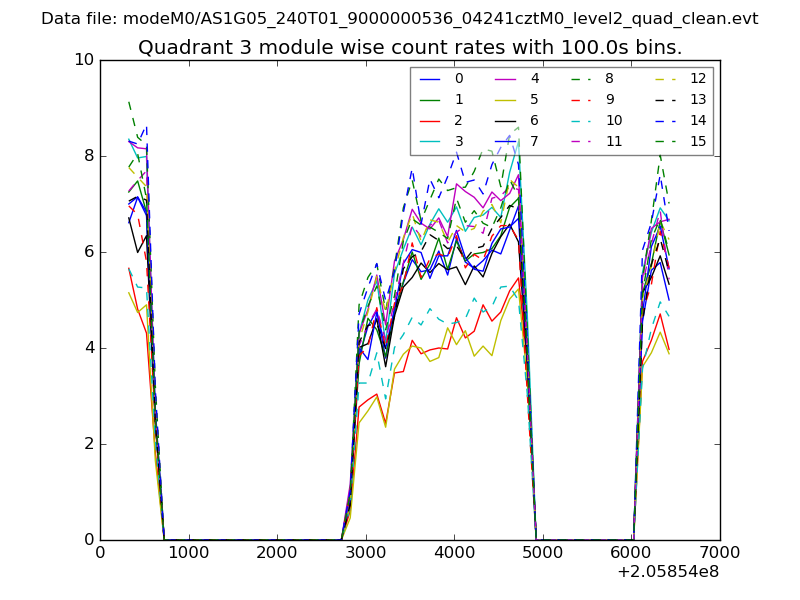 |
 |
| Parameter | Plot |
|---|---|
| CZT HV Monitor | 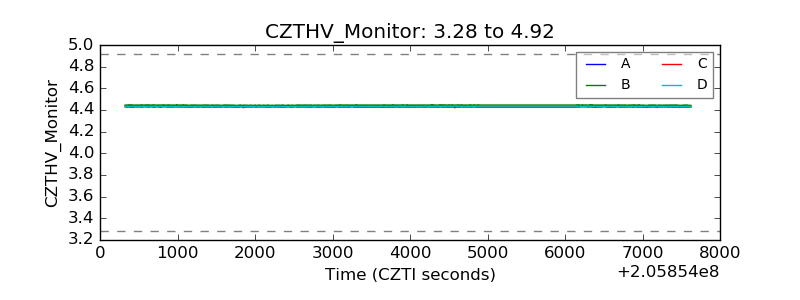 |
| D_VDD | 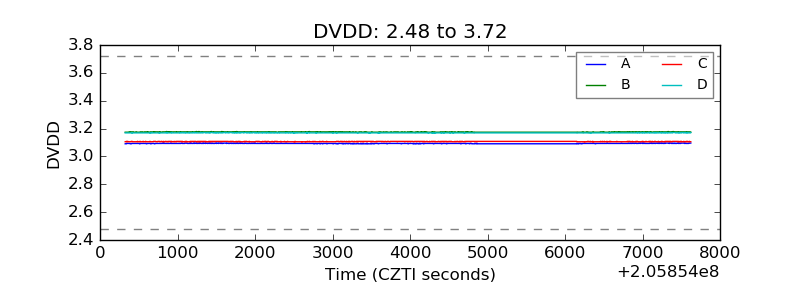 |
| Temperature 1 | 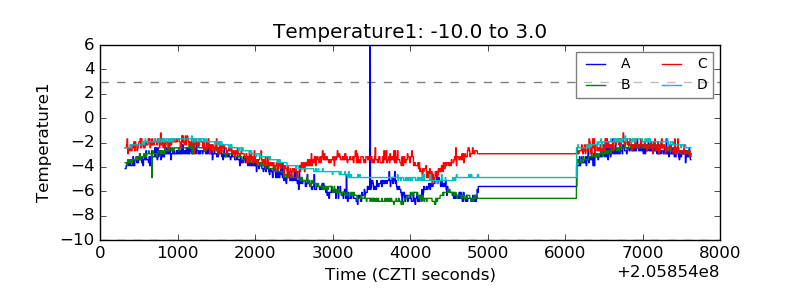 |
| Veto HV Monitor | 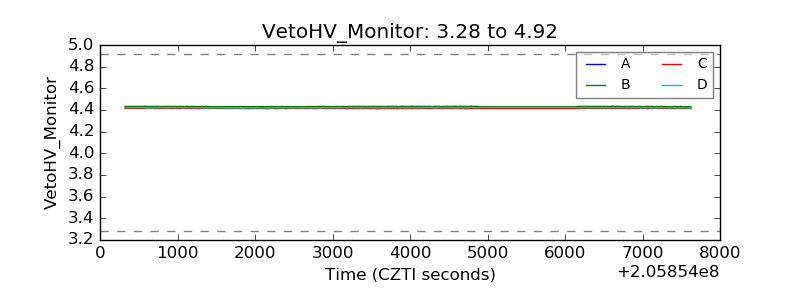 |
| Veto LLD | 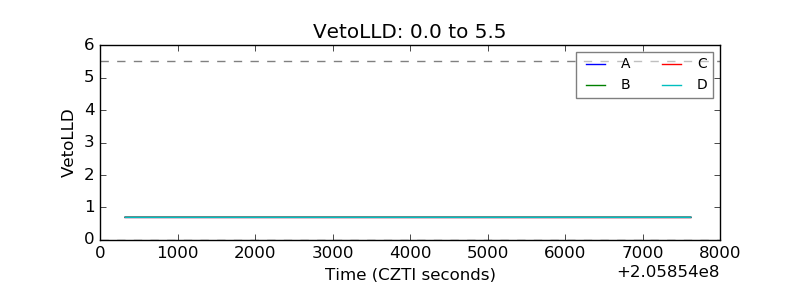 |
| Alpha Counter |  |
| _CPM_Rate |  |
| CZT Counter | 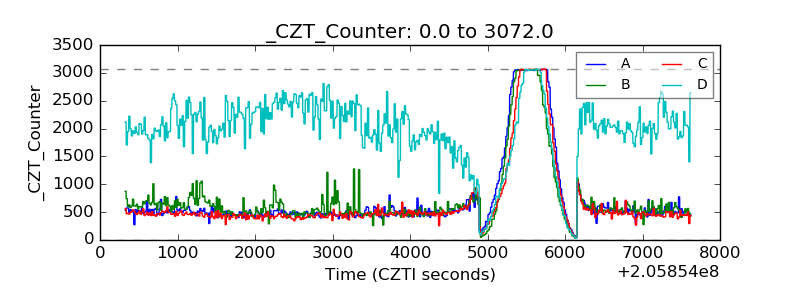 |
| +2.5 Volts monitor |  |
| +5 Volts monitor |  |
| _ROLL_ROT | 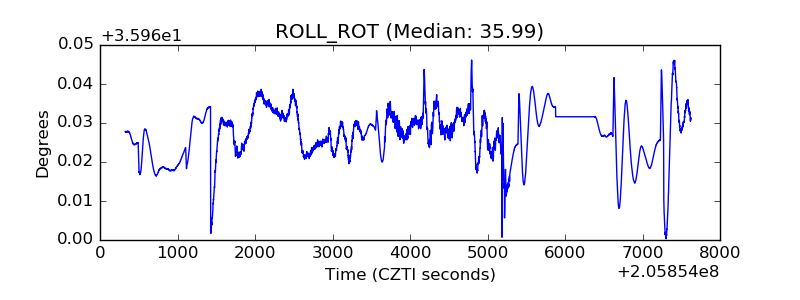 |
| _Roll_DEC | 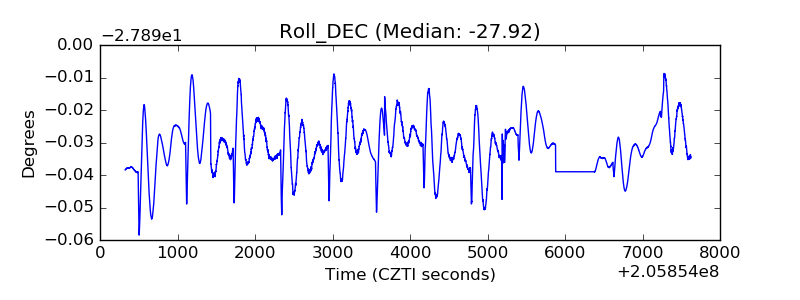 |
| _Roll_RA | 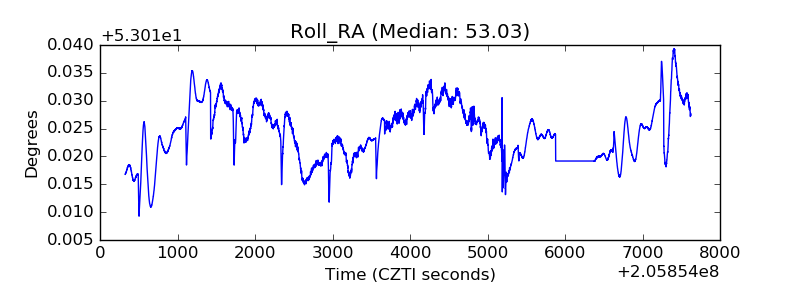 |
| Veto Counter | 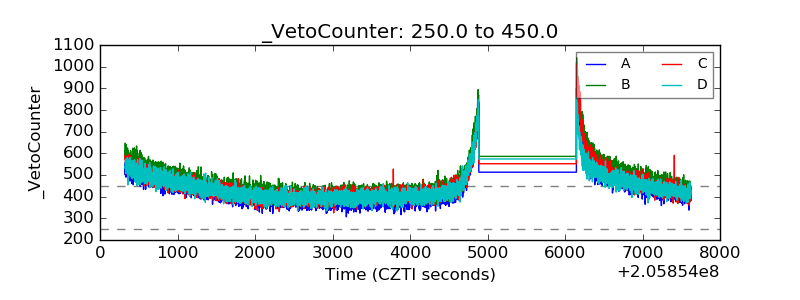 |