| Param | Original file | Final file |
|---|---|---|
| Filename | modeM0/AS1G05_240T01_9000000536_04242cztM0_level2.evt | modeM0/AS1G05_240T01_9000000536_04242cztM0_level2_quad_clean.evt |
| Size (bytes) | 737,634,240 | 49,815,360 |
| Size | 703.5 MB | 47.5 MB |
| Events in quadrant A | 4,444,740 | 256,081 |
| Events in quadrant B | 3,150,188 | 290,825 |
| Events in quadrant C | 2,863,997 | 281,949 |
| Events in quadrant D | 11,464,904 | 248,887 |
| Mode SS | |||
|---|---|---|---|
| Quadrant | BADHDUFLAG | Total packets | Discarded packets |
| A | 0 | 126 | 0 |
| B | 0 | 126 | 0 |
| C | 0 | 126 | 0 |
| D | 0 | 126 | 0 |
| Mode M9 | |||
|---|---|---|---|
| Quadrant | BADHDUFLAG | Total packets | Discarded packets |
| A | 0 | 12 | 0 |
| B | 0 | 12 | 0 |
| C | 0 | 12 | 0 |
| D | 0 | 12 | 0 |
| Mode M0 | |||
|---|---|---|---|
| Quadrant | BADHDUFLAG | Total packets | Discarded packets |
| A | 0 | 17048 | 2 |
| B | 0 | 13188 | 1 |
| C | 0 | 12628 | 1 |
| D | 0 | 38242 | 1 |
| Quadrant | Total seconds | Saturated seconds | Saturation percentage |
|---|---|---|---|
| A | 6150 | 657 | 10.682927% |
| B | 6150 | 91 | 1.479675% |
| C | 6150 | 41 | 0.666667% |
| D | 6150 | 2478 | 40.292683% |
Noise dominated data is calculated using 1-second bins in cleaned event files. If a bin has >2000 counts, and if more than 50% of those come from <1% of pixels, then it is considered to be noise-dominated and hence unusable.
| Quadrant | # 1 sec bins | Bins with >0 counts | Bins with >2000 counts | High rate bins dominated by noise | Noise dominated (total time) | Noise dominated (detector-on time) | Marked lightcurve |
|---|---|---|---|---|---|---|---|
| A | 7370 | 6150 | 468 | 468 | 6.35% | 7.61% | 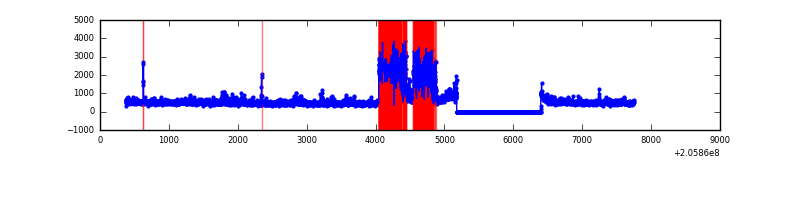 |
| B | 7370 | 6151 | 4 | 4 | 0.05% | 0.07% | 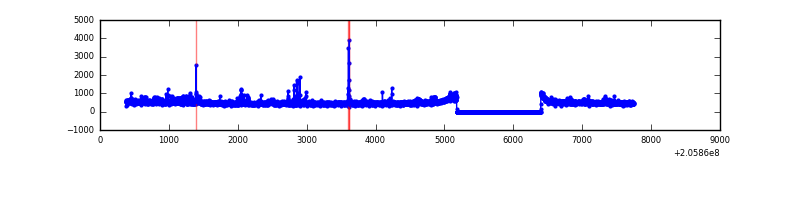 |
| C | 7370 | 6151 | 0 | 0 | 0.00% | 0.00% | 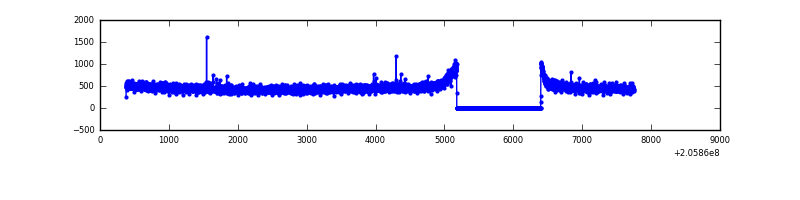 |
| D | 7370 | 6151 | 2524 | 2524 | 34.25% | 41.03% | 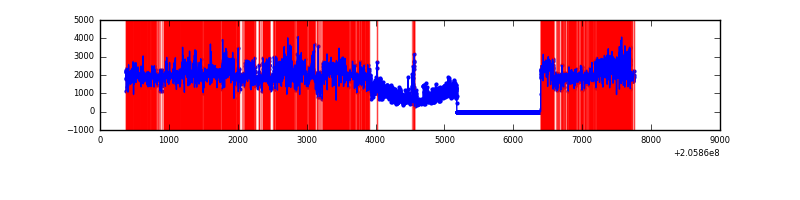 |
Top three noisy pixels from each quadrant. If the there are fewer than three noisy pixels in the level2.evt file, extra rows are filled as -1
| Pixel properties | Quadrant properties | ||||||
|---|---|---|---|---|---|---|---|
| Quadrant | DetID | PixID | Counts | Sigma | Mean | Median | Sigma |
| A | 0 | 50 | 1414574 | 9616.83 | 728 | 712 | 147.0 |
| A | 8 | 15 | 120106 | 812.1 | 728 | 712 | 147.0 |
| A | 0 | 149 | 47281 | 316.75 | 728 | 712 | 147.0 |
| B | 3 | 0 | 54609 | 367.66 | 765 | 751 | 146.5 |
| B | 4 | 48 | 28844 | 191.77 | 765 | 751 | 146.5 |
| B | 14 | 167 | 28440 | 189.02 | 765 | 751 | 146.5 |
| C | 10 | 65 | 20546 | 117.45 | 726 | 731 | 168.7 |
| C | 9 | 144 | 7208 | 38.39 | 726 | 731 | 168.7 |
| C | 13 | 61 | 5957 | 30.98 | 726 | 731 | 168.7 |
| D | 2 | 63 | 8257125 | 51715.54 | 660 | 641 | 159.7 |
| D | 2 | 232 | 291081 | 1819.21 | 660 | 641 | 159.7 |
| D | 1 | 52 | 145422 | 906.85 | 660 | 641 | 159.7 |
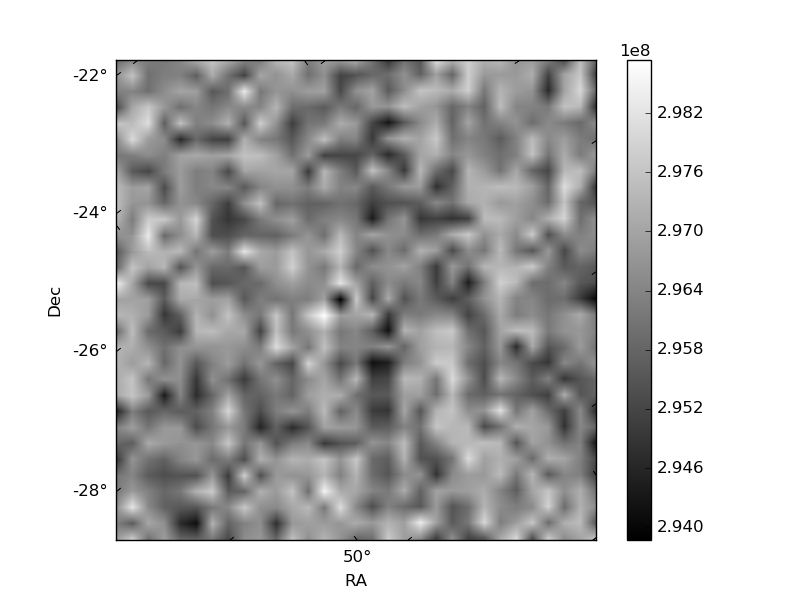
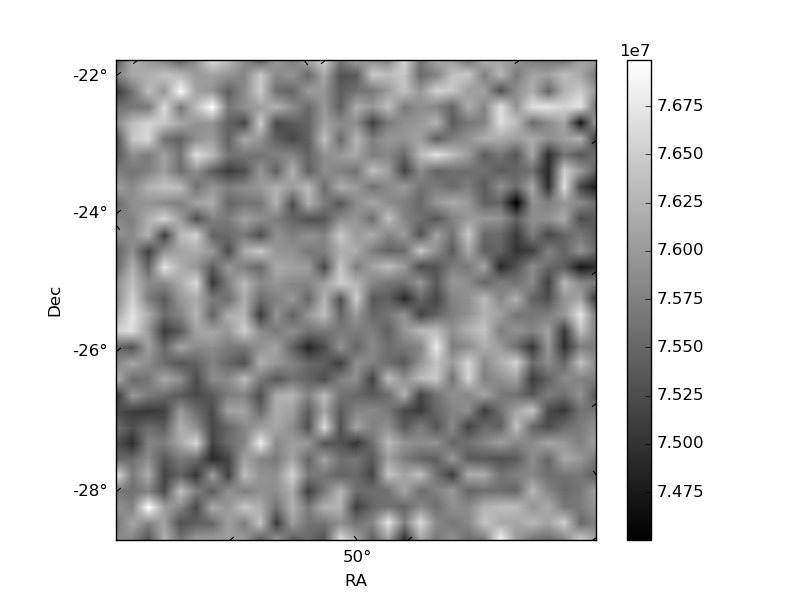
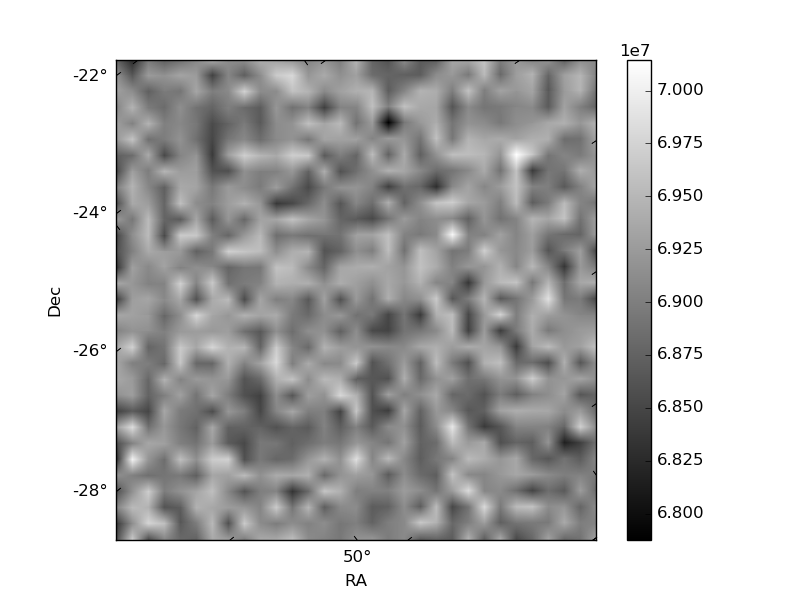
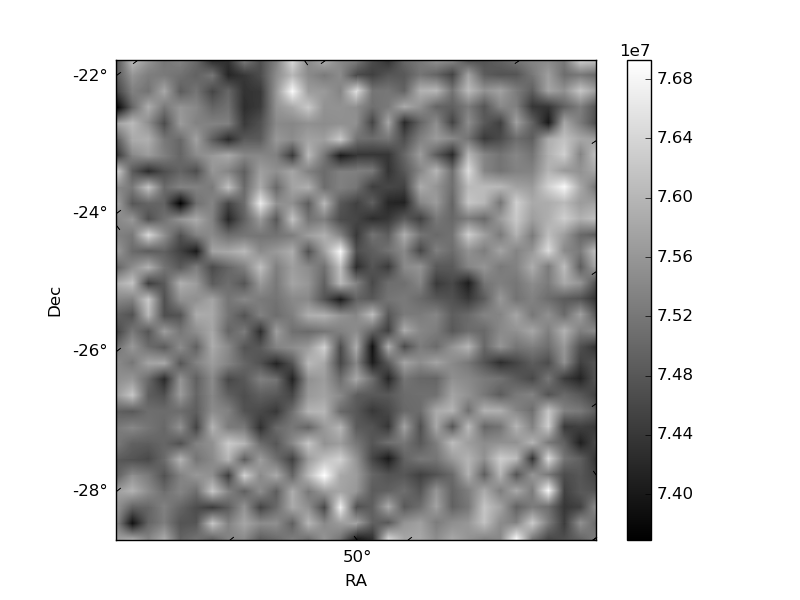
Histogram calculated using DETX and DETY for each event in the final _common_clean file
| Quadrant A | 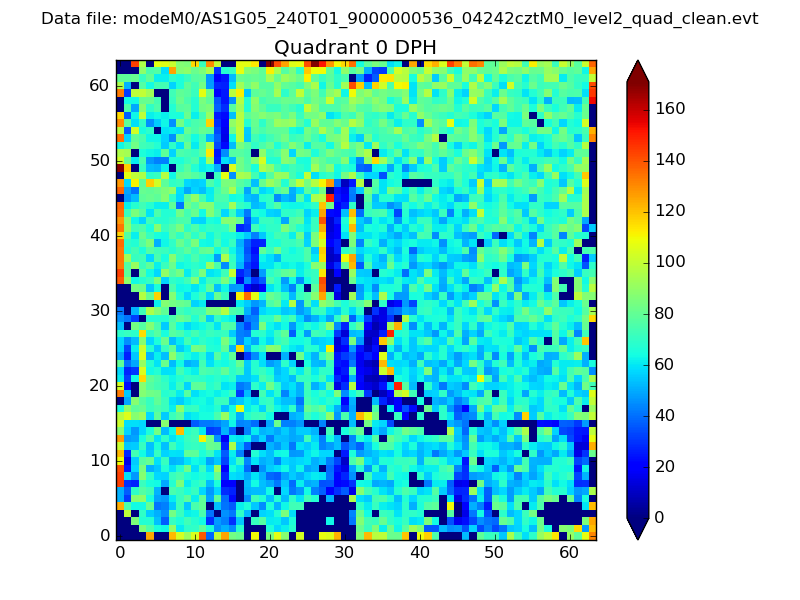 |
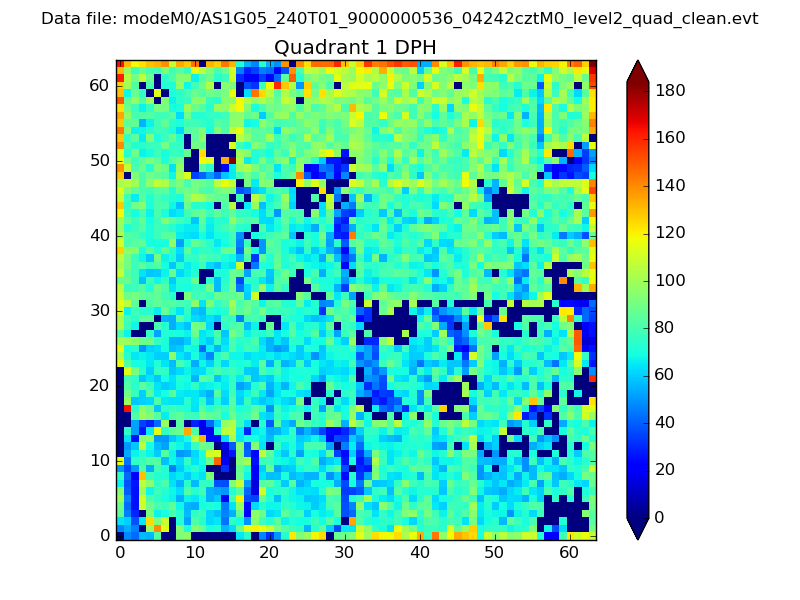 |
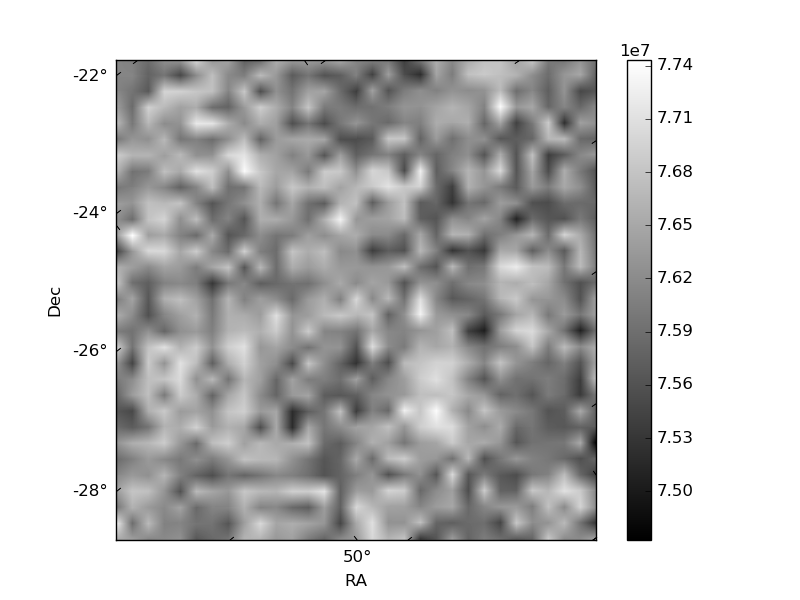
Quadrant B |
|---|---|---|---|
| Quadrant D | 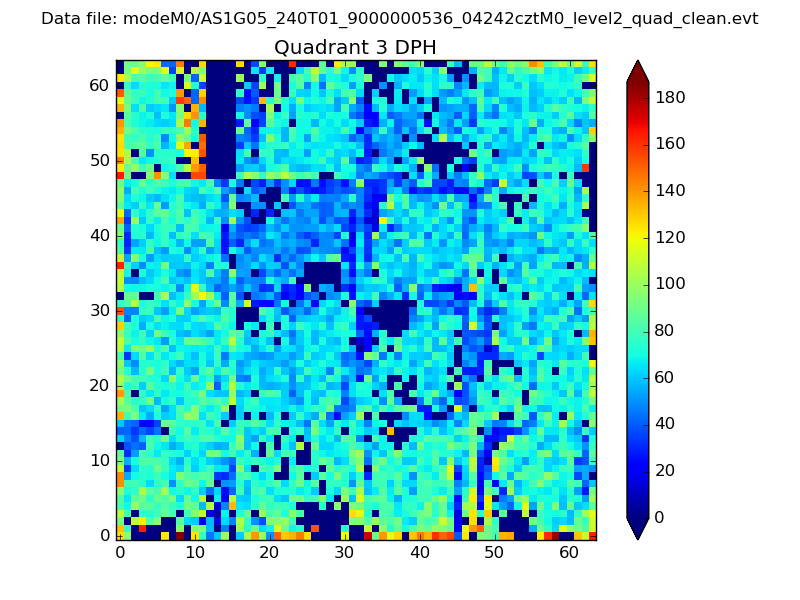 |
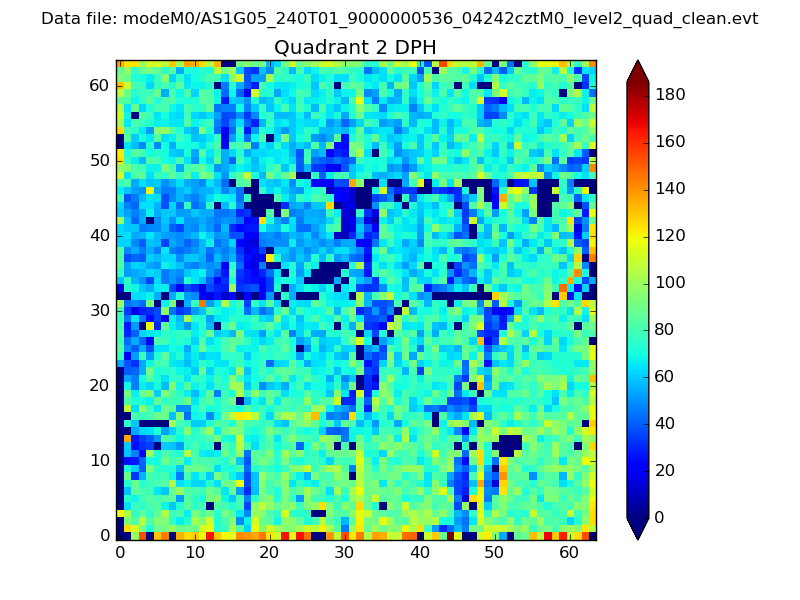 |
Quadrant C |
| Plot type | Count rate plots | Images |
|---|---|---|
| Comparison with Poisson distribution Blue bars denote a histogram of data divided into 1 sec bins. Red curve is a Poisson curve with rate = median count rate of data. |
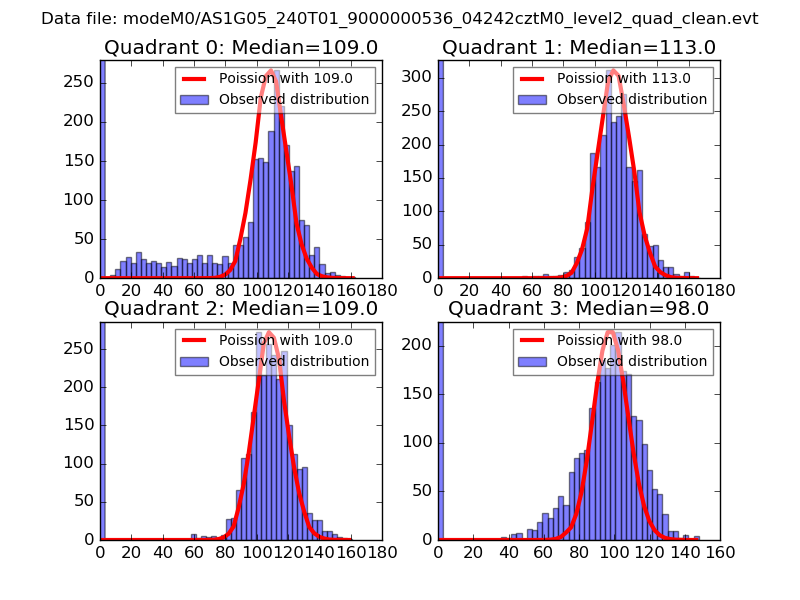 |
 |
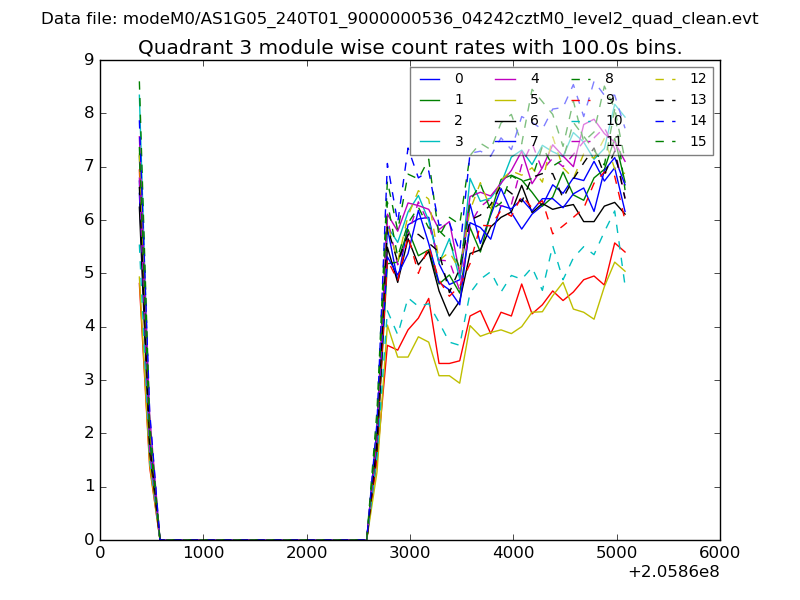
| Quadrant-wise count rates Data is divided into 100 sec bins |
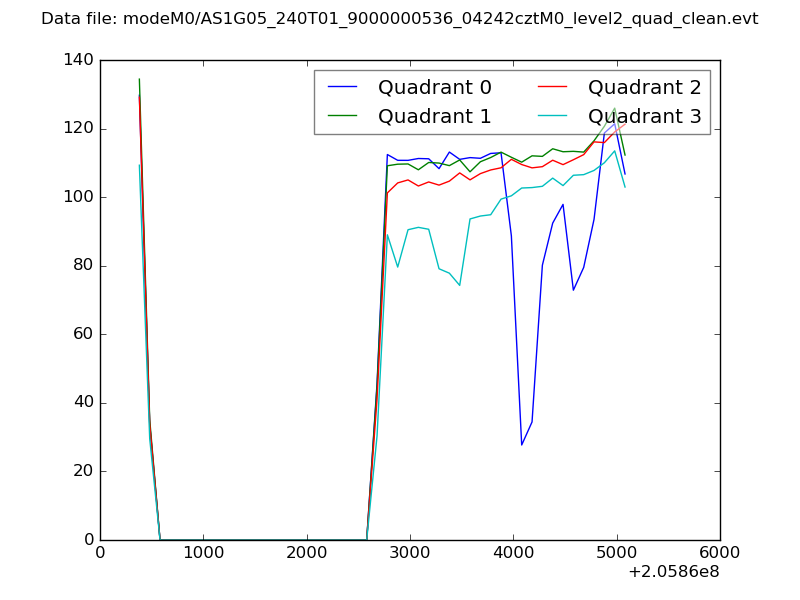 |
|
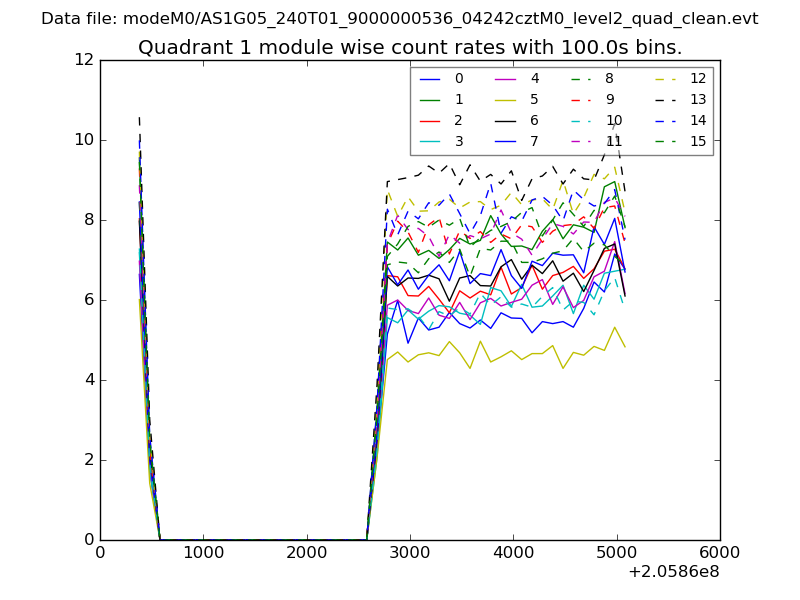
| Module-wise count rates for Quadrant A Data is divided into 100 sec bins |
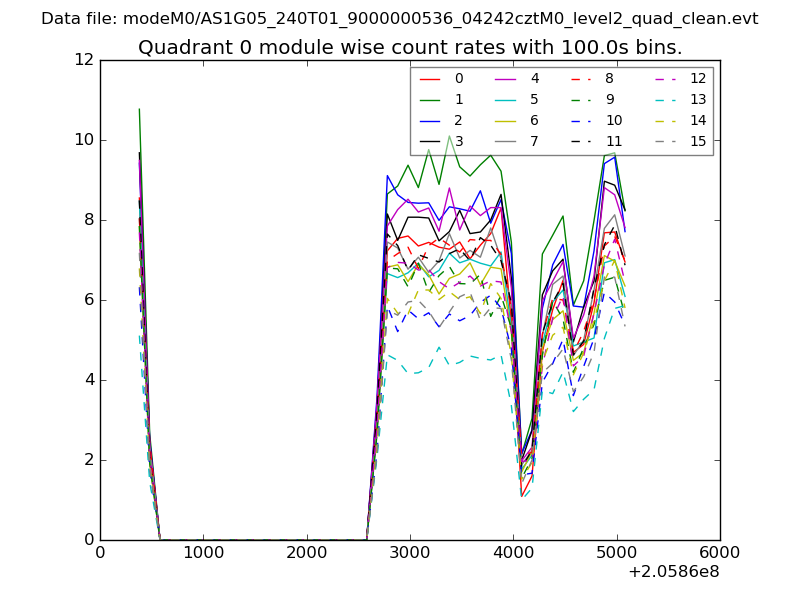 |
 |
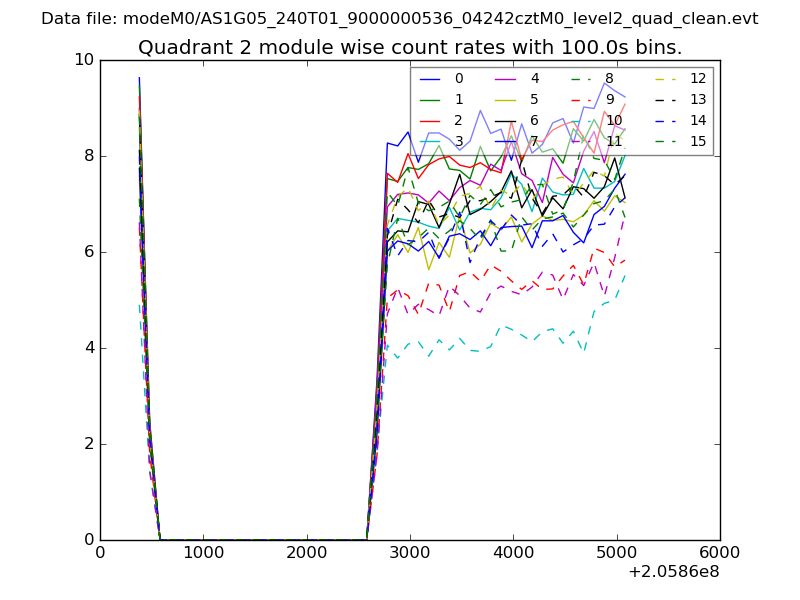
| Module-wise count rates for Quadrant B Data is divided into 100 sec bins |
 |
 |
| Module-wise count rates for Quadrant C Data is divided into 100 sec bins |
 |
 |
| Module-wise count rates for Quadrant D Data is divided into 100 sec bins |
 |
 |
| Parameter | Plot |
|---|---|
| CZT HV Monitor | 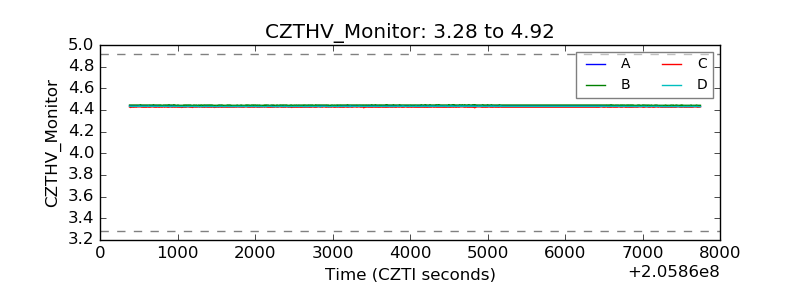 |
| D_VDD | 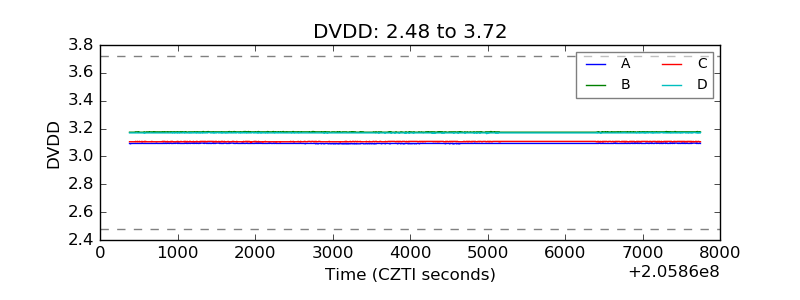 |
| Temperature 1 | 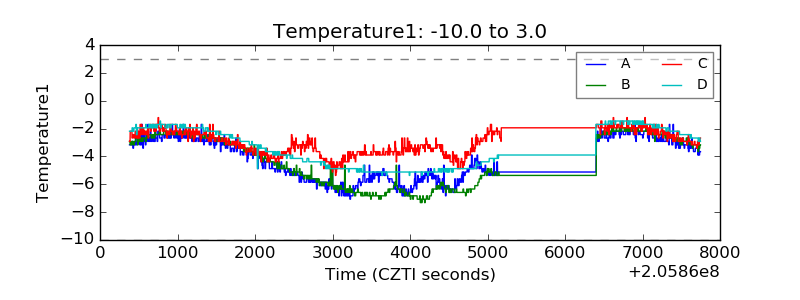 |
| Veto HV Monitor | 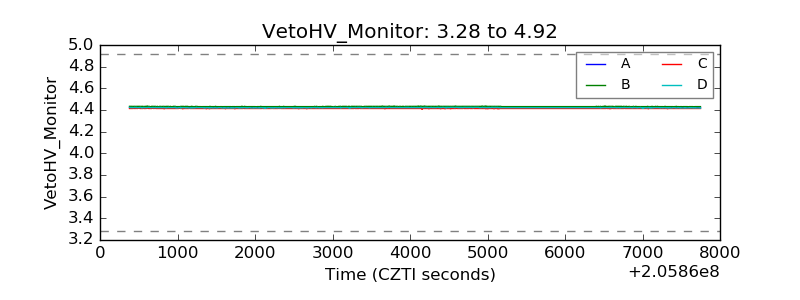 |
| Veto LLD | 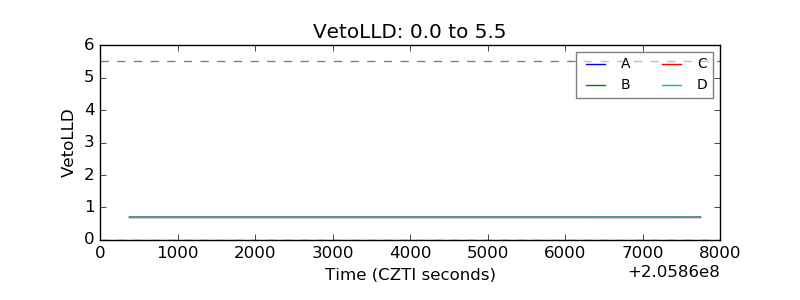 |
| Alpha Counter |  |
| _CPM_Rate | 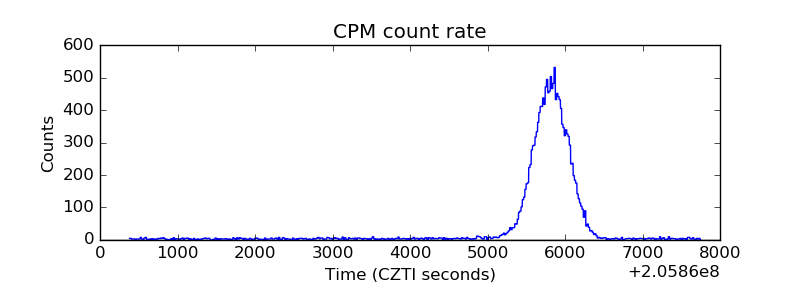 |
| CZT Counter |  |
| +2.5 Volts monitor |  |
| +5 Volts monitor |  |
| _ROLL_ROT | 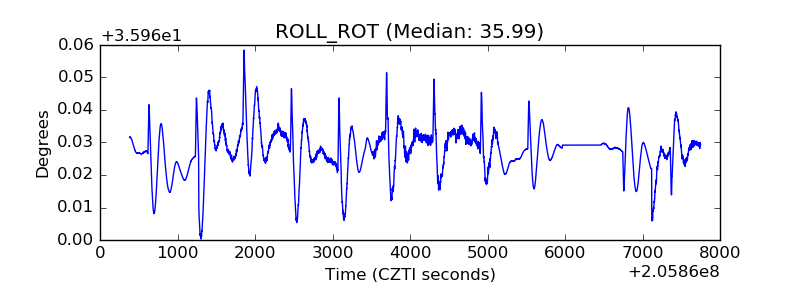 |
| _Roll_DEC | 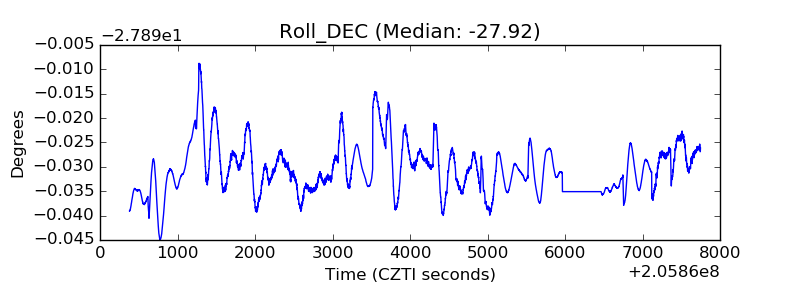 |
| _Roll_RA | 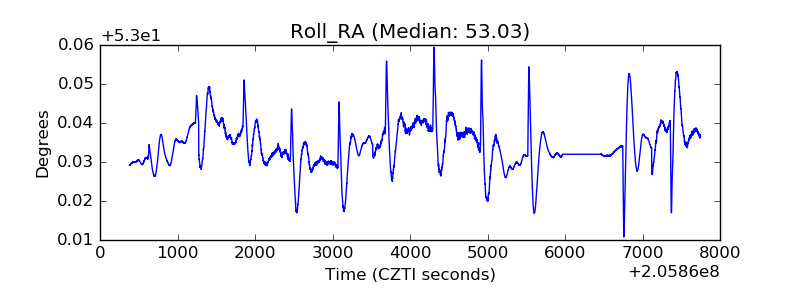 |
| Veto Counter | 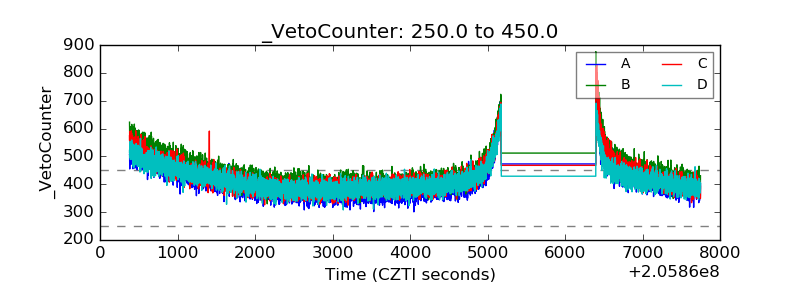 |