| Param | Original file | Final file |
|---|---|---|
| Filename | modeM0/AS1G05_240T01_9000000536_04243cztM0_level2.evt | modeM0/AS1G05_240T01_9000000536_04243cztM0_level2_quad_clean.evt |
| Size (bytes) | 697,328,640 | 57,602,880 |
| Size | 665.0 MB | 54.9 MB |
| Events in quadrant A | 3,717,624 | 331,272 |
| Events in quadrant B | 3,328,449 | 335,961 |
| Events in quadrant C | 3,030,899 | 325,369 |
| Events in quadrant D | 10,591,618 | 286,594 |
| Mode SS | |||
|---|---|---|---|
| Quadrant | BADHDUFLAG | Total packets | Discarded packets |
| A | 0 | 136 | 0 |
| B | 0 | 136 | 0 |
| C | 0 | 136 | 0 |
| D | 0 | 136 | 0 |
| Mode M9 | |||
|---|---|---|---|
| Quadrant | BADHDUFLAG | Total packets | Discarded packets |
| A | 0 | 9 | 0 |
| B | 0 | 9 | 0 |
| C | 0 | 9 | 0 |
| D | 0 | 9 | 0 |
| Mode M0 | |||
|---|---|---|---|
| Quadrant | BADHDUFLAG | Total packets | Discarded packets |
| A | 0 | 15397 | 3 |
| B | 0 | 14235 | 2 |
| C | 0 | 13676 | 2 |
| D | 0 | 36020 | 2 |
| Quadrant | Total seconds | Saturated seconds | Saturation percentage |
|---|---|---|---|
| A | 6655 | 230 | 3.456048% |
| B | 6655 | 115 | 1.728024% |
| C | 6655 | 57 | 0.856499% |
| D | 6655 | 1925 | 28.925620% |
Noise dominated data is calculated using 1-second bins in cleaned event files. If a bin has >2000 counts, and if more than 50% of those come from <1% of pixels, then it is considered to be noise-dominated and hence unusable.
| Quadrant | # 1 sec bins | Bins with >0 counts | Bins with >2000 counts | High rate bins dominated by noise | Noise dominated (total time) | Noise dominated (detector-on time) | Marked lightcurve |
|---|---|---|---|---|---|---|---|
| A | 7585 | 6656 | 105 | 105 | 1.38% | 1.58% | 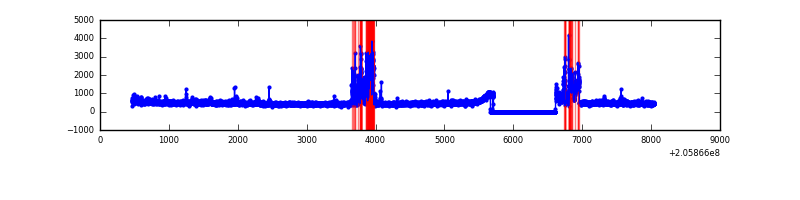 |
| B | 7585 | 6657 | 7 | 7 | 0.09% | 0.11% | 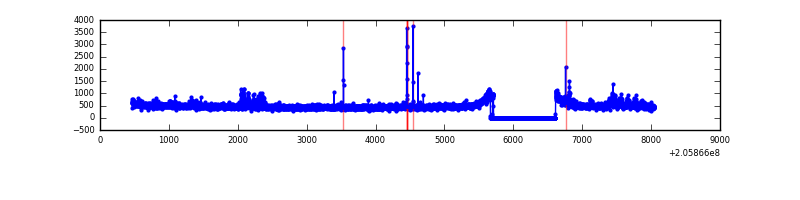 |
| C | 7585 | 6657 | 2 | 2 | 0.03% | 0.03% | 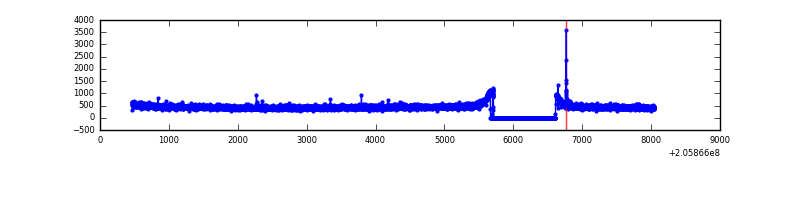 |
| D | 7585 | 6657 | 1903 | 1903 | 25.09% | 28.59% | 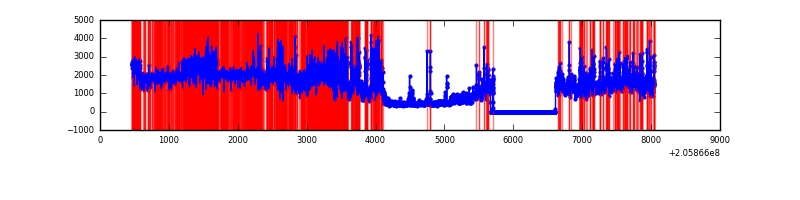 |
Top three noisy pixels from each quadrant. If the there are fewer than three noisy pixels in the level2.evt file, extra rows are filled as -1
| Pixel properties | Quadrant properties | ||||||
|---|---|---|---|---|---|---|---|
| Quadrant | DetID | PixID | Counts | Sigma | Mean | Median | Sigma |
| A | 0 | 50 | 345225 | 2115.3 | 793 | 774 | 162.8 |
| A | 14 | 111 | 189720 | 1160.33 | 793 | 774 | 162.8 |
| A | 8 | 15 | 51974 | 314.42 | 793 | 774 | 162.8 |
| B | 8 | 3 | 93780 | 597.7 | 805 | 787 | 155.6 |
| B | 4 | 81 | 34795 | 218.58 | 805 | 787 | 155.6 |
| B | 15 | 204 | 31937 | 200.21 | 805 | 787 | 155.6 |
| C | 10 | 65 | 13928 | 73.27 | 767 | 772 | 179.6 |
| C | 1 | 0 | 13539 | 71.1 | 767 | 772 | 179.6 |
| C | 13 | 61 | 6433 | 31.53 | 767 | 772 | 179.6 |
| D | 2 | 63 | 6812206 | 39264.15 | 704 | 683 | 173.5 |
| D | 2 | 232 | 544072 | 3132.3 | 704 | 683 | 173.5 |
| D | 11 | 132 | 330804 | 1902.94 | 704 | 683 | 173.5 |
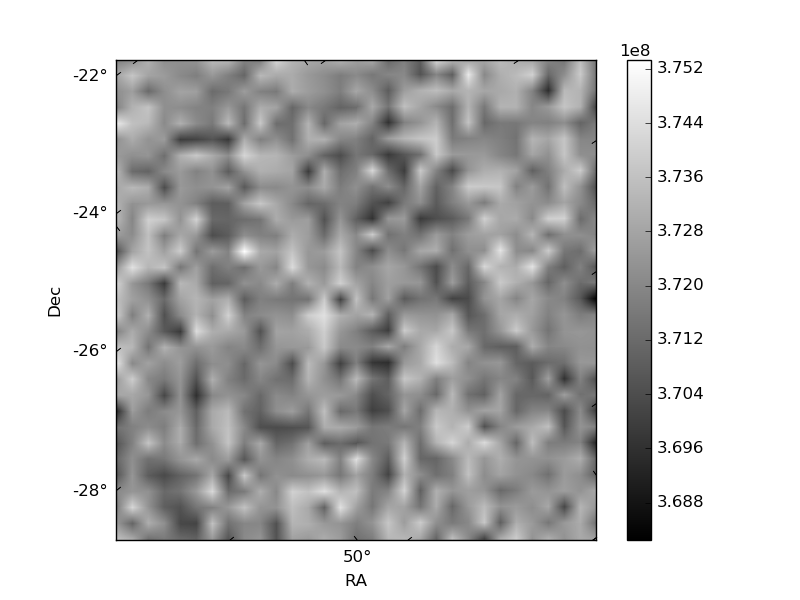
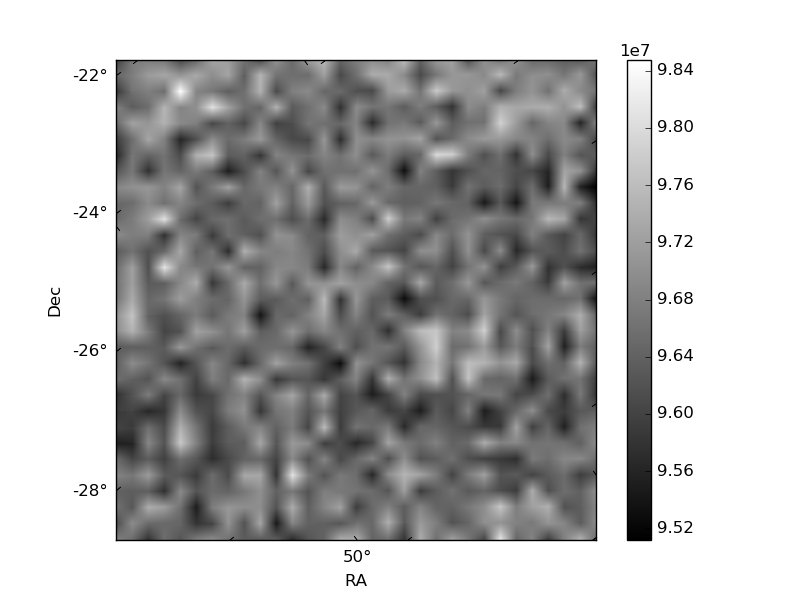
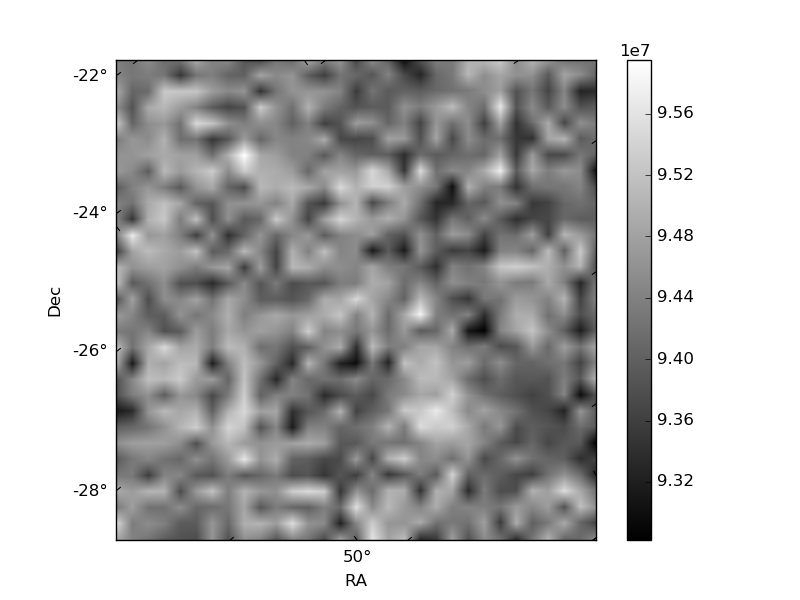
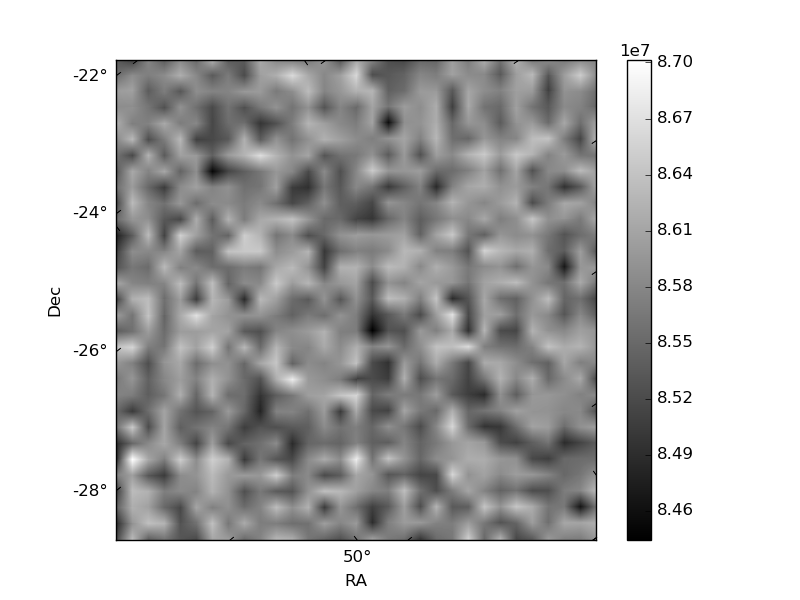
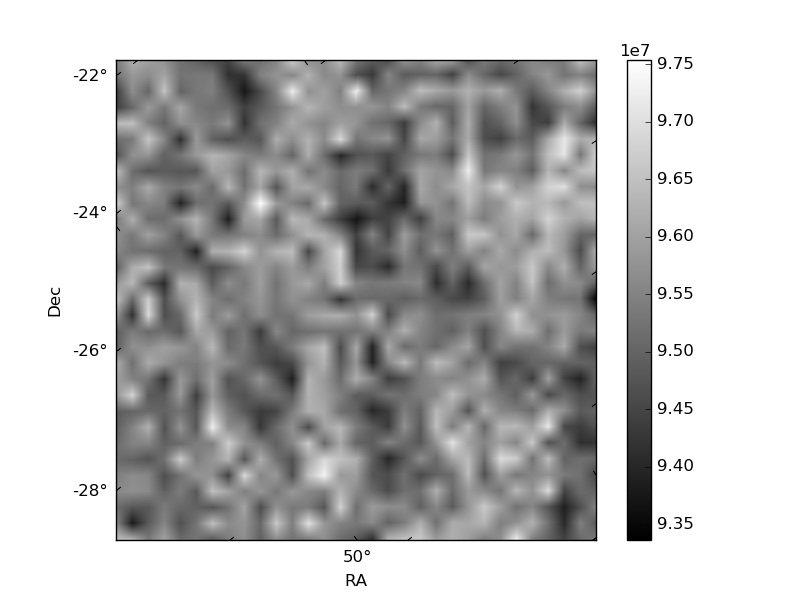
Histogram calculated using DETX and DETY for each event in the final _common_clean file
| Quadrant A | 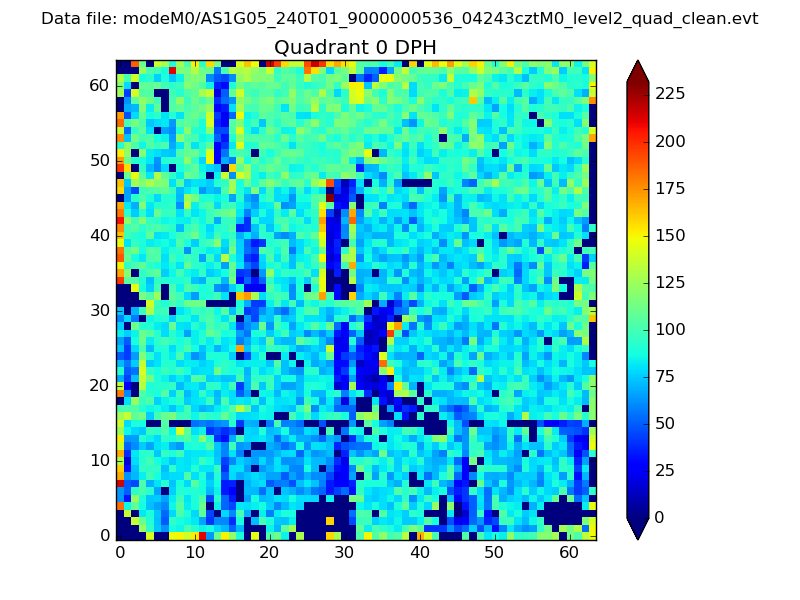 |
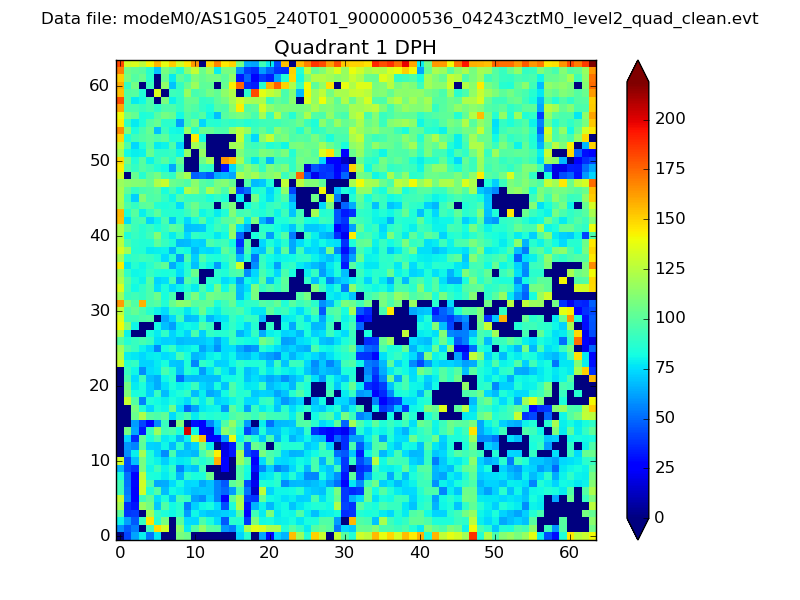 |
Quadrant B |
|---|---|---|---|
| Quadrant D |  |
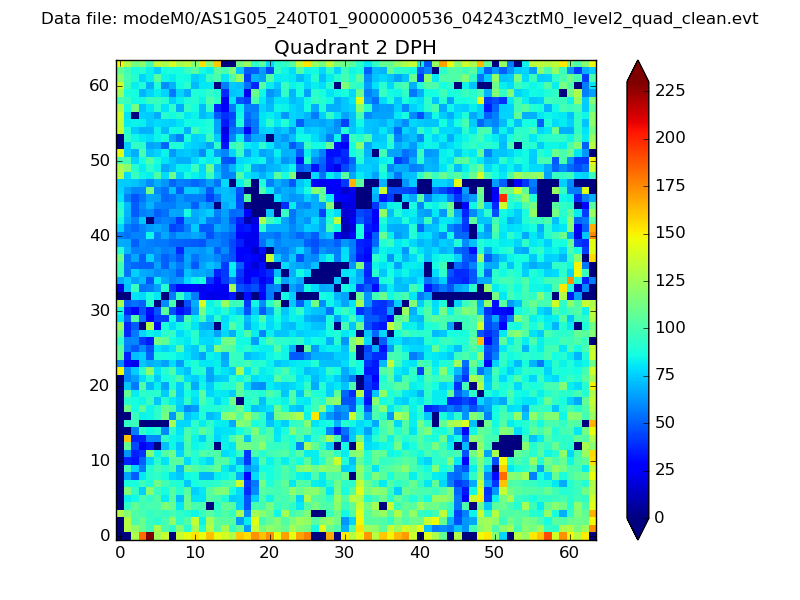 |
Quadrant C |
| Plot type | Count rate plots | Images |
|---|---|---|
| Comparison with Poisson distribution Blue bars denote a histogram of data divided into 1 sec bins. Red curve is a Poisson curve with rate = median count rate of data. |
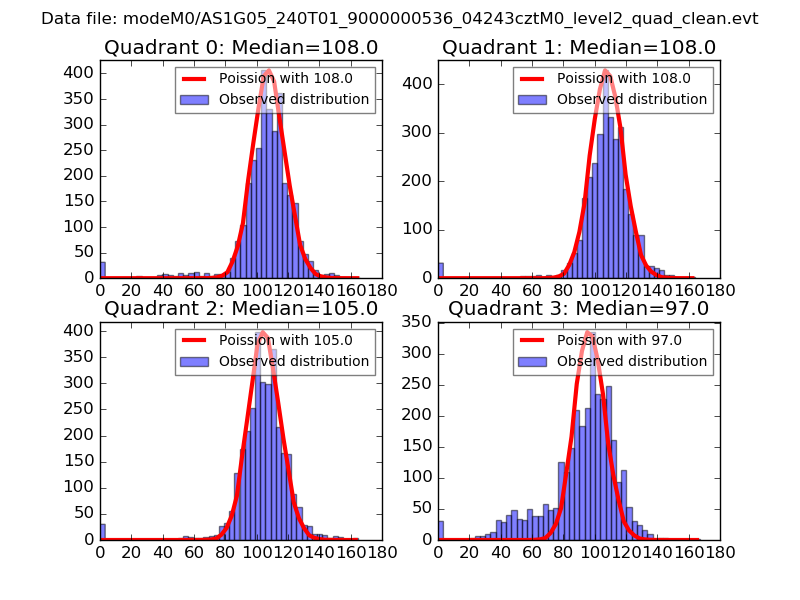 |
 |
| Quadrant-wise count rates Data is divided into 100 sec bins |
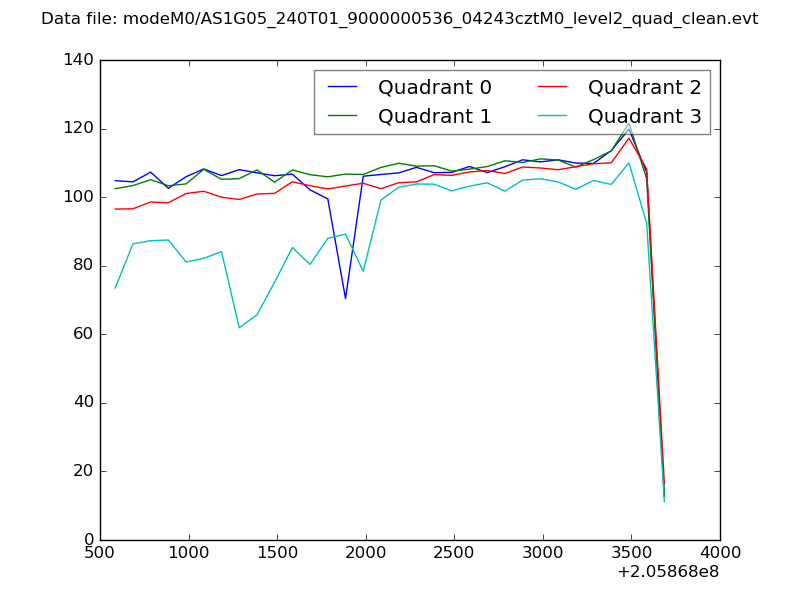 |
|
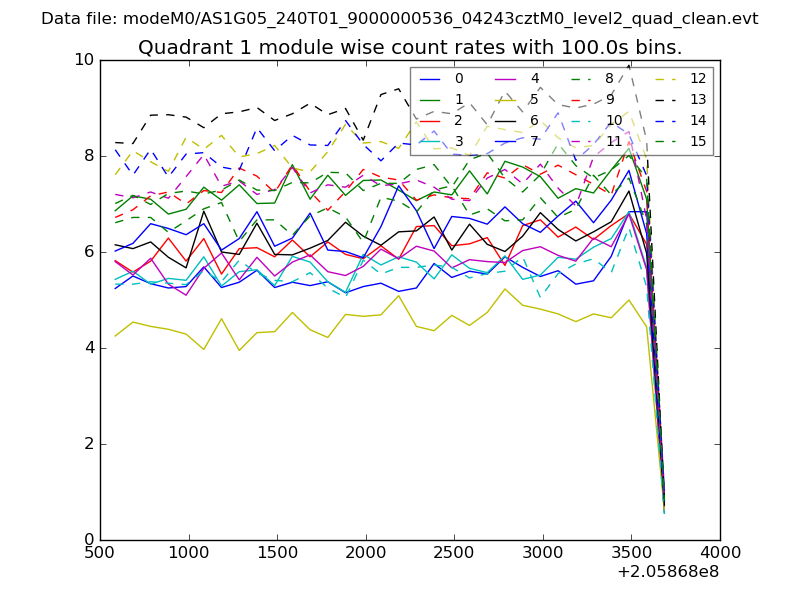
| Module-wise count rates for Quadrant A Data is divided into 100 sec bins |
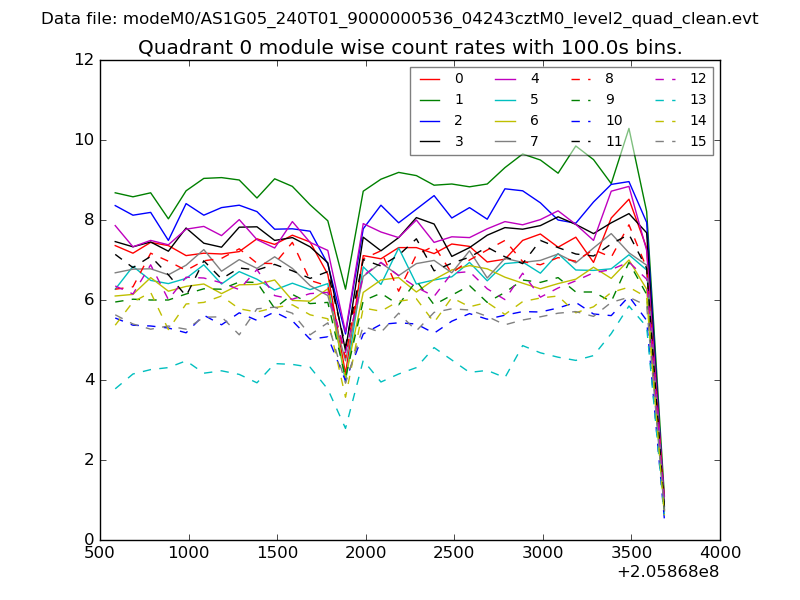 |
 |
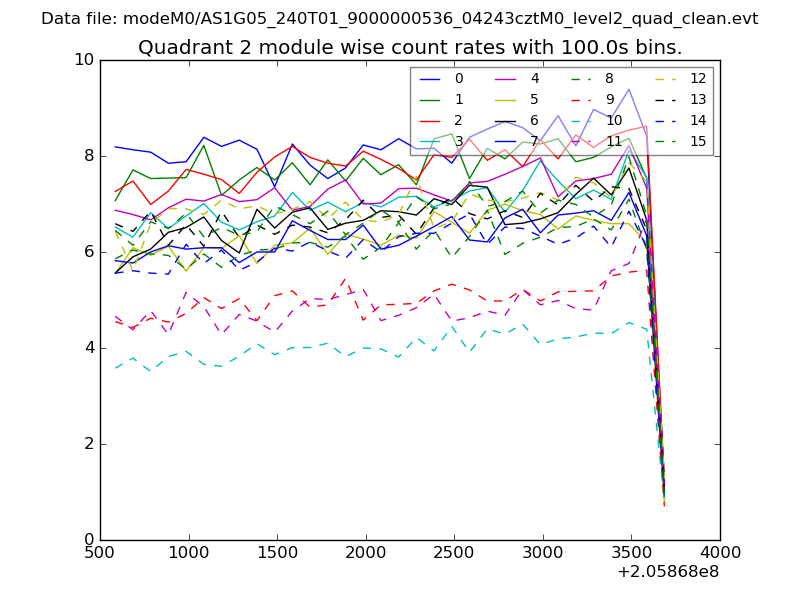
| Module-wise count rates for Quadrant B Data is divided into 100 sec bins |
 |
 |
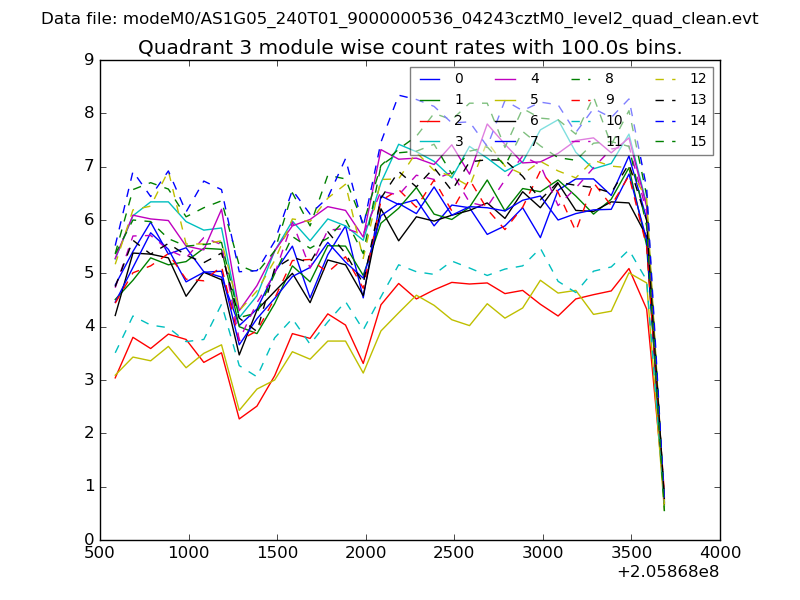
| Module-wise count rates for Quadrant C Data is divided into 100 sec bins |
 |
 |
| Module-wise count rates for Quadrant D Data is divided into 100 sec bins |
 |
 |
| Parameter | Plot |
|---|---|
| CZT HV Monitor | 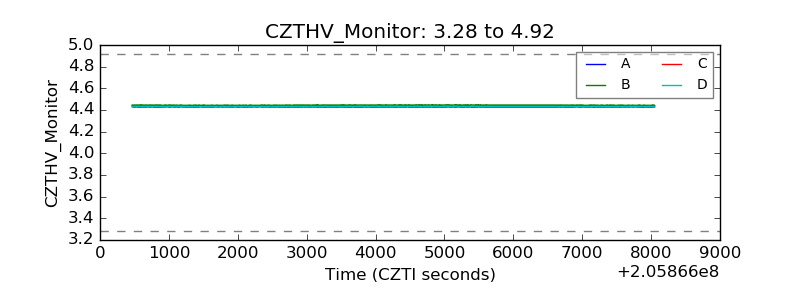 |
| D_VDD | 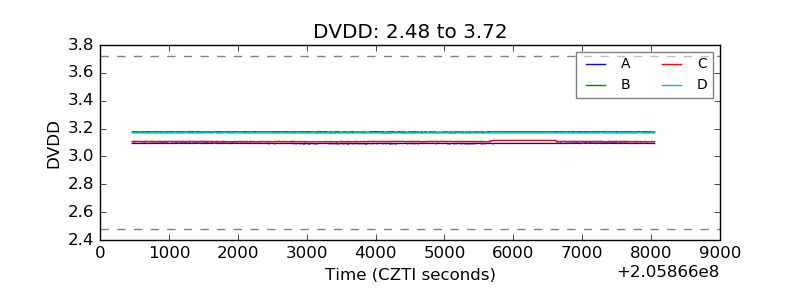 |
| Temperature 1 | 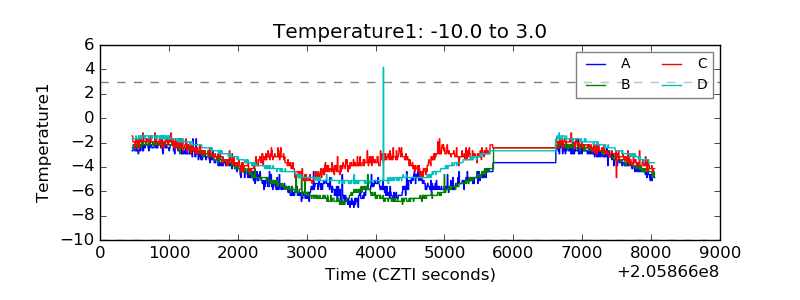 |
| Veto HV Monitor | 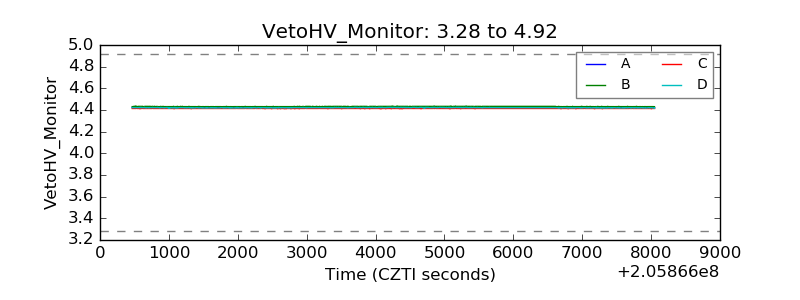 |
| Veto LLD | 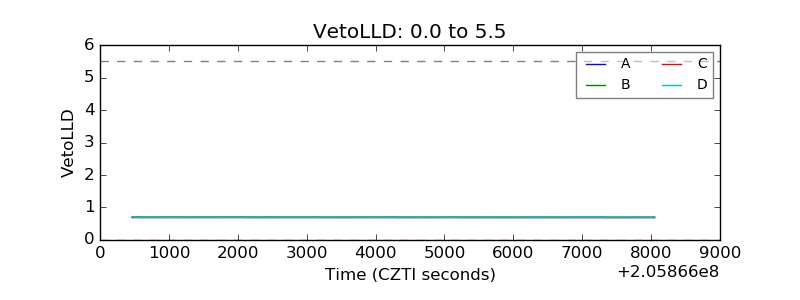 |
| Alpha Counter | 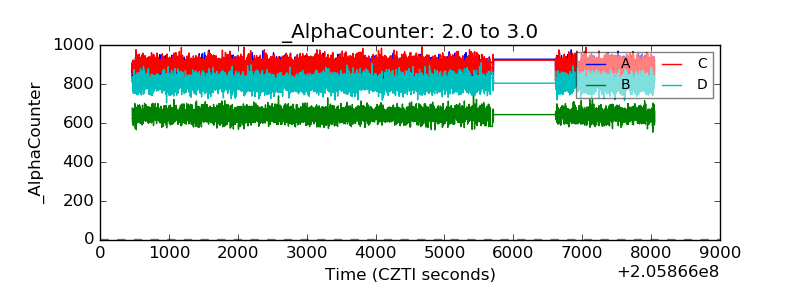 |
| _CPM_Rate | 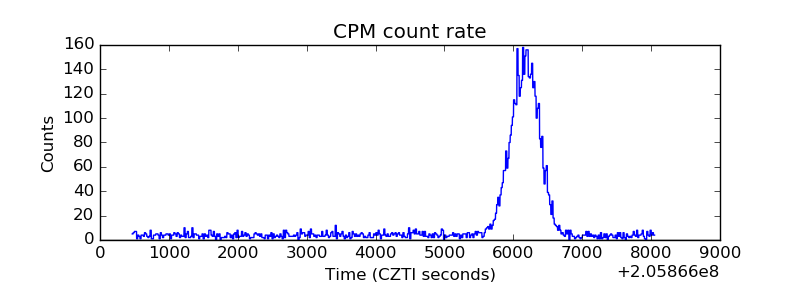 |
| CZT Counter | 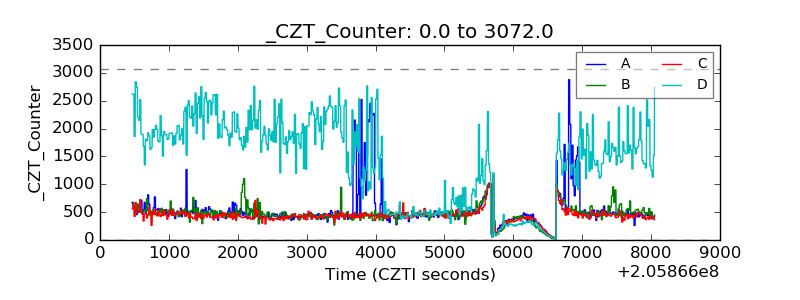 |
| +2.5 Volts monitor |  |
| +5 Volts monitor | 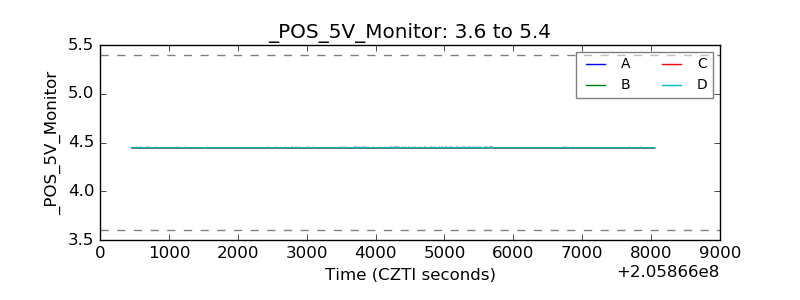 |
| _ROLL_ROT | 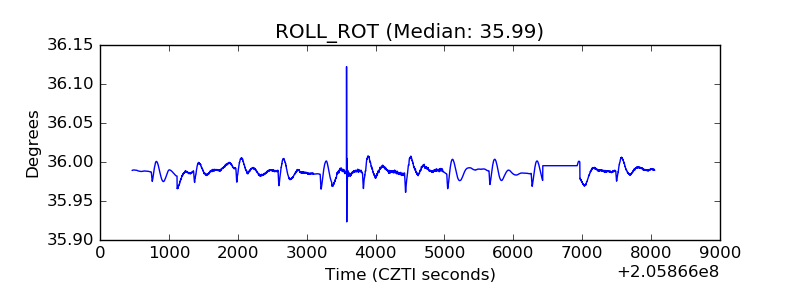 |
| _Roll_DEC | 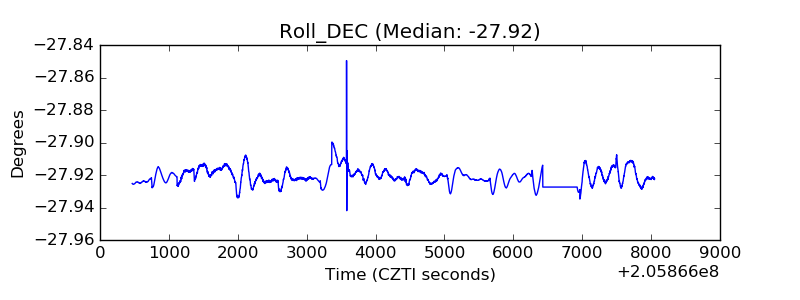 |
| _Roll_RA | 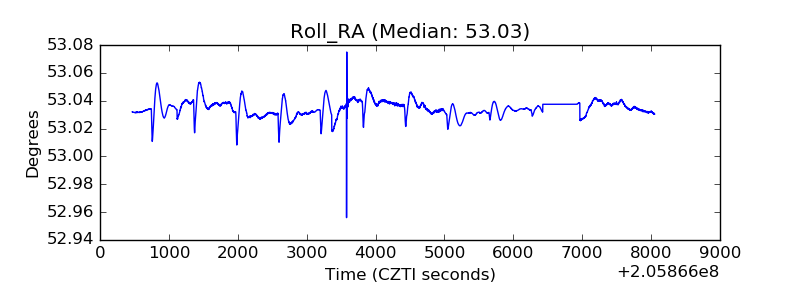 |
| Veto Counter | 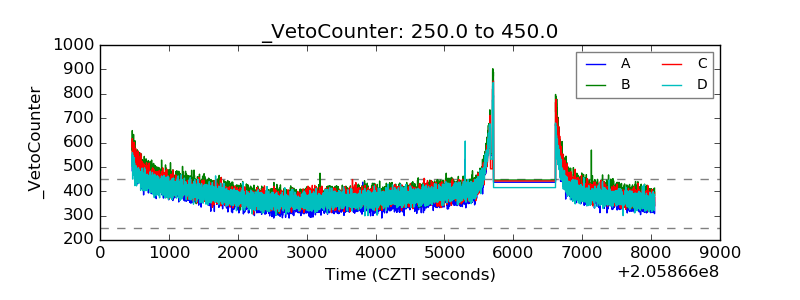 |