| Param | Original file | Final file |
|---|---|---|
| Filename | modeM0/AS1G05_240T01_9000000536_04244cztM0_level2.evt | modeM0/AS1G05_240T01_9000000536_04244cztM0_level2_quad_clean.evt |
| Size (bytes) | 640,275,840 | 65,056,320 |
| Size | 610.6 MB | 62.0 MB |
| Events in quadrant A | 3,454,590 | 387,606 |
| Events in quadrant B | 3,431,524 | 384,483 |
| Events in quadrant C | 3,044,787 | 375,135 |
| Events in quadrant D | 8,992,336 | 340,563 |
| Mode SS | |||
|---|---|---|---|
| Quadrant | BADHDUFLAG | Total packets | Discarded packets |
| A | 0 | 140 | 0 |
| B | 0 | 140 | 0 |
| C | 0 | 140 | 0 |
| D | 0 | 140 | 0 |
| Mode M9 | |||
|---|---|---|---|
| Quadrant | BADHDUFLAG | Total packets | Discarded packets |
| A | 0 | 5 | 0 |
| B | 0 | 5 | 0 |
| C | 0 | 5 | 0 |
| D | 0 | 5 | 0 |
| Mode M0 | |||
|---|---|---|---|
| Quadrant | BADHDUFLAG | Total packets | Discarded packets |
| A | 0 | 14960 | 2 |
| B | 0 | 14779 | 1 |
| C | 0 | 14103 | 1 |
| D | 0 | 31567 | 1 |
| Quadrant | Total seconds | Saturated seconds | Saturation percentage |
|---|---|---|---|
| A | 6914 | 140 | 2.024877% |
| B | 6914 | 109 | 1.576511% |
| C | 6914 | 43 | 0.621927% |
| D | 6914 | 965 | 13.957188% |
Noise dominated data is calculated using 1-second bins in cleaned event files. If a bin has >2000 counts, and if more than 50% of those come from <1% of pixels, then it is considered to be noise-dominated and hence unusable.
| Quadrant | # 1 sec bins | Bins with >0 counts | Bins with >2000 counts | High rate bins dominated by noise | Noise dominated (total time) | Noise dominated (detector-on time) | Marked lightcurve |
|---|---|---|---|---|---|---|---|
| A | 7439 | 6915 | 44 | 44 | 0.59% | 0.64% | 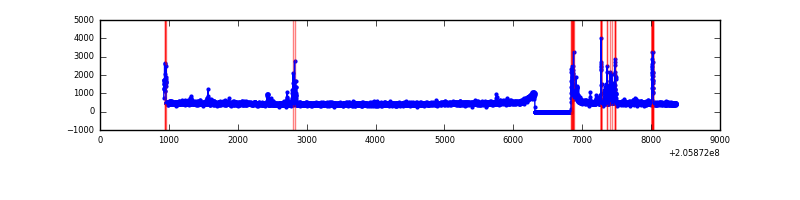 |
| B | 7439 | 6915 | 13 | 13 | 0.17% | 0.19% | 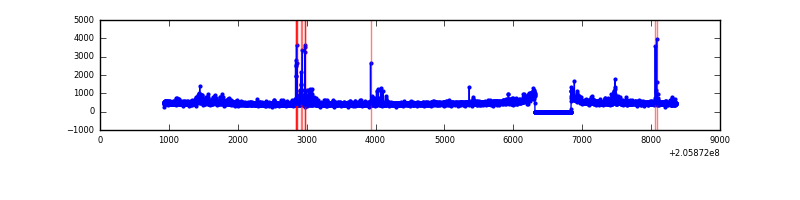 |
| C | 7439 | 6915 | 0 | 0 | 0.00% | 0.00% | 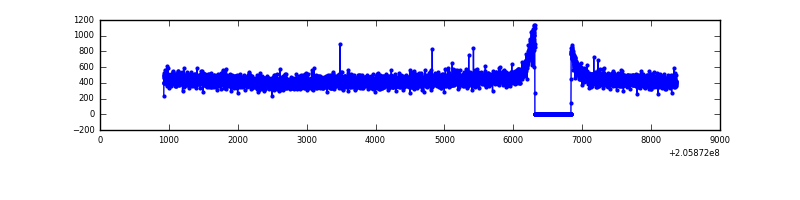 |
| D | 7439 | 6915 | 783 | 783 | 10.53% | 11.32% | 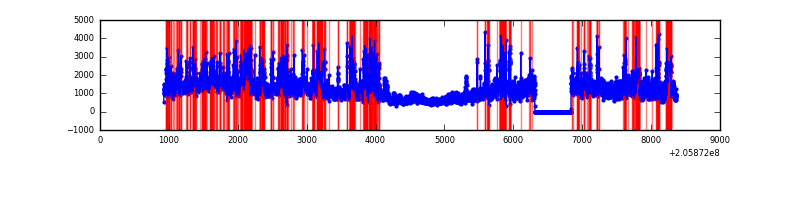 |
Top three noisy pixels from each quadrant. If the there are fewer than three noisy pixels in the level2.evt file, extra rows are filled as -1
| Pixel properties | Quadrant properties | ||||||
|---|---|---|---|---|---|---|---|
| Quadrant | DetID | PixID | Counts | Sigma | Mean | Median | Sigma |
| A | 15 | 169 | 96253 | 577.67 | 803 | 784 | 165.3 |
| A | 0 | 50 | 90995 | 545.86 | 803 | 784 | 165.3 |
| A | 0 | 199 | 68588 | 410.28 | 803 | 784 | 165.3 |
| B | 4 | 81 | 65932 | 414.46 | 812 | 793 | 157.2 |
| B | 7 | 252 | 63067 | 396.23 | 812 | 793 | 157.2 |
| B | 15 | 204 | 47943 | 300.0 | 812 | 793 | 157.2 |
| C | 13 | 61 | 6280 | 30.05 | 777 | 778 | 183.1 |
| C | 10 | 65 | 5350 | 24.97 | 777 | 778 | 183.1 |
| C | 9 | 144 | 4380 | 19.67 | 777 | 778 | 183.1 |
| D | 2 | 63 | 4705189 | 26263.12 | 737 | 716 | 179.1 |
| D | 11 | 132 | 952331 | 5312.47 | 737 | 716 | 179.1 |
| D | 1 | 52 | 123341 | 684.56 | 737 | 716 | 179.1 |
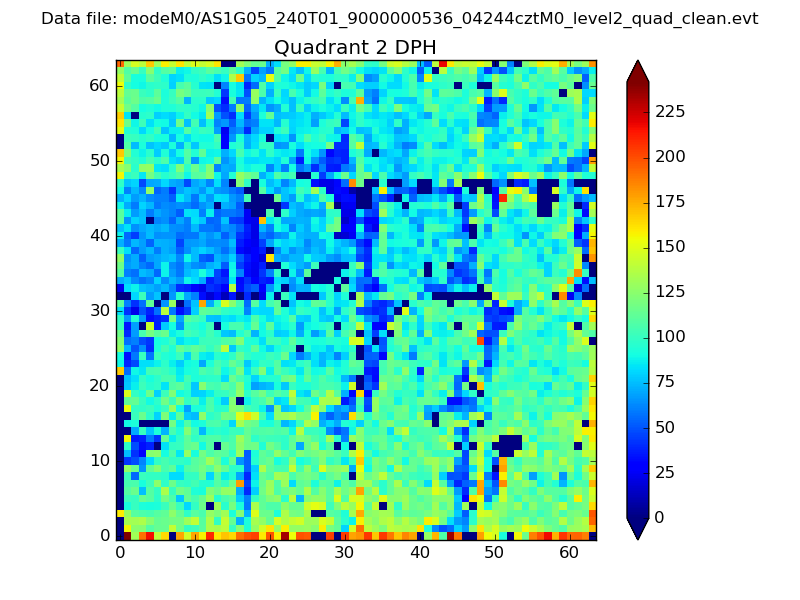
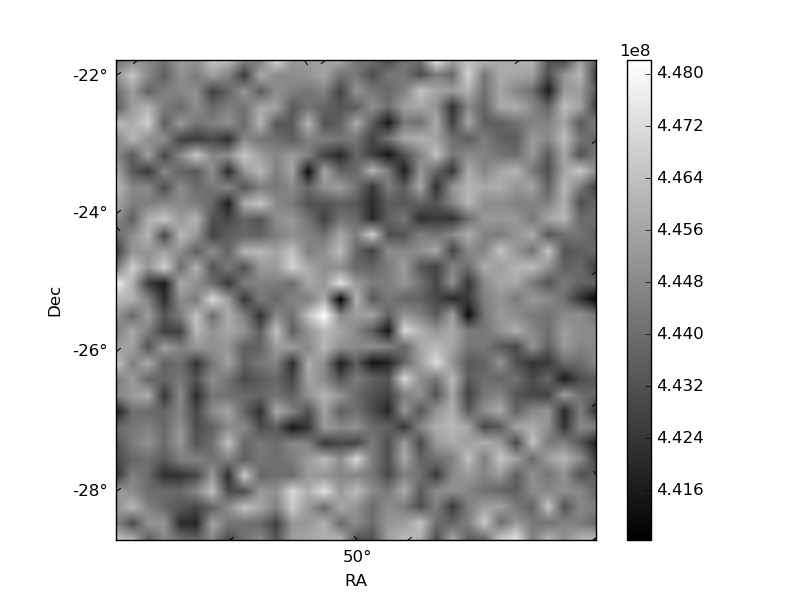
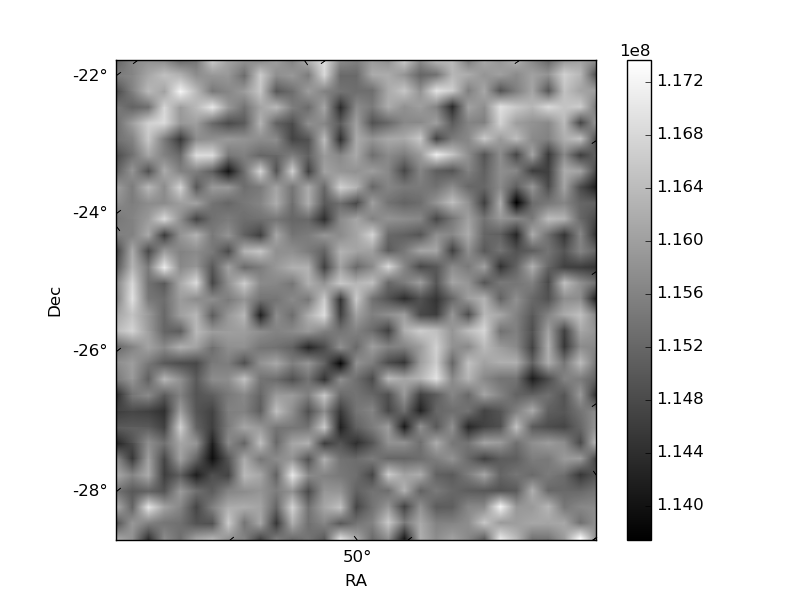
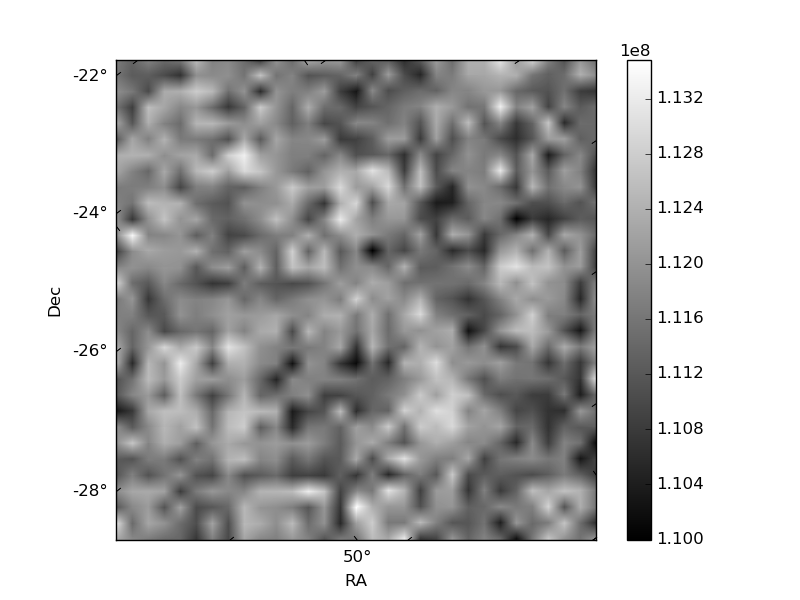
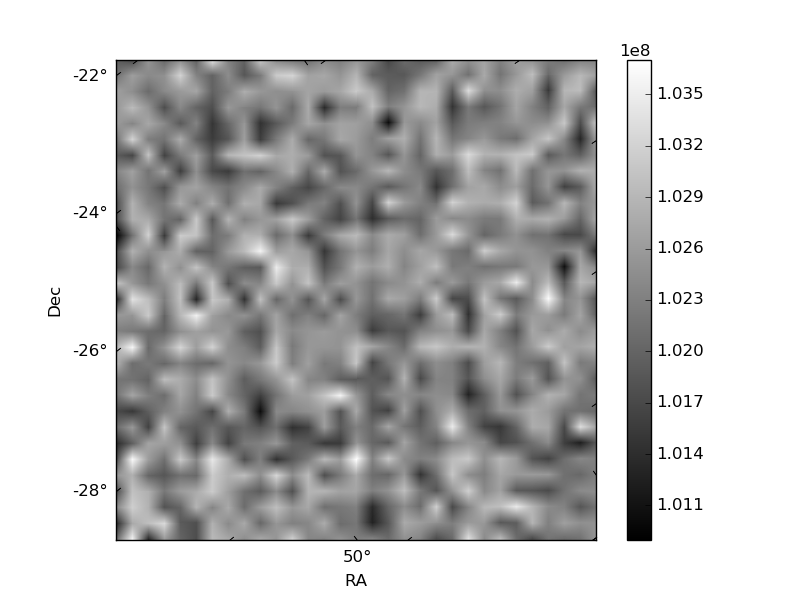
Histogram calculated using DETX and DETY for each event in the final _common_clean file
| Quadrant A | 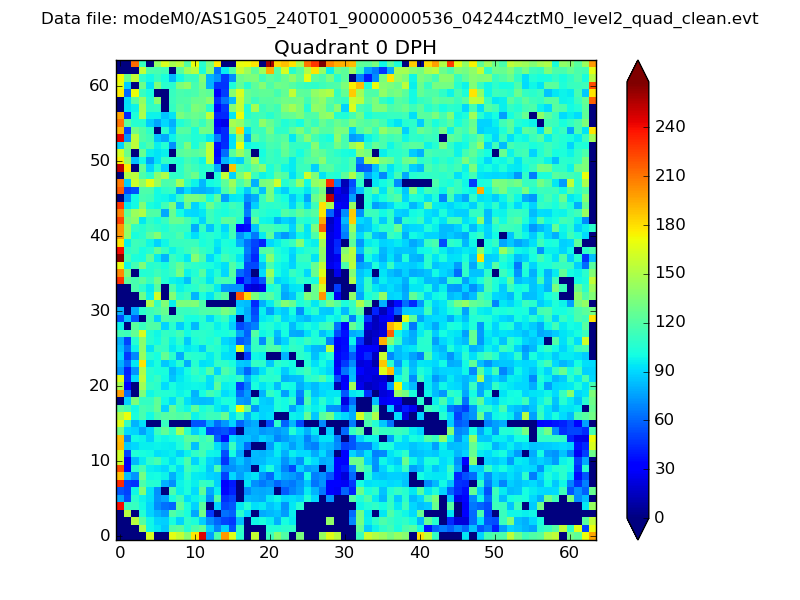 |
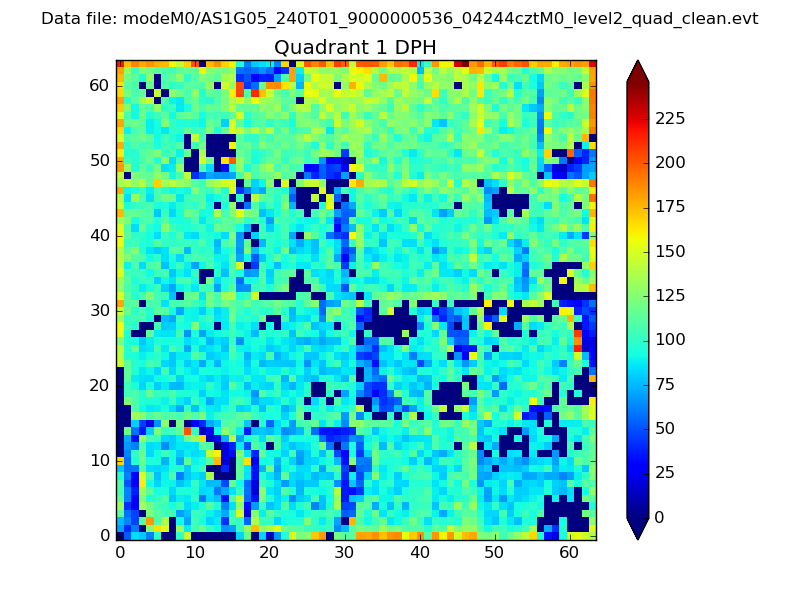 |
Quadrant B |
|---|---|---|---|
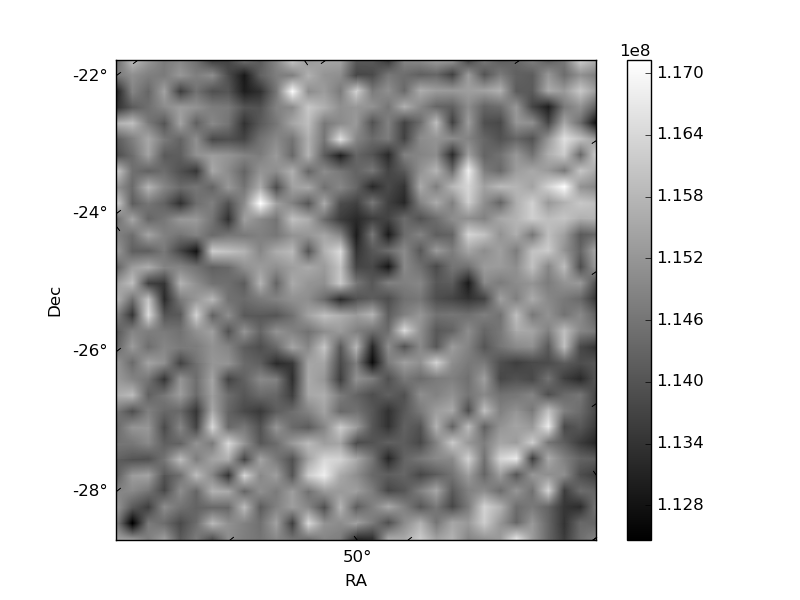
| Quadrant D | 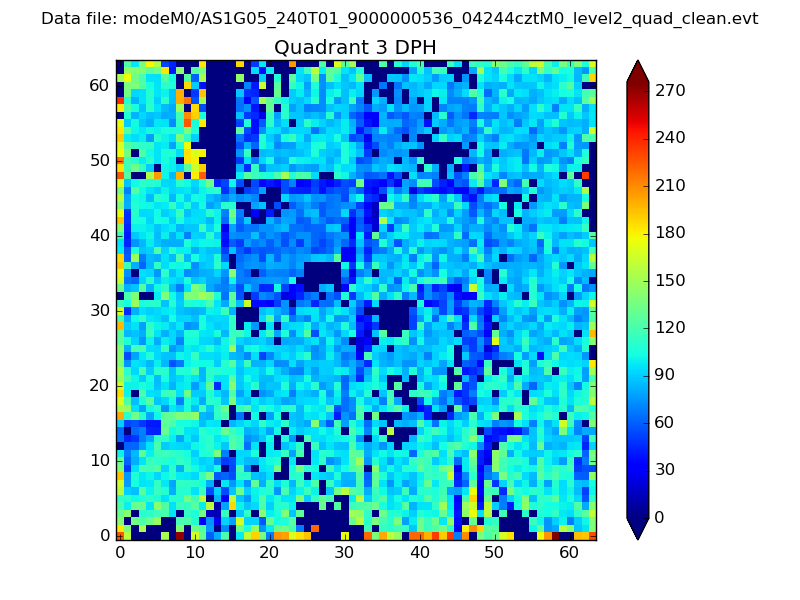 |
 |
Quadrant C |
| Plot type | Count rate plots | Images |
|---|---|---|
| Comparison with Poisson distribution Blue bars denote a histogram of data divided into 1 sec bins. Red curve is a Poisson curve with rate = median count rate of data. |
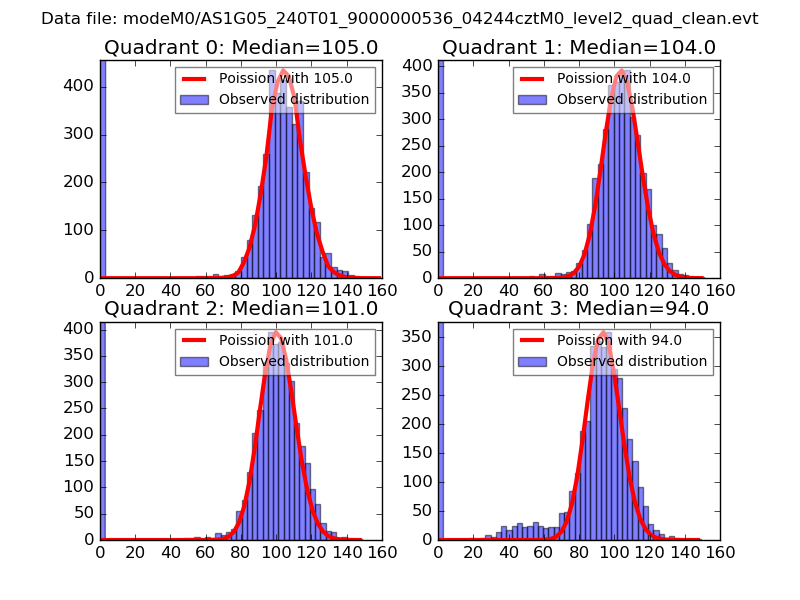 |
 |
| Quadrant-wise count rates Data is divided into 100 sec bins |
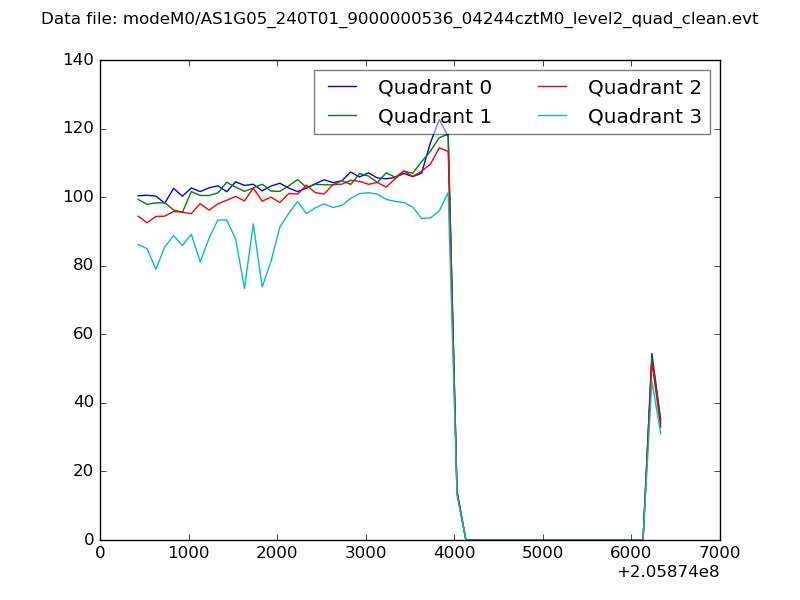 |
|
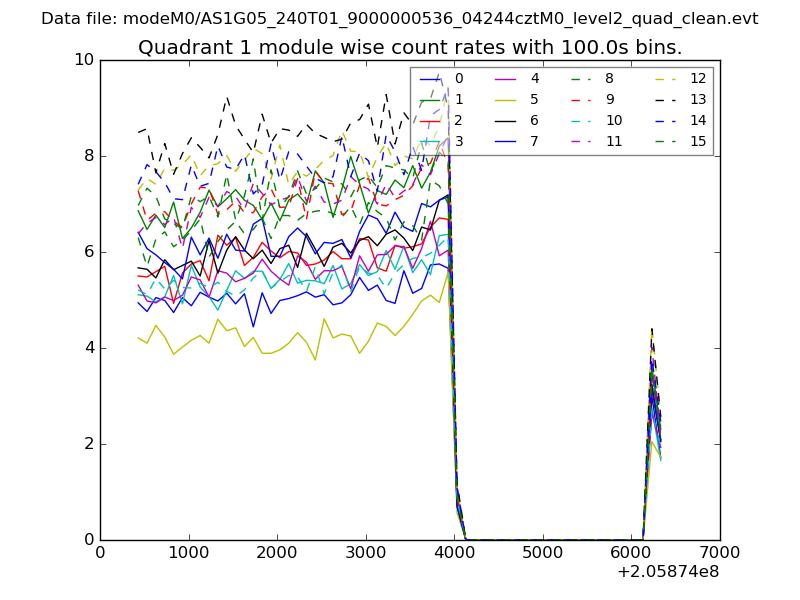
| Module-wise count rates for Quadrant A Data is divided into 100 sec bins |
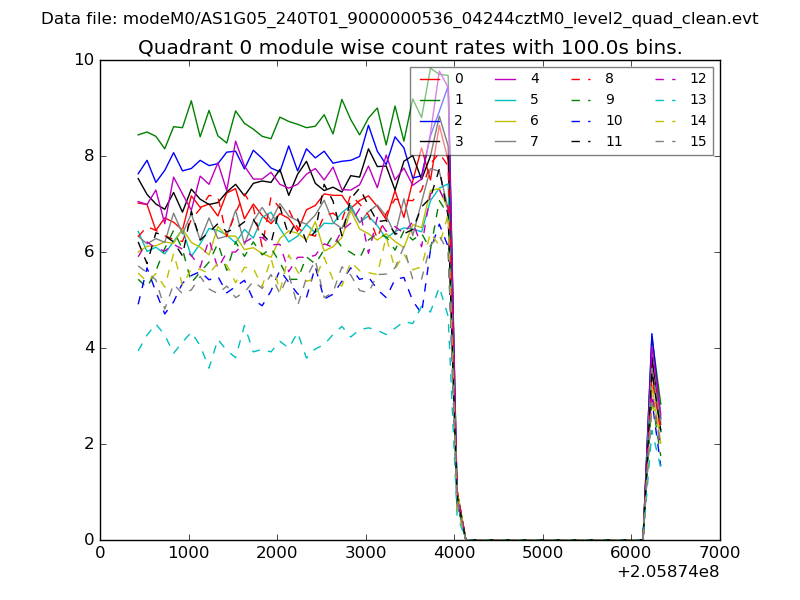 |
 |
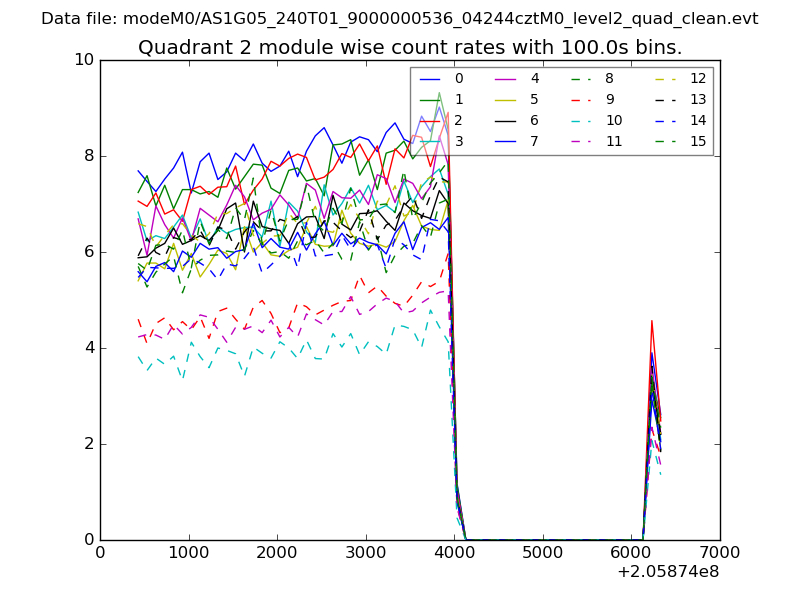
| Module-wise count rates for Quadrant B Data is divided into 100 sec bins |
 |
 |
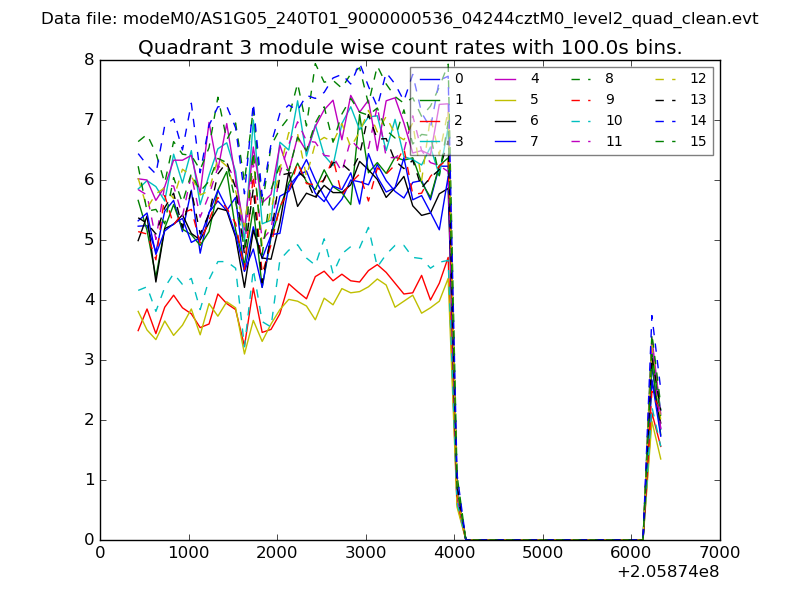
| Module-wise count rates for Quadrant C Data is divided into 100 sec bins |
 |
 |
| Module-wise count rates for Quadrant D Data is divided into 100 sec bins |
 |
 |
| Parameter | Plot |
|---|---|
| CZT HV Monitor | 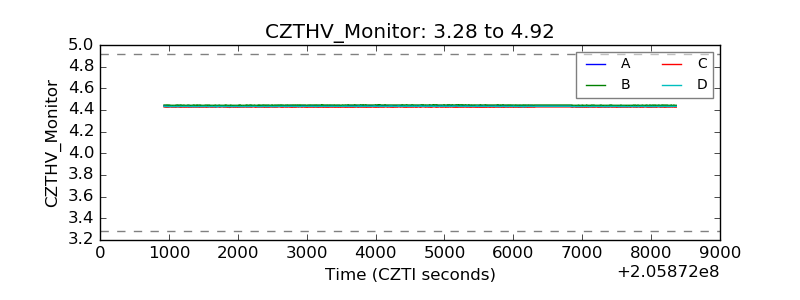 |
| D_VDD | 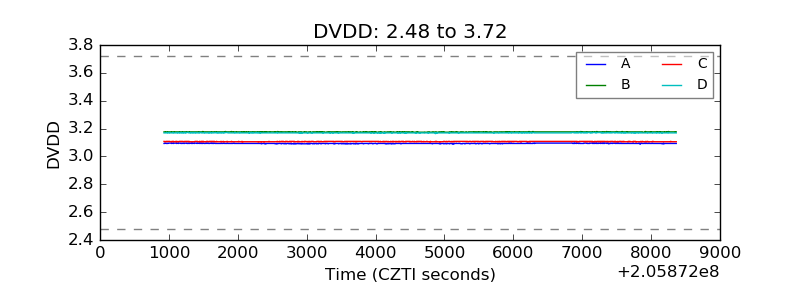 |
| Temperature 1 | 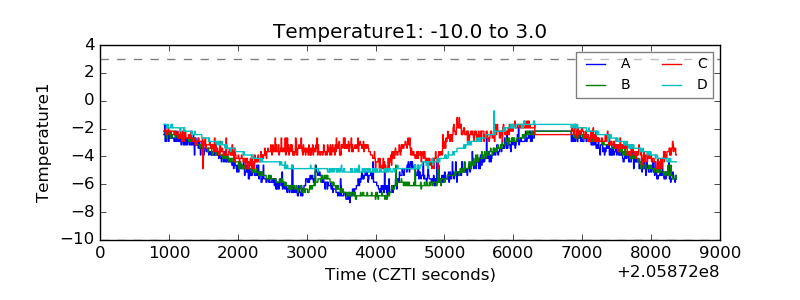 |
| Veto HV Monitor | 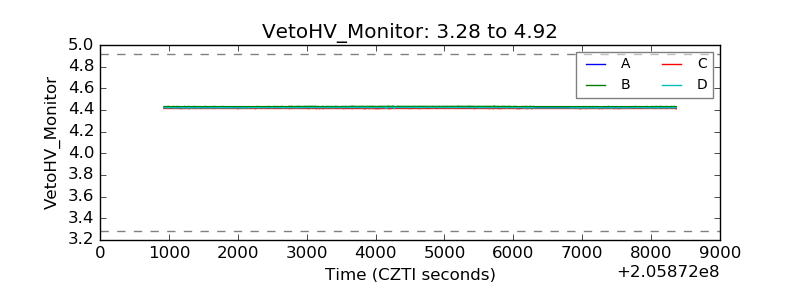 |
| Veto LLD | 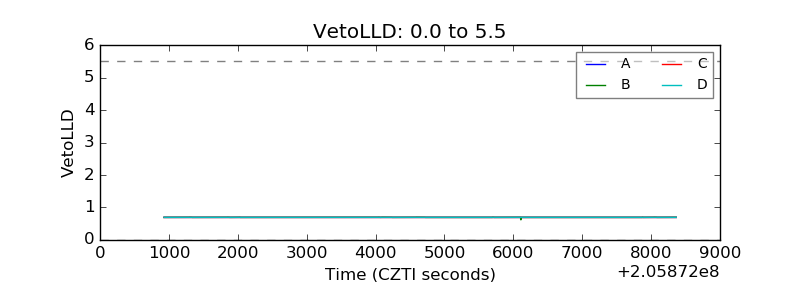 |
| Alpha Counter | 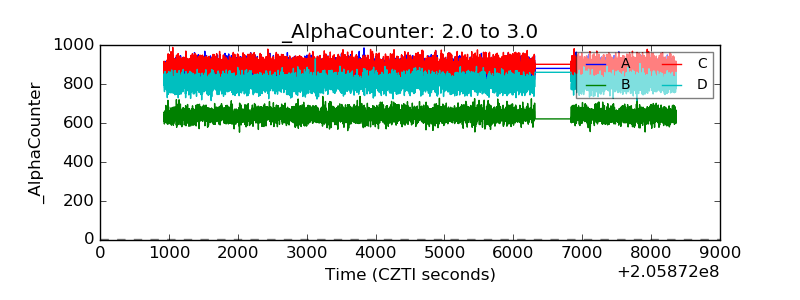 |
| _CPM_Rate | 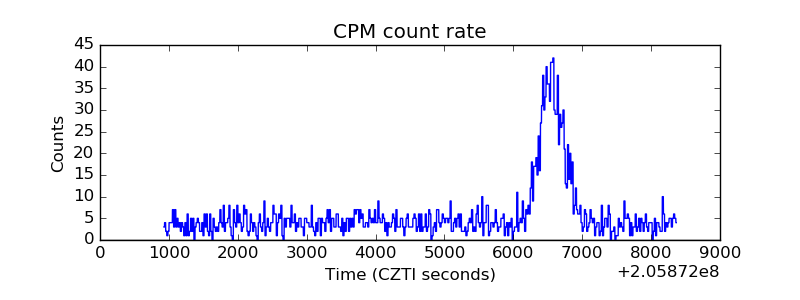 |
| CZT Counter | 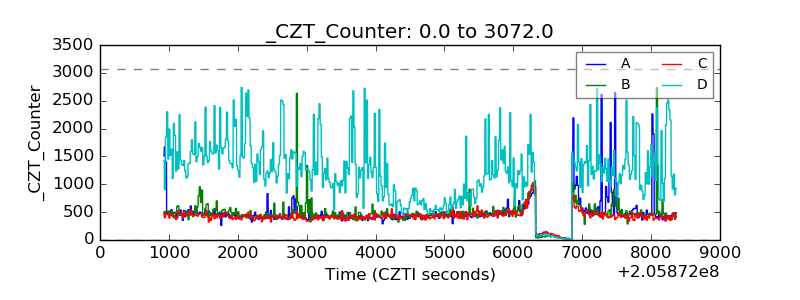 |
| +2.5 Volts monitor |  |
| +5 Volts monitor |  |
| _ROLL_ROT | 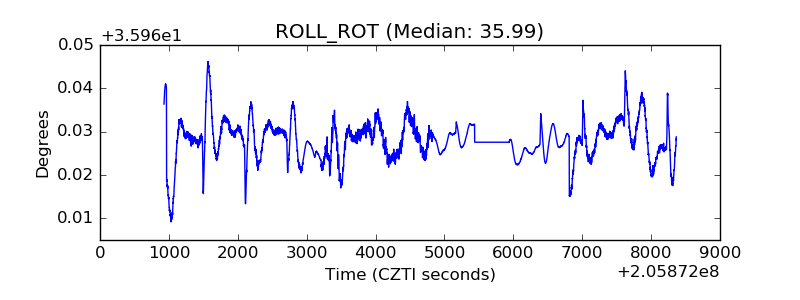 |
| _Roll_DEC | 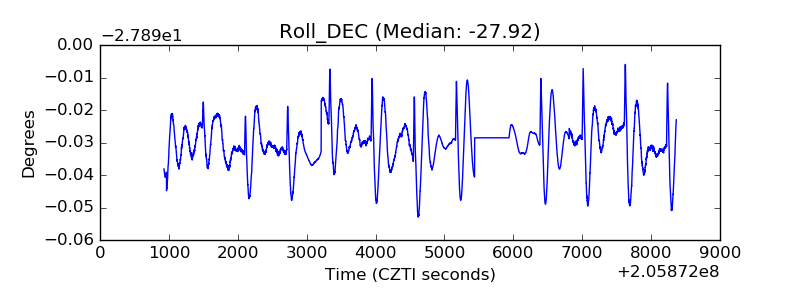 |
| _Roll_RA | 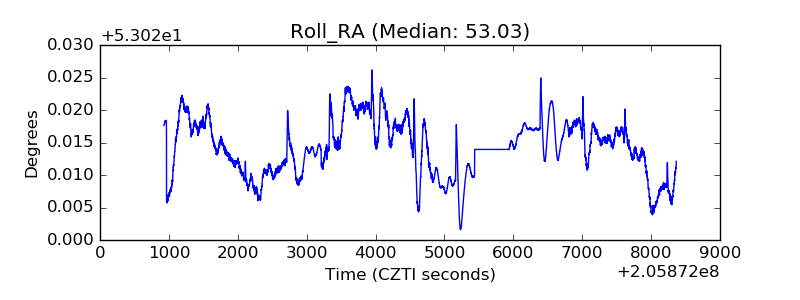 |
| Veto Counter | 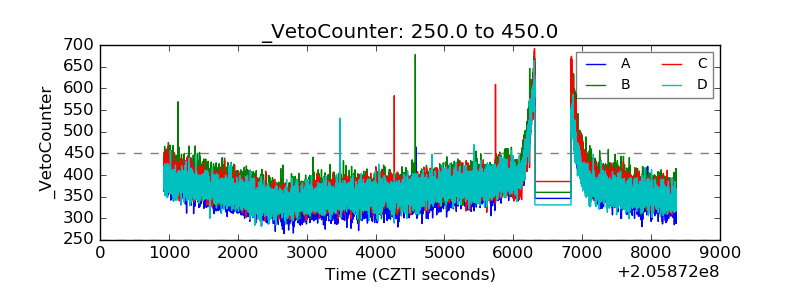 |