| Param | Original file | Final file |
|---|---|---|
| Filename | modeM0/AS1G05_240T01_9000000536_04245cztM0_level2.evt | modeM0/AS1G05_240T01_9000000536_04245cztM0_level2_quad_clean.evt |
| Size (bytes) | 641,856,960 | 71,864,640 |
| Size | 612.1 MB | 68.5 MB |
| Events in quadrant A | 4,573,329 | 415,435 |
| Events in quadrant B | 3,918,278 | 415,892 |
| Events in quadrant C | 3,554,113 | 406,327 |
| Events in quadrant D | 6,857,597 | 388,662 |
| Mode SS | |||
|---|---|---|---|
| Quadrant | BADHDUFLAG | Total packets | Discarded packets |
| A | 0 | 162 | 0 |
| B | 0 | 162 | 0 |
| C | 0 | 162 | 0 |
| D | 0 | 162 | 0 |
| Mode M9 | |||
|---|---|---|---|
| Quadrant | BADHDUFLAG | Total packets | Discarded packets |
| A | 0 | 7 | 0 |
| B | 0 | 7 | 0 |
| C | 0 | 7 | 0 |
| D | 0 | 7 | 0 |
| Mode M0 | |||
|---|---|---|---|
| Quadrant | BADHDUFLAG | Total packets | Discarded packets |
| A | 0 | 19081 | 3 |
| B | 0 | 16948 | 2 |
| C | 0 | 16331 | 2 |
| D | 0 | 25956 | 2 |
| Quadrant | Total seconds | Saturated seconds | Saturation percentage |
|---|---|---|---|
| A | 7904 | 314 | 3.972672% |
| B | 7904 | 179 | 2.264676% |
| C | 7904 | 103 | 1.303138% |
| D | 7904 | 489 | 6.186741% |
Noise dominated data is calculated using 1-second bins in cleaned event files. If a bin has >2000 counts, and if more than 50% of those come from <1% of pixels, then it is considered to be noise-dominated and hence unusable.
| Quadrant | # 1 sec bins | Bins with >0 counts | Bins with >2000 counts | High rate bins dominated by noise | Noise dominated (total time) | Noise dominated (detector-on time) | Marked lightcurve |
|---|---|---|---|---|---|---|---|
| A | 8599 | 7907 | 44 | 44 | 0.51% | 0.56% | 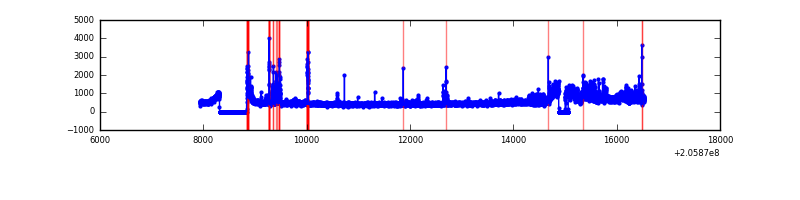 |
| B | 8599 | 7907 | 4 | 4 | 0.05% | 0.05% |  |
| C | 8599 | 7907 | 0 | 0 | 0.00% | 0.00% |  |
| D | 8599 | 7907 | 296 | 296 | 3.44% | 3.74% | 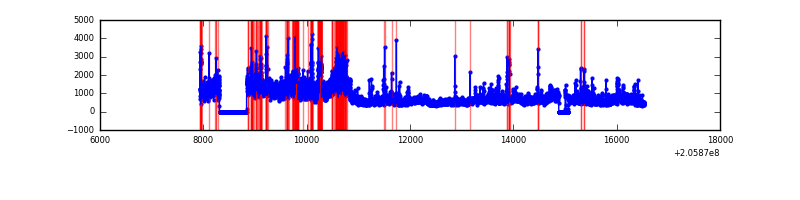 |
Top three noisy pixels from each quadrant. If the there are fewer than three noisy pixels in the level2.evt file, extra rows are filled as -1
| Pixel properties | Quadrant properties | ||||||
|---|---|---|---|---|---|---|---|
| Quadrant | DetID | PixID | Counts | Sigma | Mean | Median | Sigma |
| A | 8 | 15 | 637815 | 3327.52 | 932 | 909 | 191.4 |
| A | 15 | 169 | 96412 | 498.96 | 932 | 909 | 191.4 |
| A | 0 | 199 | 83011 | 428.94 | 932 | 909 | 191.4 |
| B | 4 | 81 | 61652 | 326.48 | 950 | 928 | 186.0 |
| B | 15 | 204 | 43524 | 229.02 | 950 | 928 | 186.0 |
| B | 14 | 167 | 39729 | 208.61 | 950 | 928 | 186.0 |
| C | 13 | 61 | 7485 | 30.76 | 909 | 913 | 213.6 |
| C | 10 | 65 | 3216 | 10.78 | 909 | 913 | 213.6 |
| C | 7 | 247 | 2821 | 8.93 | 909 | 913 | 213.6 |
| D | 2 | 63 | 1327938 | 6095.53 | 892 | 865 | 217.7 |
| D | 11 | 132 | 1163921 | 5342.17 | 892 | 865 | 217.7 |
| D | 2 | 232 | 412900 | 1892.57 | 892 | 865 | 217.7 |
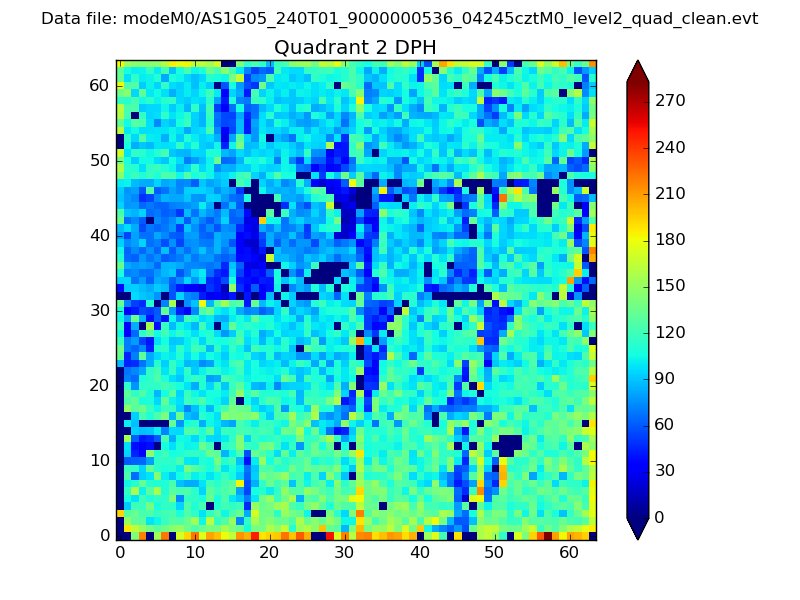
Histogram calculated using DETX and DETY for each event in the final _common_clean file
| Quadrant A | 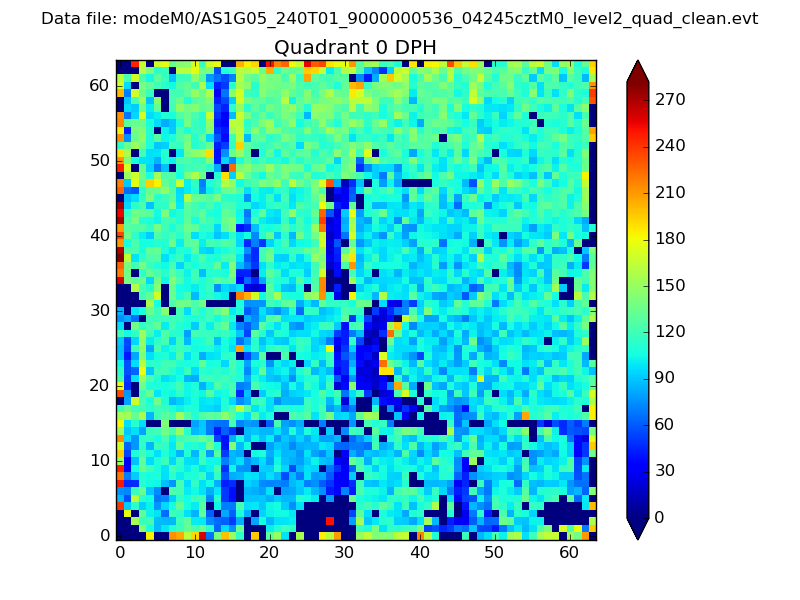 |
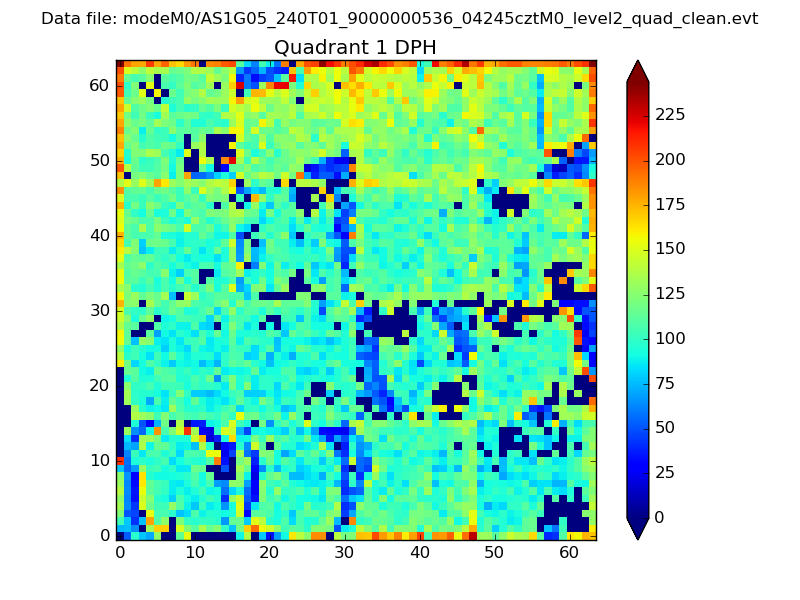 |
Quadrant B |
|---|---|---|---|
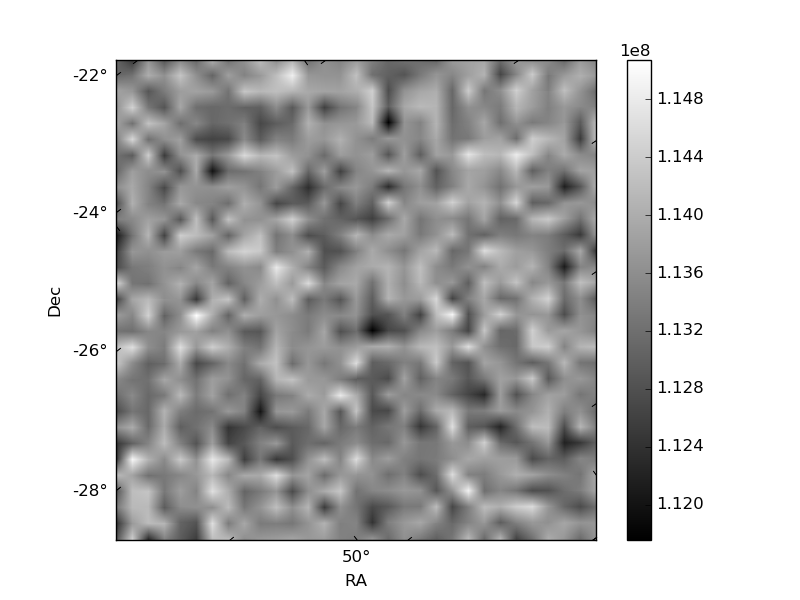
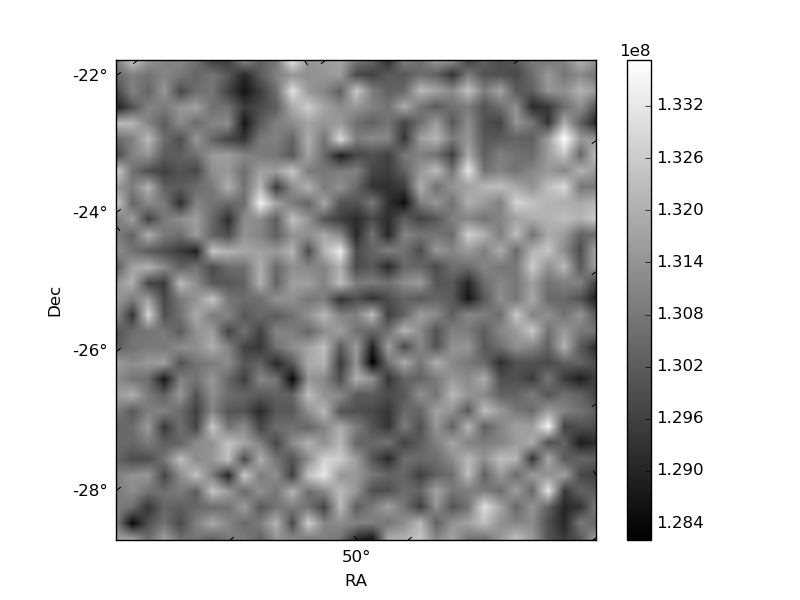
| Quadrant D | 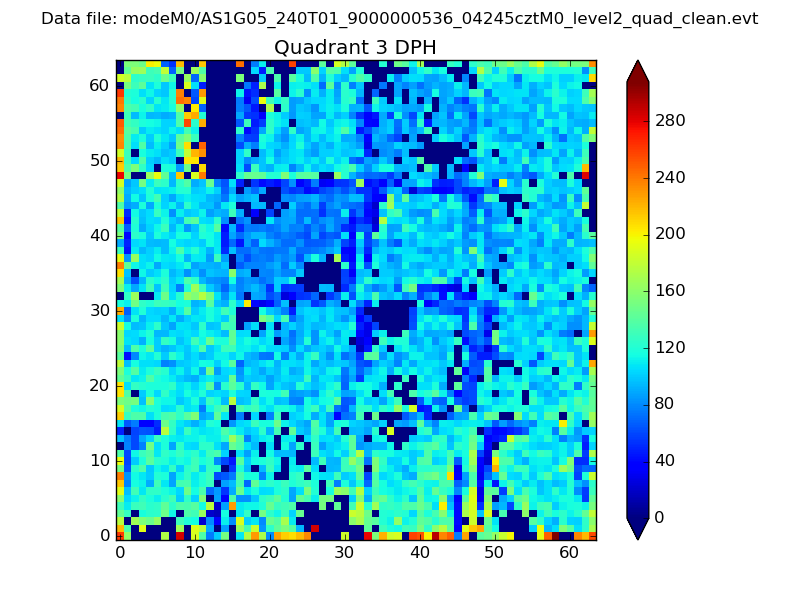 |
 |
Quadrant C |
| Plot type | Count rate plots | Images |
|---|---|---|
| Comparison with Poisson distribution Blue bars denote a histogram of data divided into 1 sec bins. Red curve is a Poisson curve with rate = median count rate of data. |
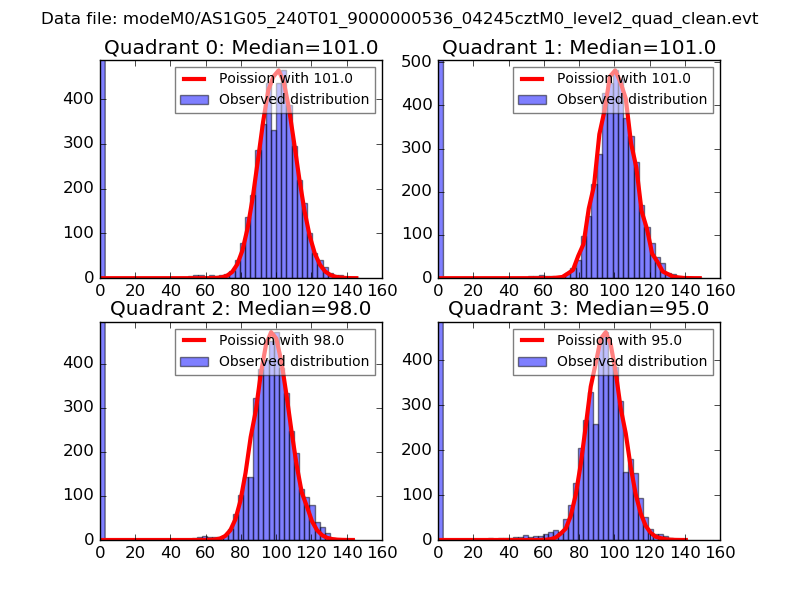 |
 |
| Quadrant-wise count rates Data is divided into 100 sec bins |
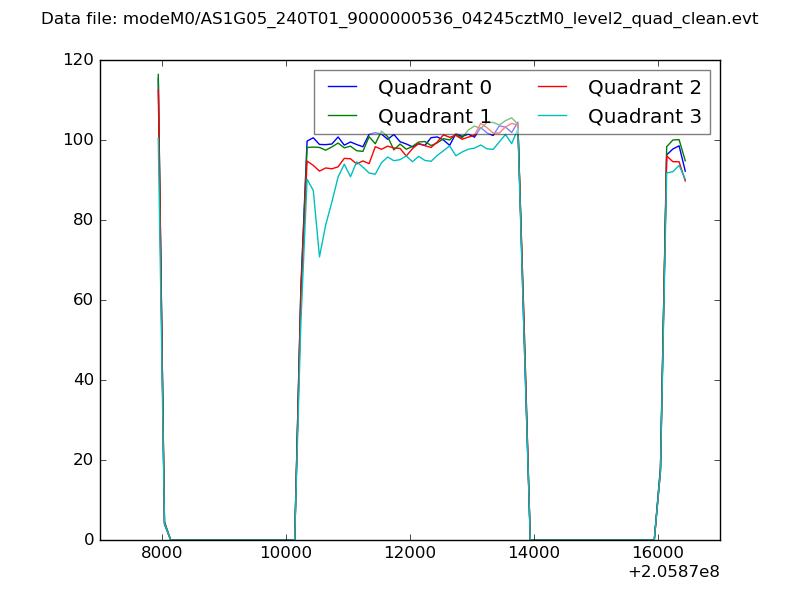 |
|
| Module-wise count rates for Quadrant A Data is divided into 100 sec bins |
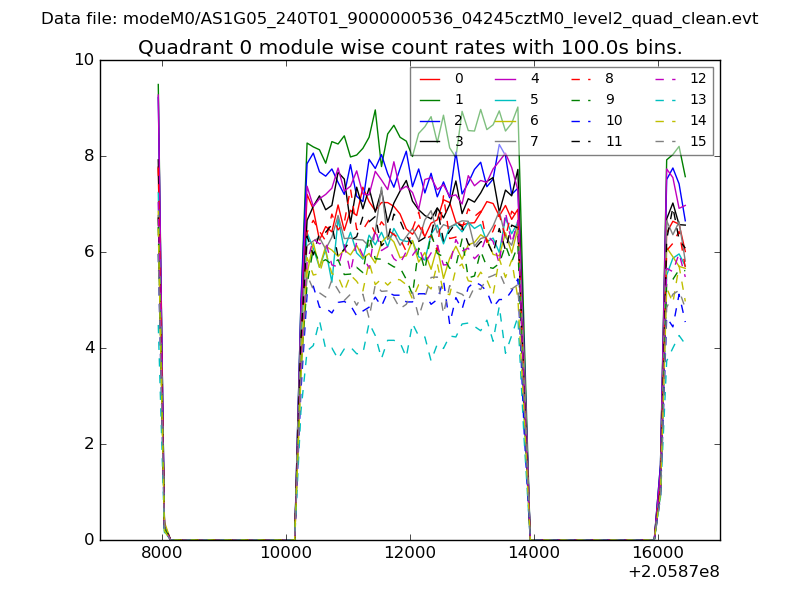 |
 |
| Module-wise count rates for Quadrant B Data is divided into 100 sec bins |
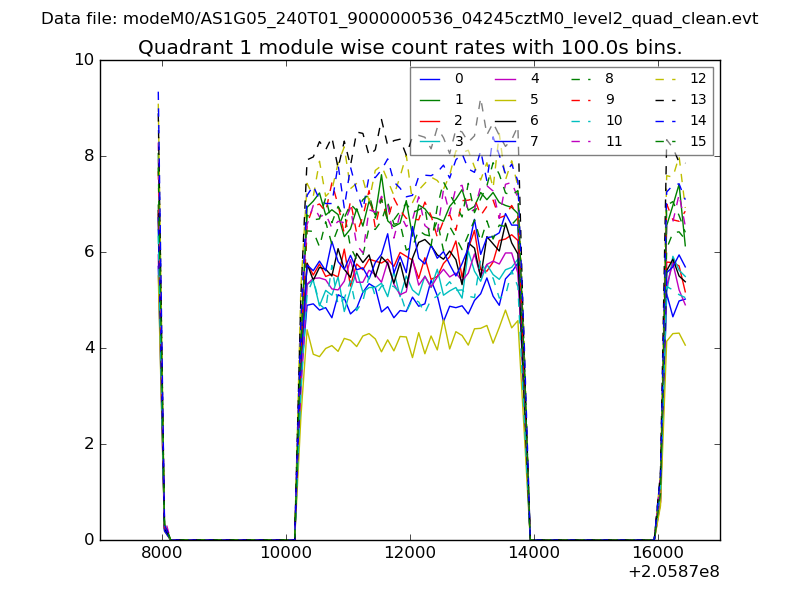 |
 |
| Module-wise count rates for Quadrant C Data is divided into 100 sec bins |
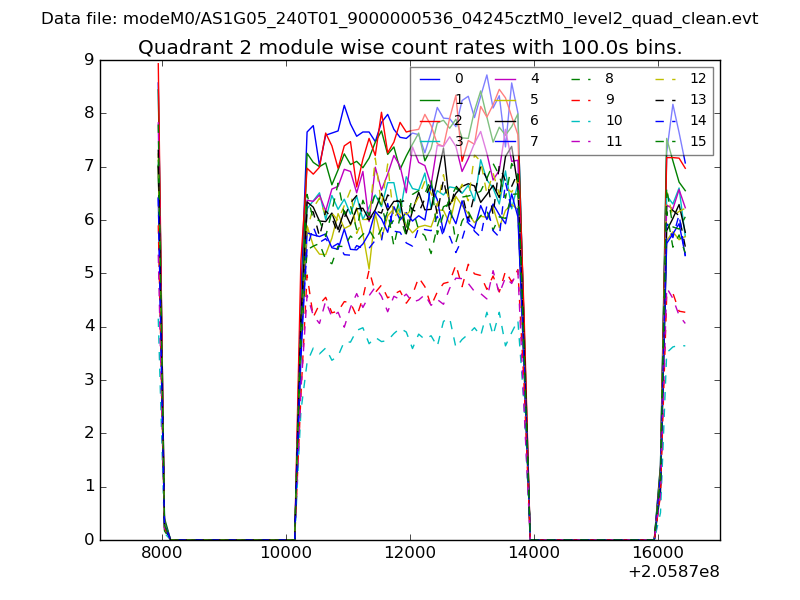 |
 |
| Module-wise count rates for Quadrant D Data is divided into 100 sec bins |
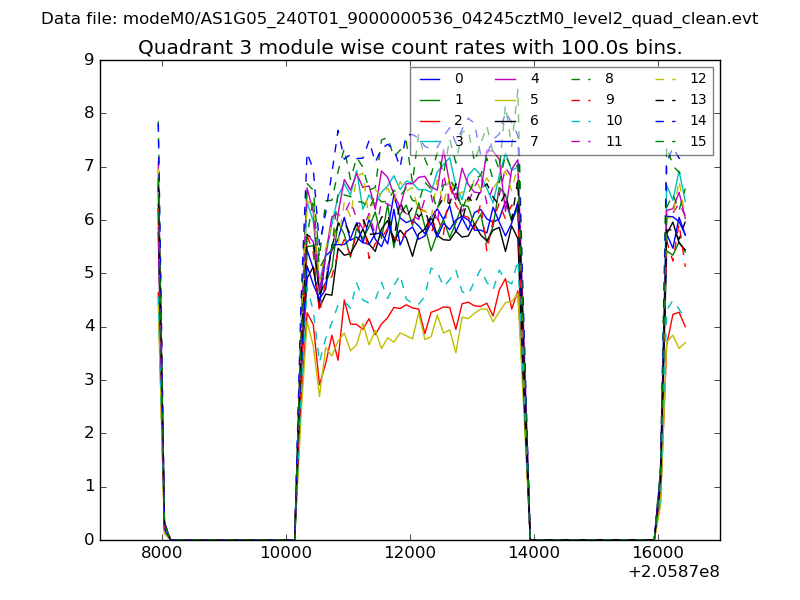 |
 |
| Parameter | Plot |
|---|---|
| CZT HV Monitor | 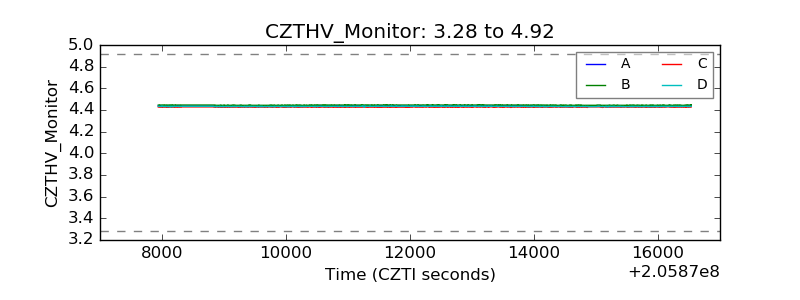 |
| D_VDD | 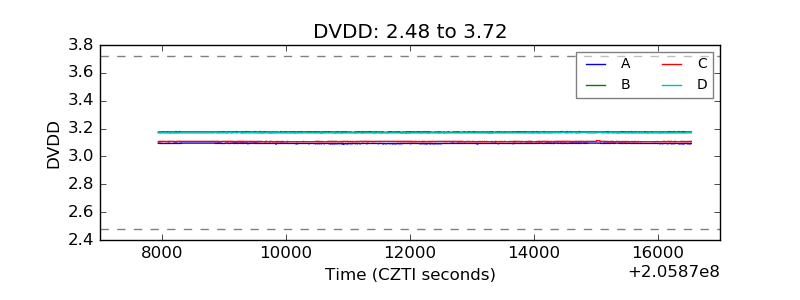 |
| Temperature 1 | 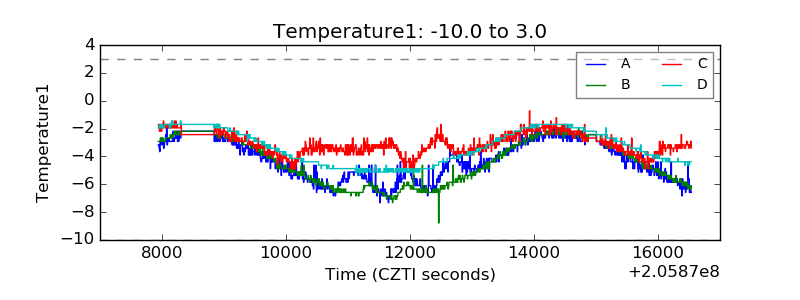 |
| Veto HV Monitor | 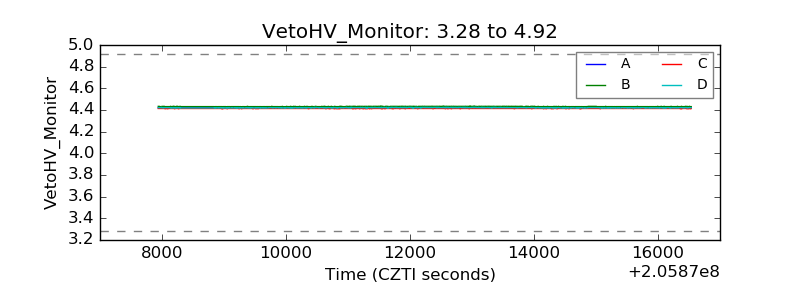 |
| Veto LLD | 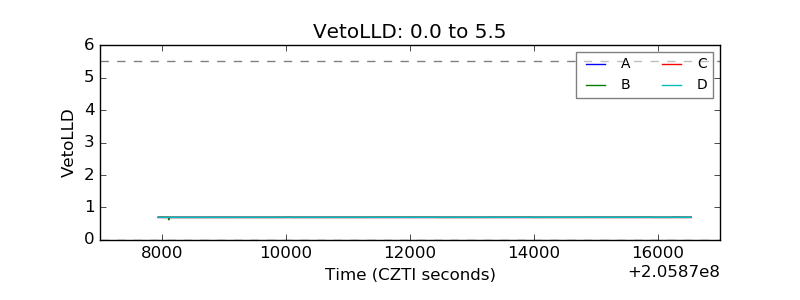 |
| Alpha Counter | 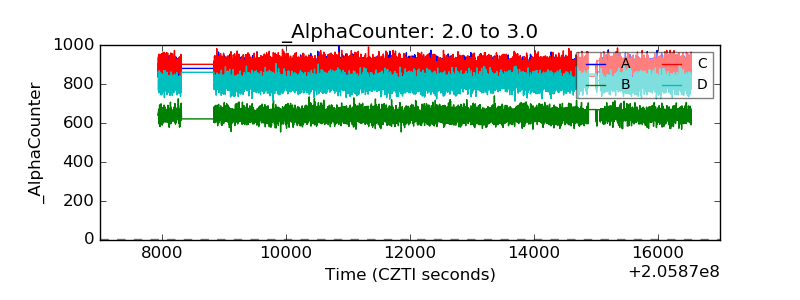 |
| _CPM_Rate | 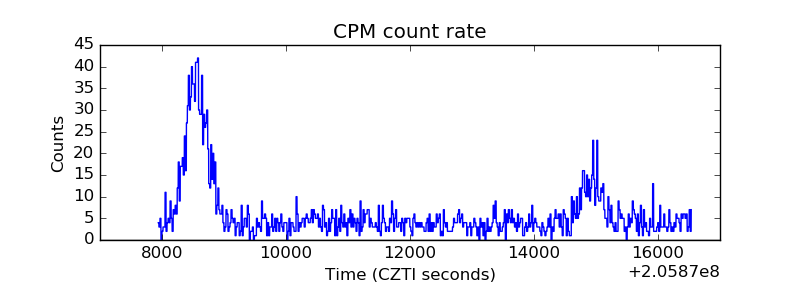 |
| CZT Counter | 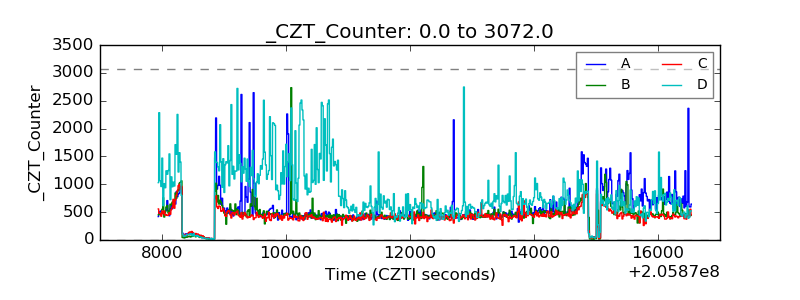 |
| +2.5 Volts monitor |  |
| +5 Volts monitor |  |
| _ROLL_ROT | 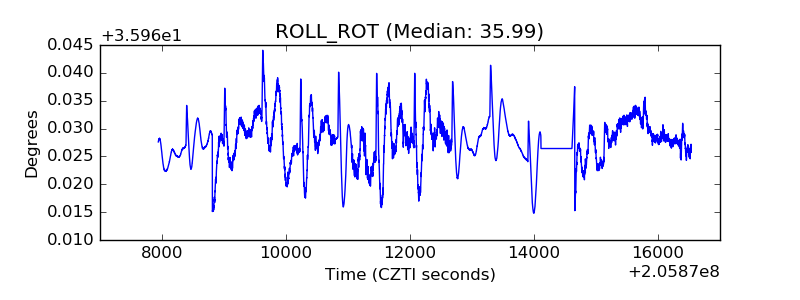 |
| _Roll_DEC | 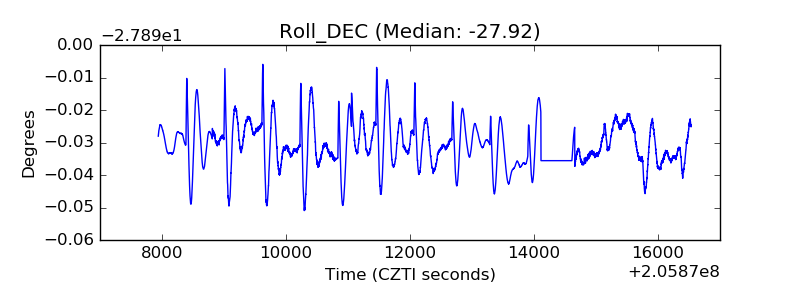 |
| _Roll_RA | 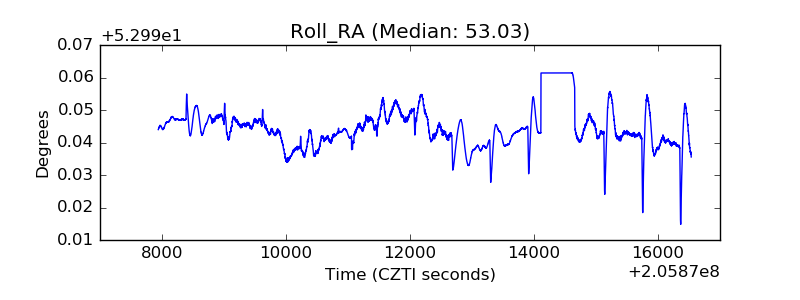 |
| Veto Counter | 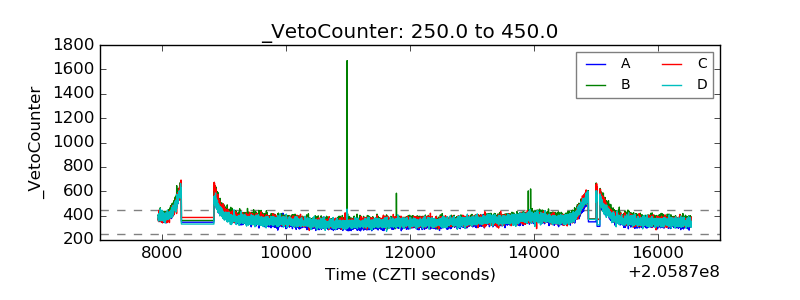 |