| Param | Original file | Final file |
|---|---|---|
| Filename | modeM0/AS1G05_240T01_9000000536_04246cztM0_level2.evt | modeM0/AS1G05_240T01_9000000536_04246cztM0_level2_quad_clean.evt |
| Size (bytes) | 582,281,280 | 78,456,960 |
| Size | 555.3 MB | 74.8 MB |
| Events in quadrant A | 4,863,660 | 461,334 |
| Events in quadrant B | 3,963,495 | 463,596 |
| Events in quadrant C | 3,607,804 | 452,927 |
| Events in quadrant D | 4,653,071 | 437,907 |
| Mode SS | |||
|---|---|---|---|
| Quadrant | BADHDUFLAG | Total packets | Discarded packets |
| A | 0 | 164 | 0 |
| B | 0 | 164 | 0 |
| C | 0 | 164 | 0 |
| D | 0 | 164 | 0 |
| Mode M9 | |||
|---|---|---|---|
| Quadrant | BADHDUFLAG | Total packets | Discarded packets |
| A | 0 | 4 | 0 |
| B | 0 | 4 | 0 |
| C | 0 | 4 | 0 |
| D | 0 | 4 | 0 |
| Mode M0 | |||
|---|---|---|---|
| Quadrant | BADHDUFLAG | Total packets | Discarded packets |
| A | 0 | 19922 | 3 |
| B | 0 | 17239 | 2 |
| C | 0 | 16629 | 2 |
| D | 0 | 19570 | 4 |
| Quadrant | Total seconds | Saturated seconds | Saturation percentage |
|---|---|---|---|
| A | 8059 | 225 | 2.791910% |
| B | 8059 | 170 | 2.109443% |
| C | 8059 | 101 | 1.253257% |
| D | 8058 | 223 | 2.767436% |
Noise dominated data is calculated using 1-second bins in cleaned event files. If a bin has >2000 counts, and if more than 50% of those come from <1% of pixels, then it is considered to be noise-dominated and hence unusable.
| Quadrant | # 1 sec bins | Bins with >0 counts | Bins with >2000 counts | High rate bins dominated by noise | Noise dominated (total time) | Noise dominated (detector-on time) | Marked lightcurve |
|---|---|---|---|---|---|---|---|
| A | 8429 | 8062 | 4 | 4 | 0.05% | 0.05% | 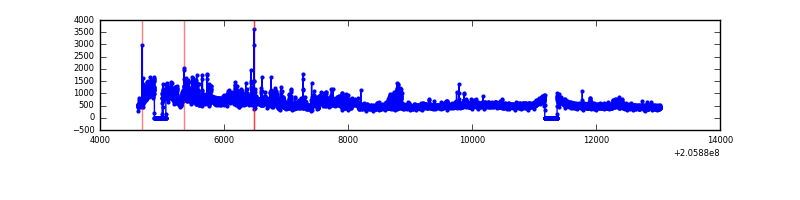 |
| B | 8429 | 8062 | 9 | 9 | 0.11% | 0.11% | 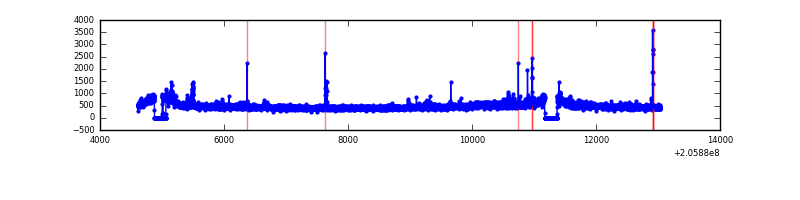 |
| C | 8429 | 8062 | 0 | 0 | 0.00% | 0.00% | 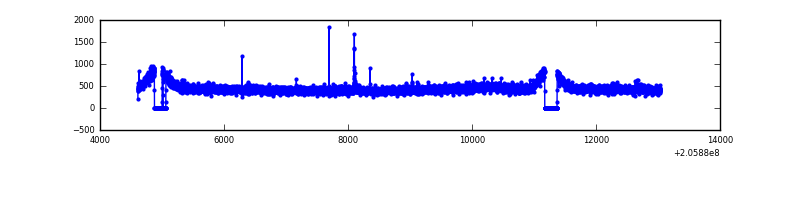 |
| D | 8429 | 8062 | 91 | 91 | 1.08% | 1.13% | 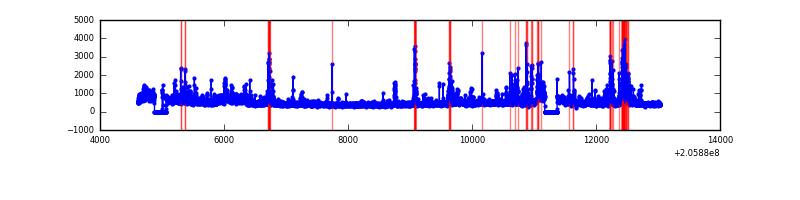 |
Top three noisy pixels from each quadrant. If the there are fewer than three noisy pixels in the level2.evt file, extra rows are filled as -1
| Pixel properties | Quadrant properties | ||||||
|---|---|---|---|---|---|---|---|
| Quadrant | DetID | PixID | Counts | Sigma | Mean | Median | Sigma |
| A | 8 | 15 | 921368 | 4738.79 | 941 | 916 | 194.2 |
| A | 0 | 50 | 95788 | 488.43 | 941 | 916 | 194.2 |
| A | 0 | 199 | 87780 | 447.2 | 941 | 916 | 194.2 |
| B | 15 | 204 | 55294 | 291.09 | 958 | 932 | 186.8 |
| B | 4 | 81 | 46651 | 244.81 | 958 | 932 | 186.8 |
| B | 14 | 167 | 43017 | 225.35 | 958 | 932 | 186.8 |
| C | 9 | 54 | 12081 | 51.73 | 919 | 923 | 215.7 |
| C | 13 | 61 | 7738 | 31.59 | 919 | 923 | 215.7 |
| C | 0 | 10 | 3601 | 12.41 | 919 | 923 | 215.7 |
| D | 13 | 235 | 302789 | 1346.85 | 912 | 881 | 224.2 |
| D | 11 | 132 | 254462 | 1131.26 | 912 | 881 | 224.2 |
| D | 10 | 172 | 164561 | 730.2 | 912 | 881 | 224.2 |
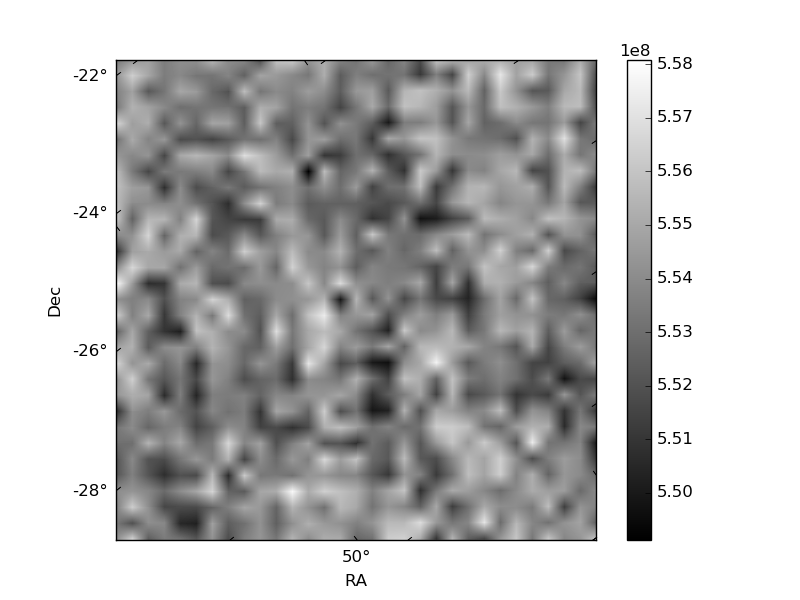
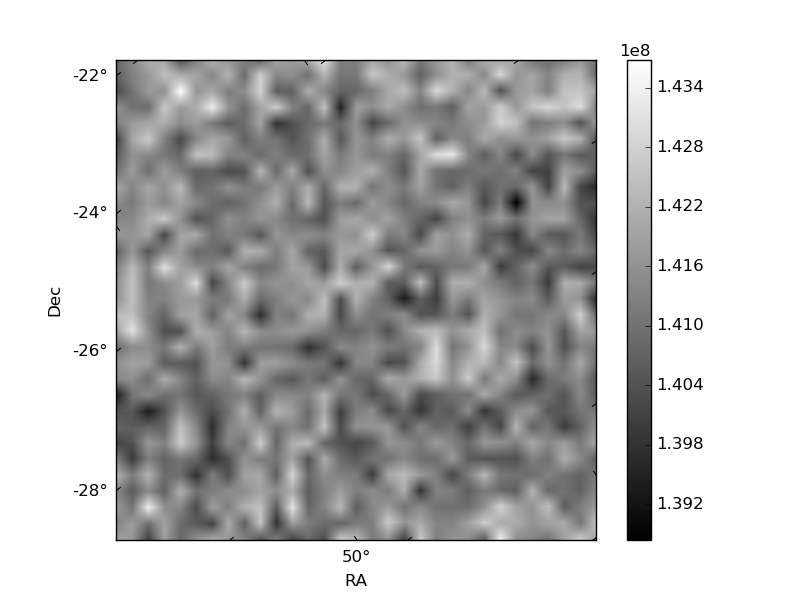
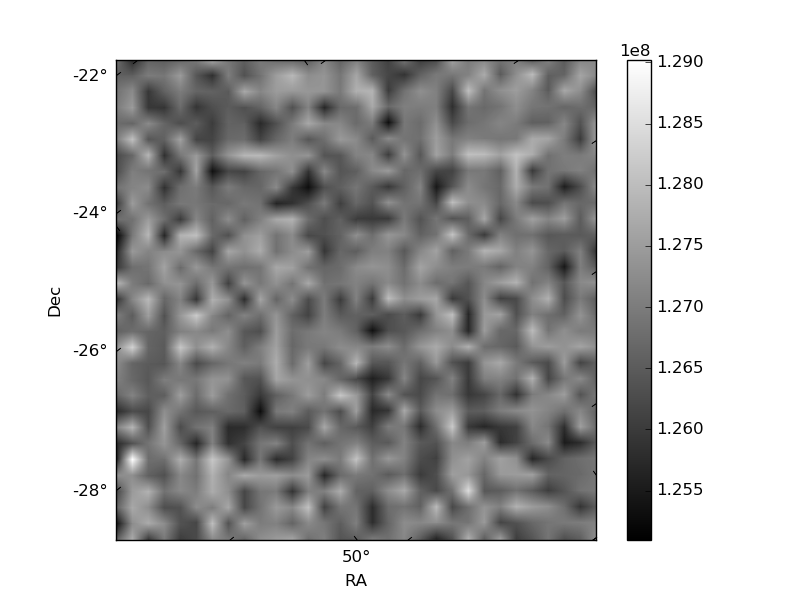
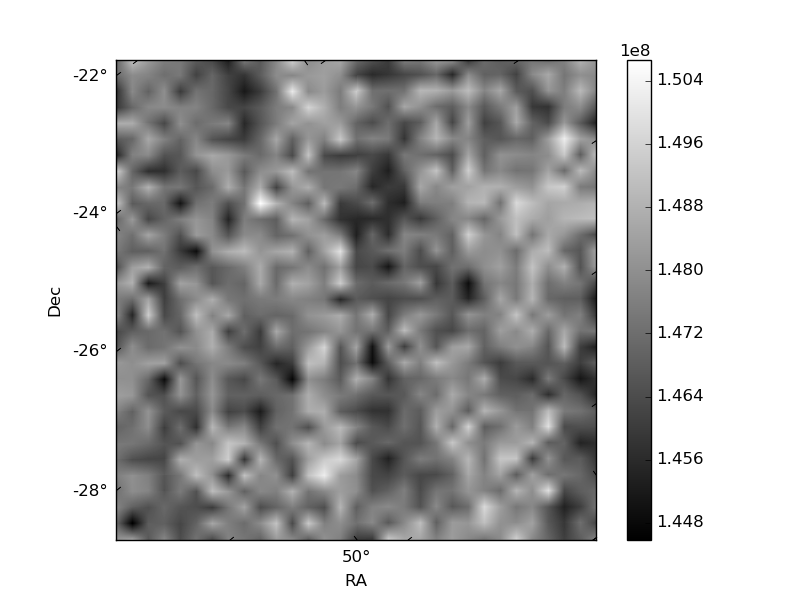
Histogram calculated using DETX and DETY for each event in the final _common_clean file
| Quadrant A | 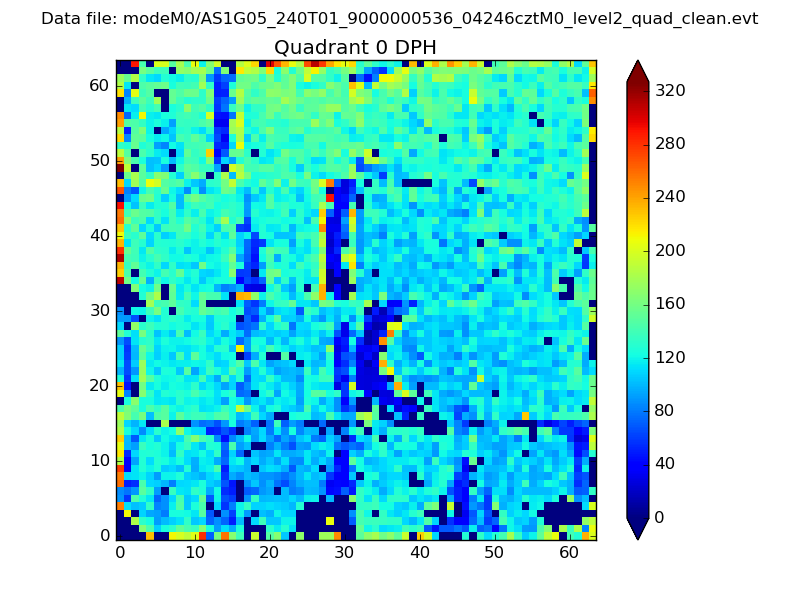 |
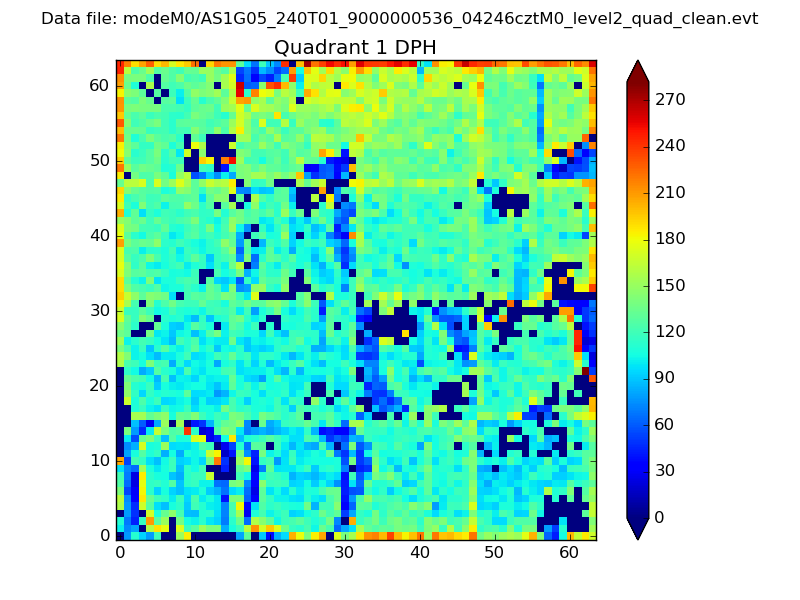 |
Quadrant B |
|---|---|---|---|
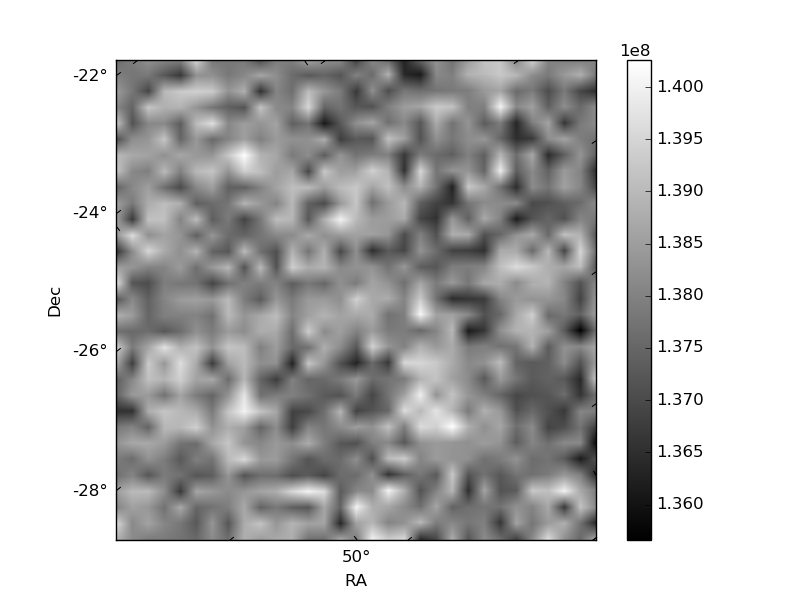
| Quadrant D | 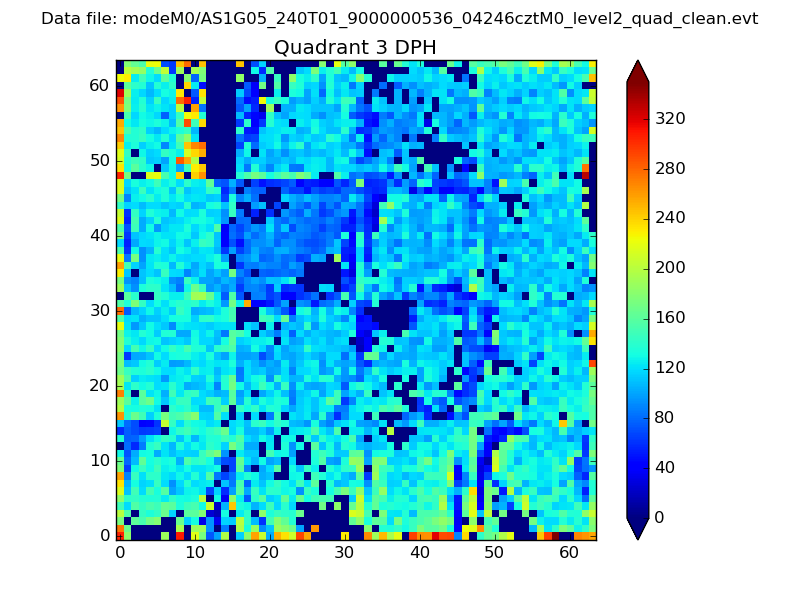 |
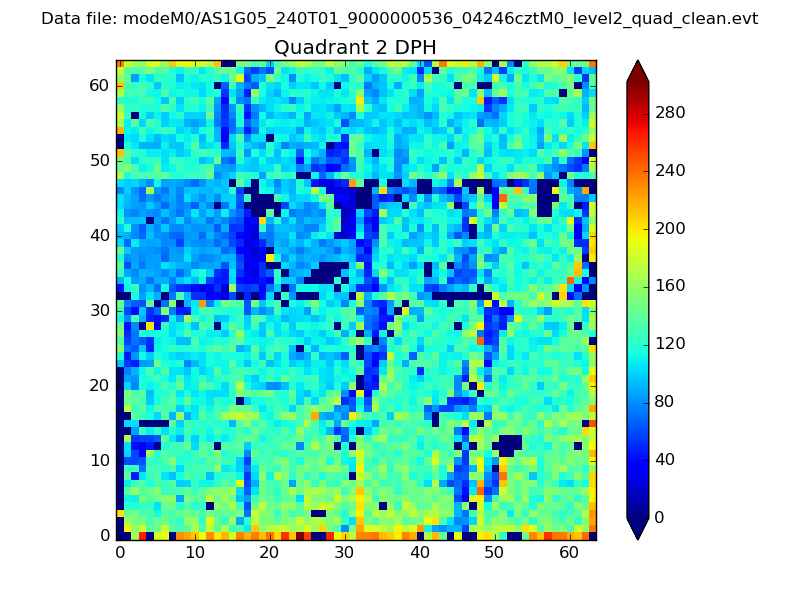 |
Quadrant C |
| Plot type | Count rate plots | Images |
|---|---|---|
| Comparison with Poisson distribution Blue bars denote a histogram of data divided into 1 sec bins. Red curve is a Poisson curve with rate = median count rate of data. |
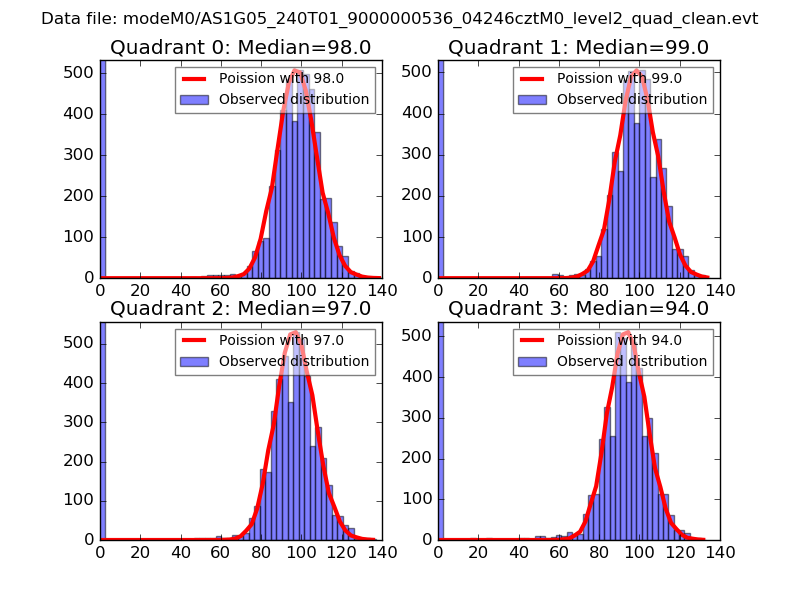 |
 |
| Quadrant-wise count rates Data is divided into 100 sec bins |
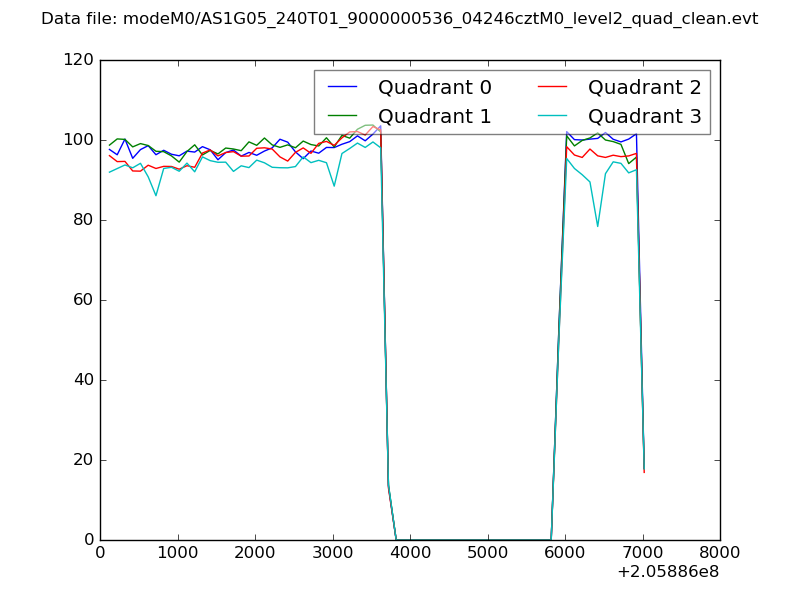 |
|
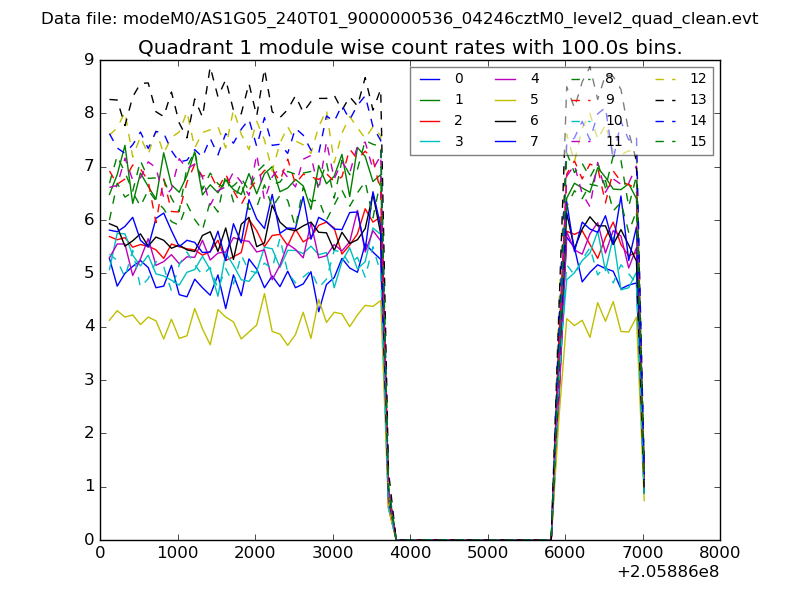
| Module-wise count rates for Quadrant A Data is divided into 100 sec bins |
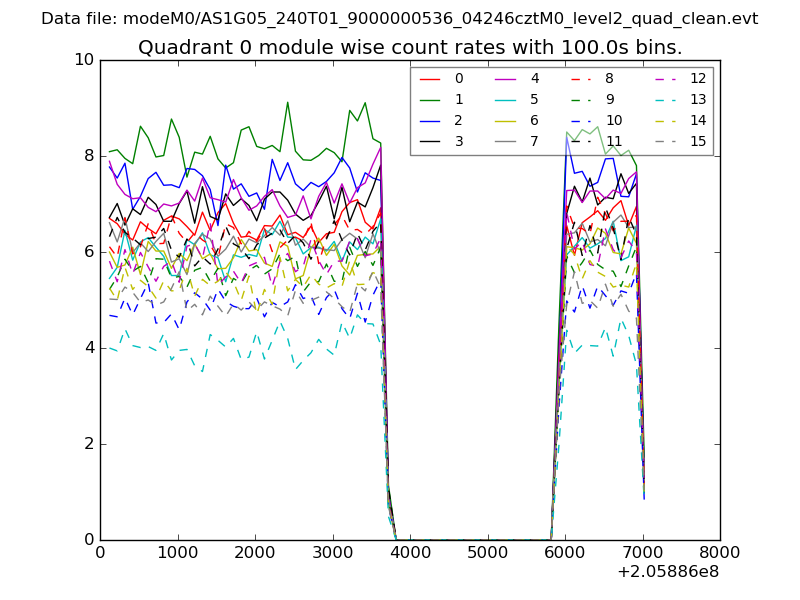 |
 |
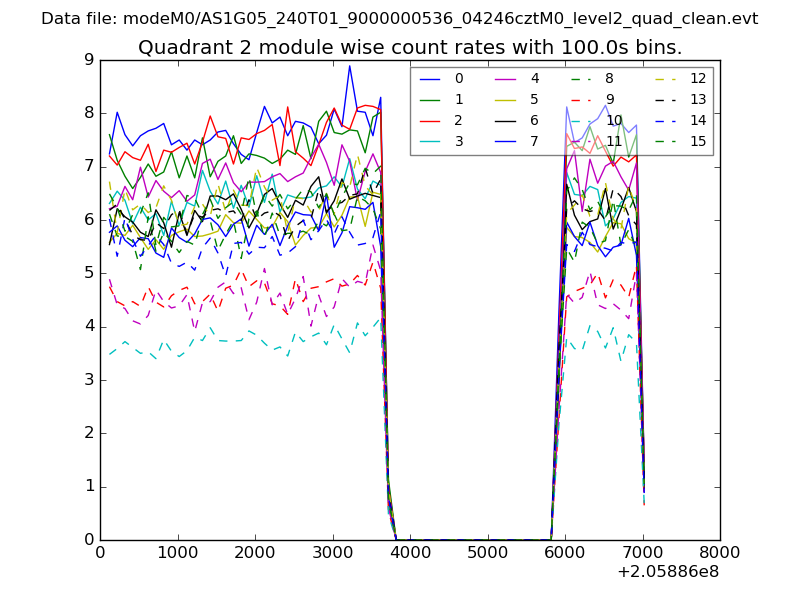
| Module-wise count rates for Quadrant B Data is divided into 100 sec bins |
 |
 |
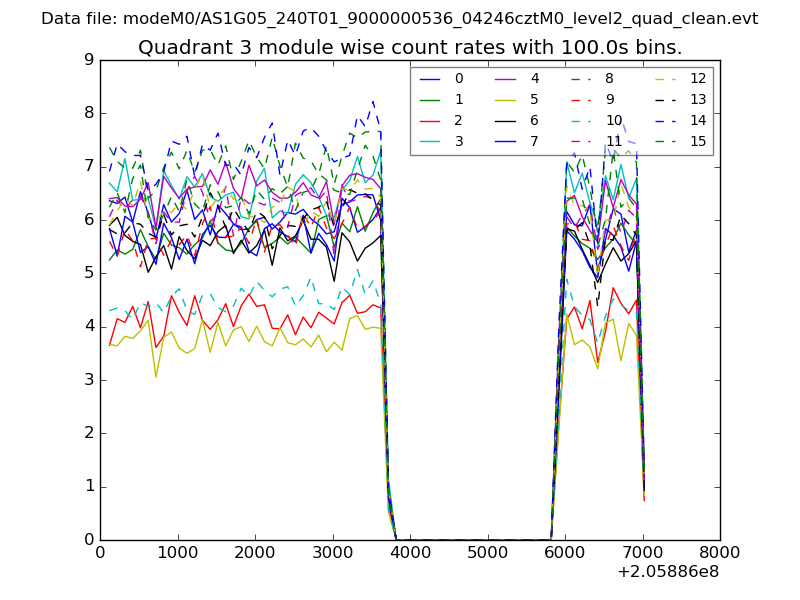
| Module-wise count rates for Quadrant C Data is divided into 100 sec bins |
 |
 |
| Module-wise count rates for Quadrant D Data is divided into 100 sec bins |
 |
 |
| Parameter | Plot |
|---|---|
| CZT HV Monitor | 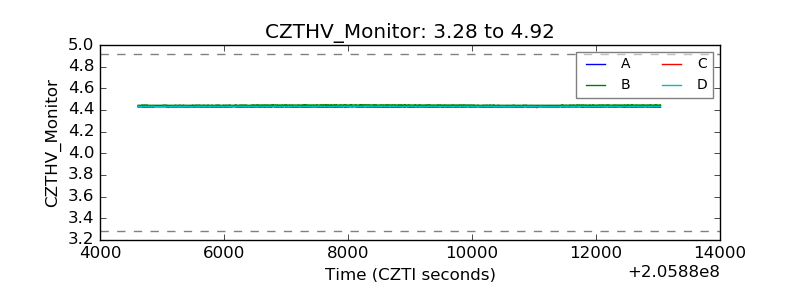 |
| D_VDD | 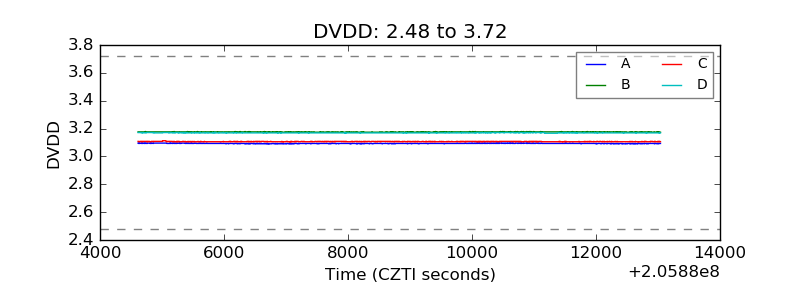 |
| Temperature 1 | 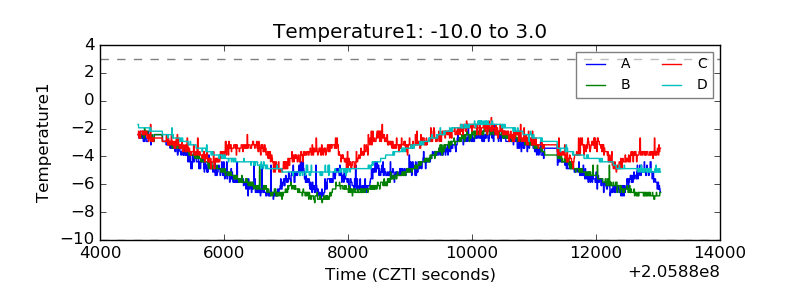 |
| Veto HV Monitor | 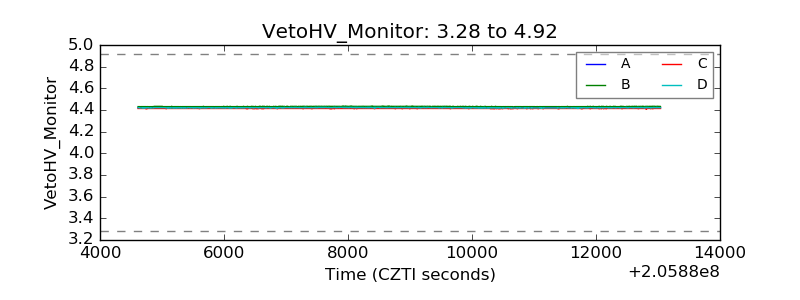 |
| Veto LLD | 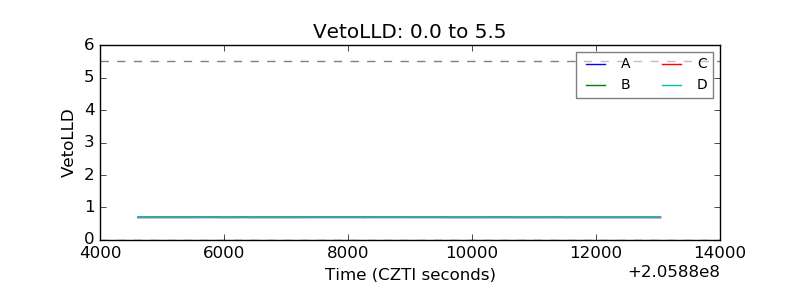 |
| Alpha Counter | 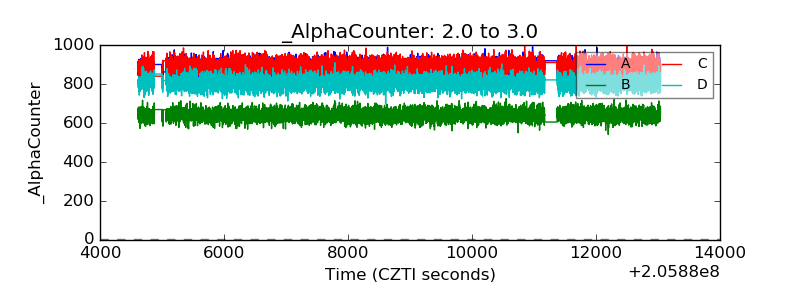 |
| _CPM_Rate | 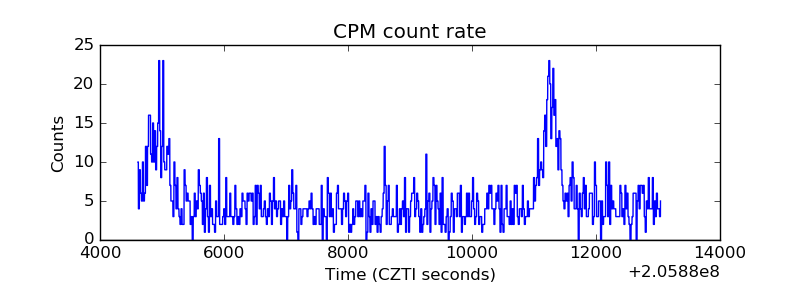 |
| CZT Counter | 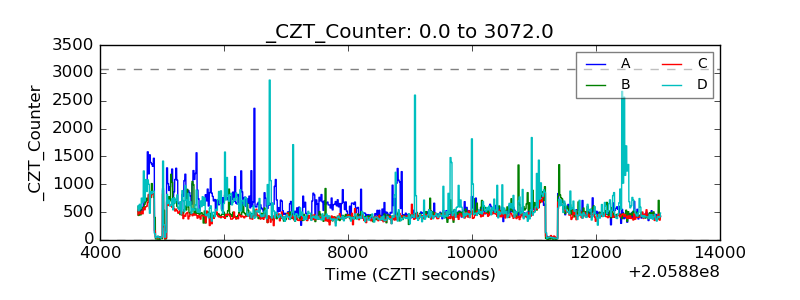 |
| +2.5 Volts monitor | 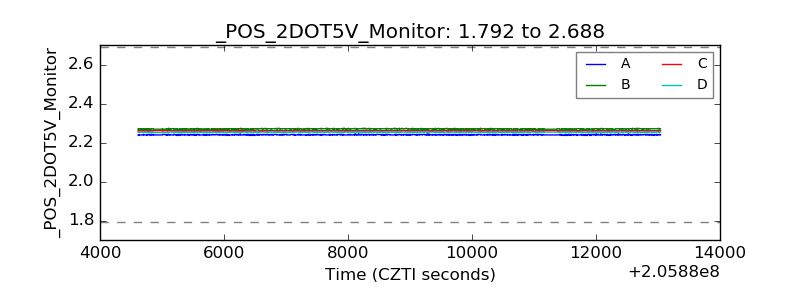 |
| +5 Volts monitor | 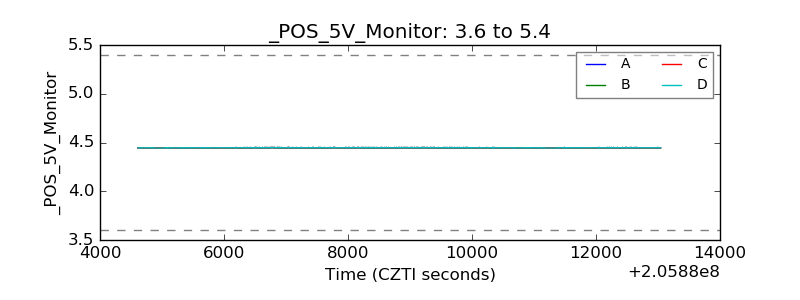 |
| _ROLL_ROT | 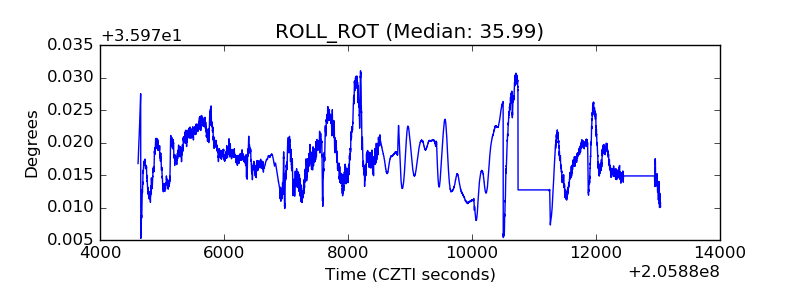 |
| _Roll_DEC | 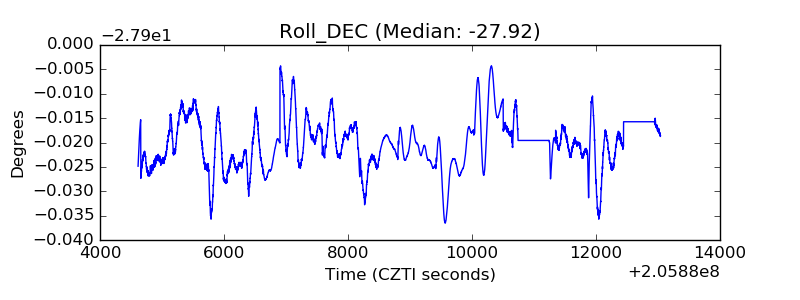 |
| _Roll_RA | 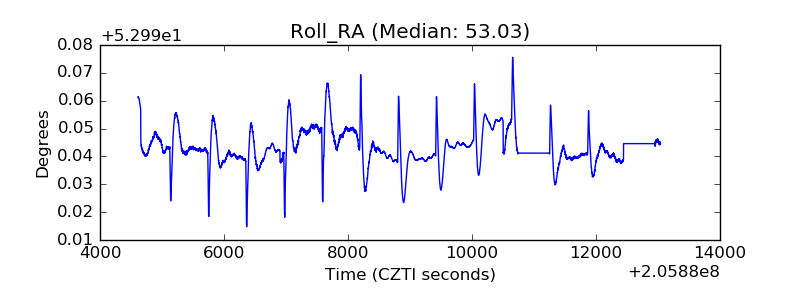 |
| Veto Counter | 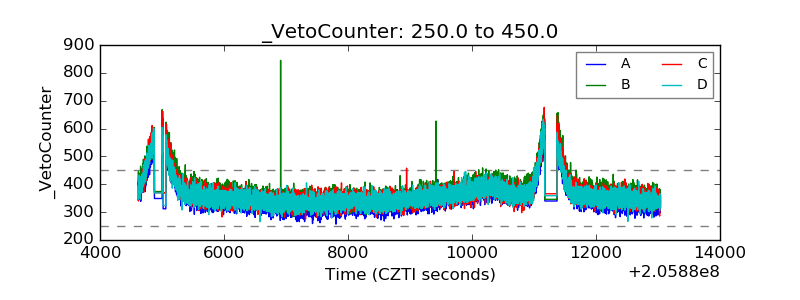 |