| Param | Original file | Final file |
|---|---|---|
| Filename | modeM0/AS1G05_240T01_9000000536_04249cztM0_level2.evt | modeM0/AS1G05_240T01_9000000536_04249cztM0_level2_quad_clean.evt |
| Size (bytes) | 24,027,840 | 3,162,240 |
| Size | 22.9 MB | 3.0 MB |
| Events in quadrant A | 198,131 | 16,792 |
| Events in quadrant B | 194,375 | 17,770 |
| Events in quadrant C | 234,163 | 21,470 |
| Events in quadrant D | 69,924 | 3,238 |
| Mode SS | |||
|---|---|---|---|
| Quadrant | BADHDUFLAG | Total packets | Discarded packets |
| A | 0 | 224764499168 | 0 |
| B | 0 | -1 | -1 |
| C | 0 | -1 | -1 |
| D | 0 | -1 | -1 |
| Mode M9 | |||
|---|---|---|---|
| Quadrant | BADHDUFLAG | Total packets | Discarded packets |
| A | 0 | 9 | 0 |
| B | 0 | 1 | 1 |
| C | 0 | 7 | 0 |
| D | 1 | 7 | 0 |
| Mode M0 | |||
|---|---|---|---|
| Quadrant | BADHDUFLAG | Total packets | Discarded packets |
| A | 0 | 7201 | 6377 |
| B | 0 | 7265 | 6440 |
| C | 0 | 6749 | 5677 |
| D | 0 | 10469 | 10199 |
| Quadrant | Total seconds | Saturated seconds | Saturation percentage |
|---|---|---|---|
| A | 412 | 2 | 0.485437% |
| B | 412 | 1 | 0.242718% |
| C | 537 | 2 | 0.372439% |
| D | 134 | 0 | 0.000000% |
Noise dominated data is calculated using 1-second bins in cleaned event files. If a bin has >2000 counts, and if more than 50% of those come from <1% of pixels, then it is considered to be noise-dominated and hence unusable.
| Quadrant | # 1 sec bins | Bins with >0 counts | Bins with >2000 counts | High rate bins dominated by noise | Noise dominated (total time) | Noise dominated (detector-on time) | Marked lightcurve |
|---|---|---|---|---|---|---|---|
| A | 17975 | 821 | 0 | 0 | 0.00% | 0.00% | 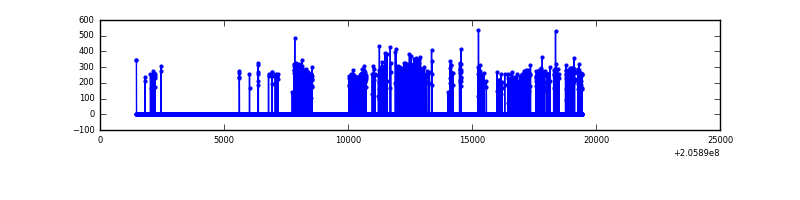 |
| B | 17565 | 822 | 0 | 0 | 0.00% | 0.00% | 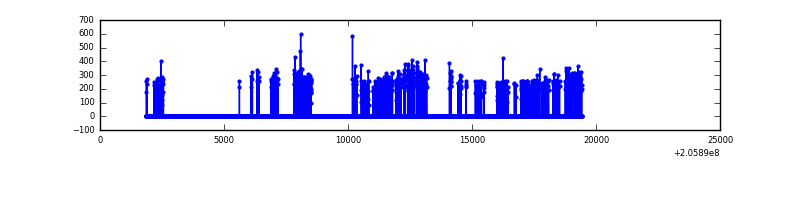 |
| C | 17942 | 1072 | 0 | 0 | 0.00% | 0.00% | 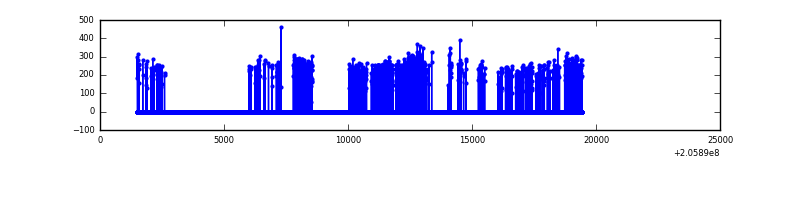 |
| D | 13748 | 266 | 0 | 0 | 0.00% | 0.00% | 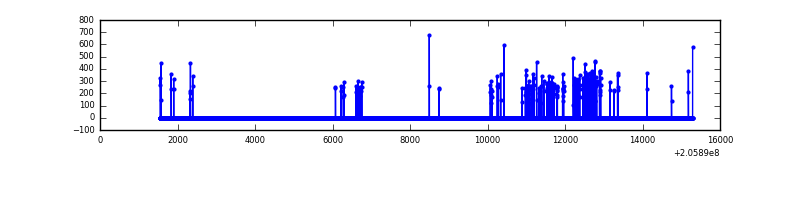 |
Top three noisy pixels from each quadrant. If the there are fewer than three noisy pixels in the level2.evt file, extra rows are filled as -1
| Pixel properties | Quadrant properties | ||||||
|---|---|---|---|---|---|---|---|
| Quadrant | DetID | PixID | Counts | Sigma | Mean | Median | Sigma |
| A | 0 | 149 | 4689 | 382.65 | 48 | 47 | 12.1 |
| A | 0 | 50 | 3361 | 273.18 | 48 | 47 | 12.1 |
| A | 8 | 15 | 2901 | 235.26 | 48 | 47 | 12.1 |
| B | 15 | 204 | 2352 | 197.34 | 47 | 46 | 11.7 |
| B | 10 | 16 | 1777 | 148.13 | 47 | 46 | 11.7 |
| B | 0 | 183 | 1418 | 117.41 | 47 | 46 | 11.7 |
| C | 9 | 144 | 791 | 46.47 | 59 | 59 | 15.8 |
| C | 13 | 61 | 523 | 29.46 | 59 | 59 | 15.8 |
| C | 14 | 67 | 275 | 13.71 | 59 | 59 | 15.8 |
| D | 11 | 132 | 6030 | 1138.6 | 15 | 14 | 5.3 |
| D | 2 | 232 | 1746 | 327.8 | 15 | 14 | 5.3 |
| D | 13 | 235 | 1514 | 283.89 | 15 | 14 | 5.3 |
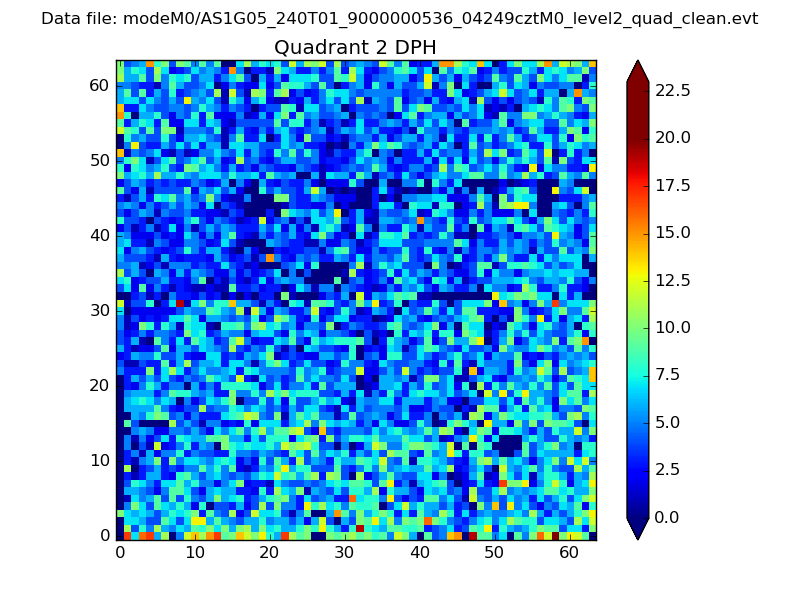
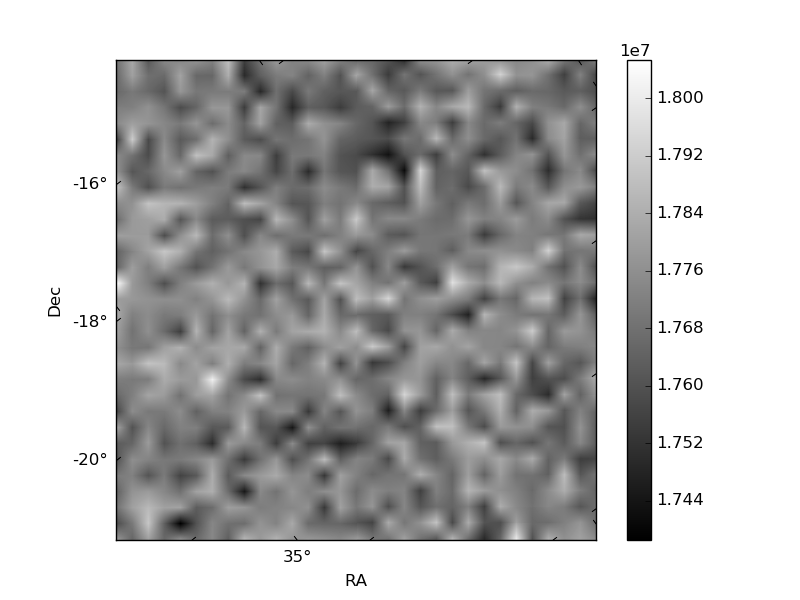
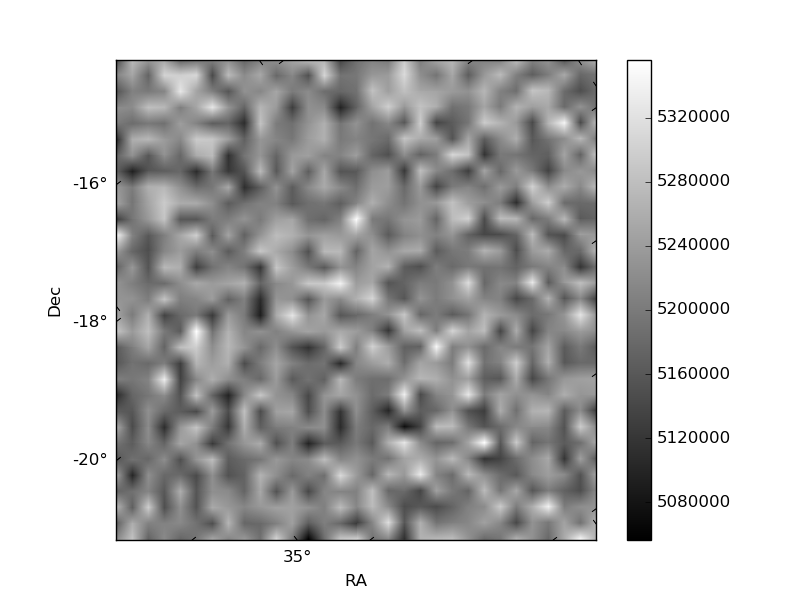
Histogram calculated using DETX and DETY for each event in the final _common_clean file
| Quadrant A | 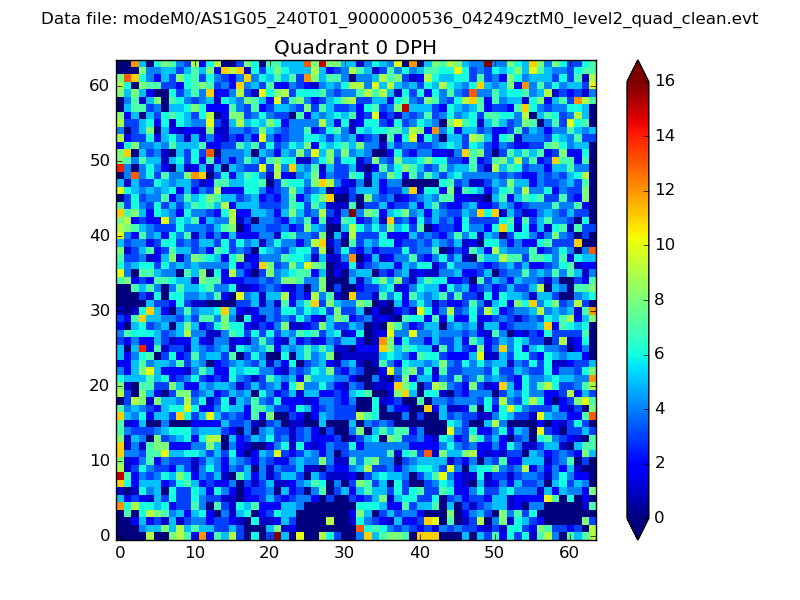 |
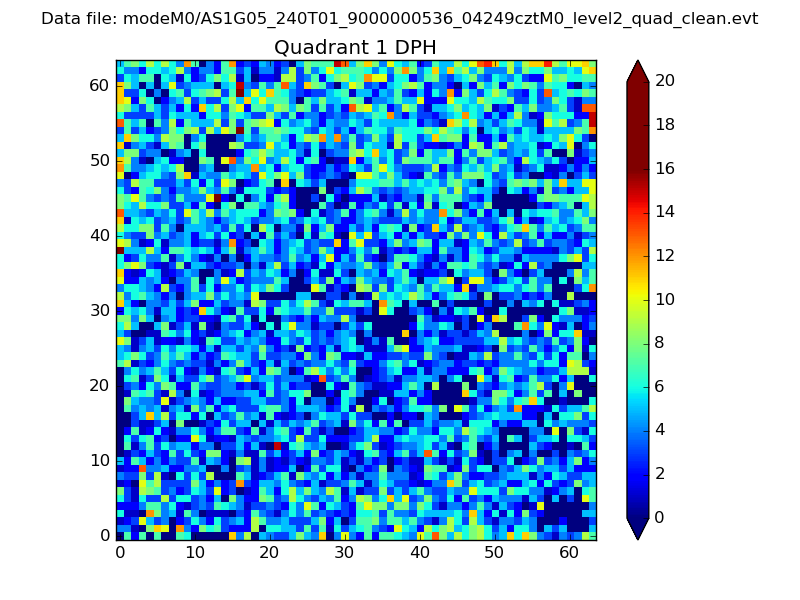 |
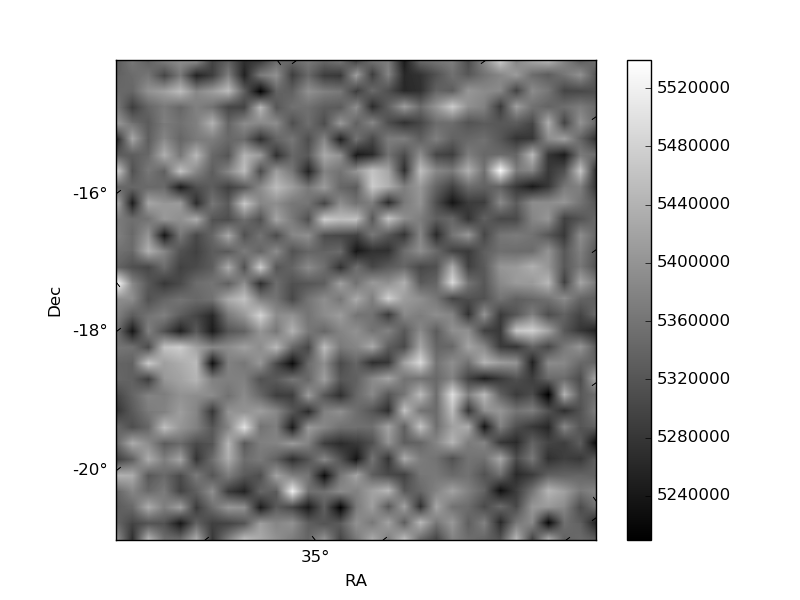
Quadrant B |
|---|---|---|---|
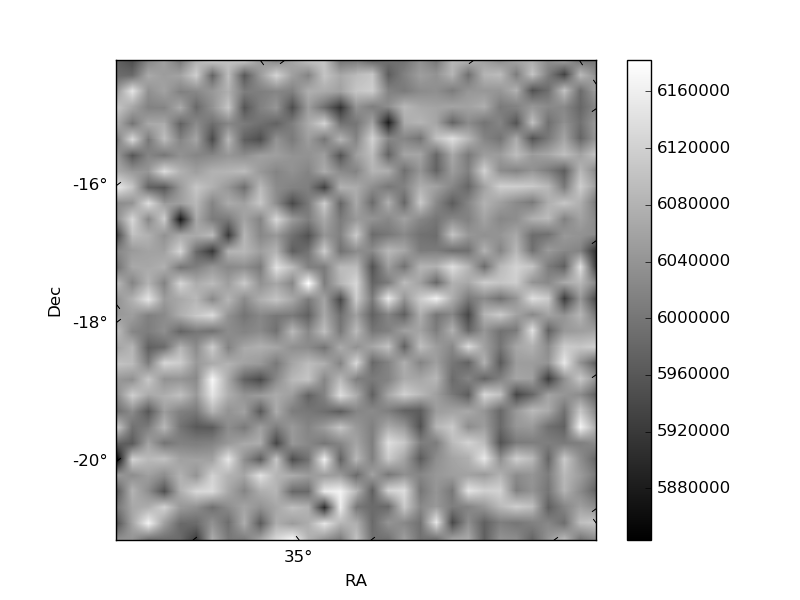
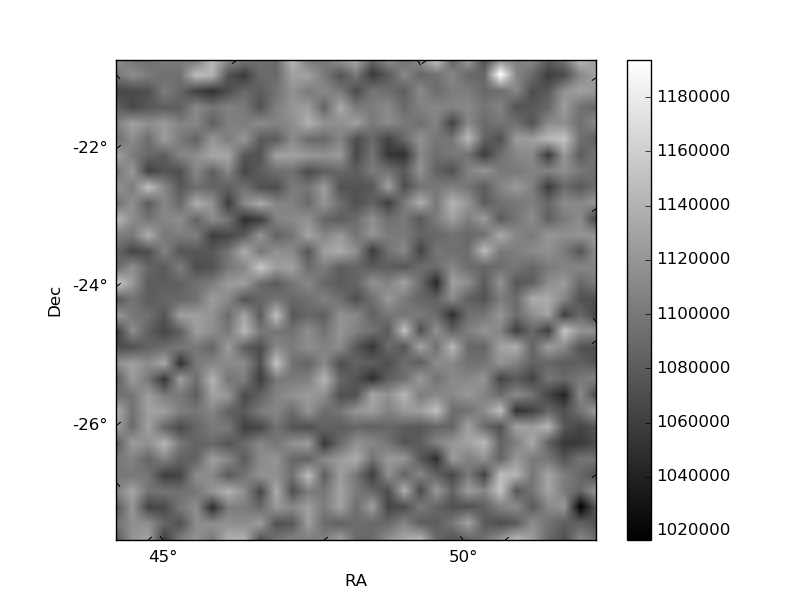
| Quadrant D | 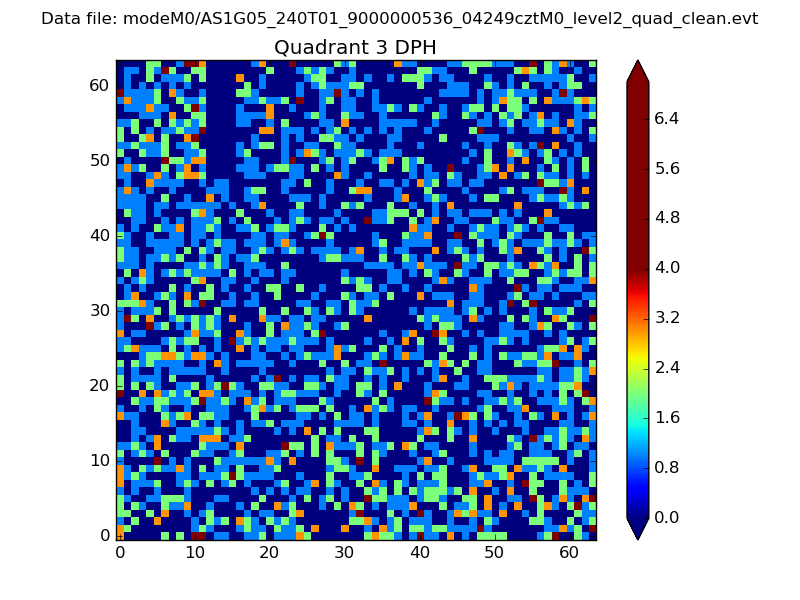 |
 |
Quadrant C |
| Plot type | Count rate plots | Images |
|---|---|---|
| Comparison with Poisson distribution Blue bars denote a histogram of data divided into 1 sec bins. Red curve is a Poisson curve with rate = median count rate of data. |
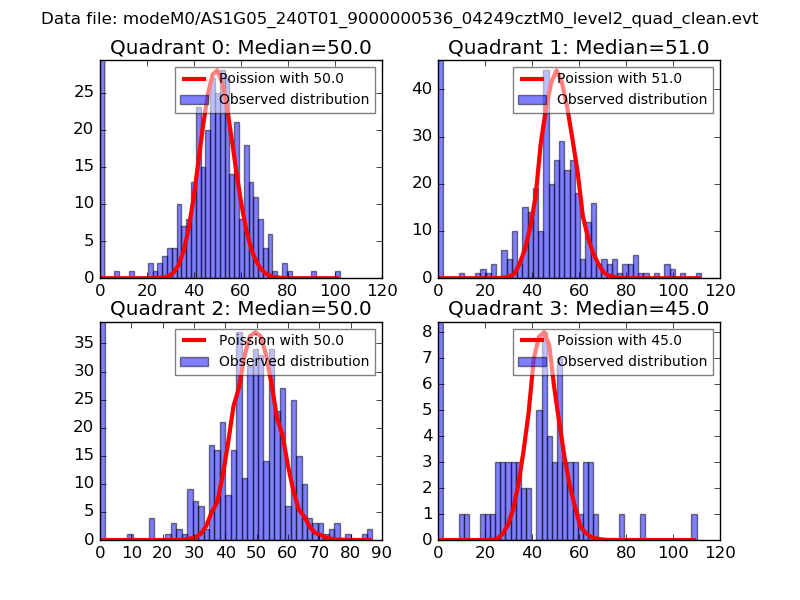 |
 |
| Quadrant-wise count rates Data is divided into 100 sec bins |
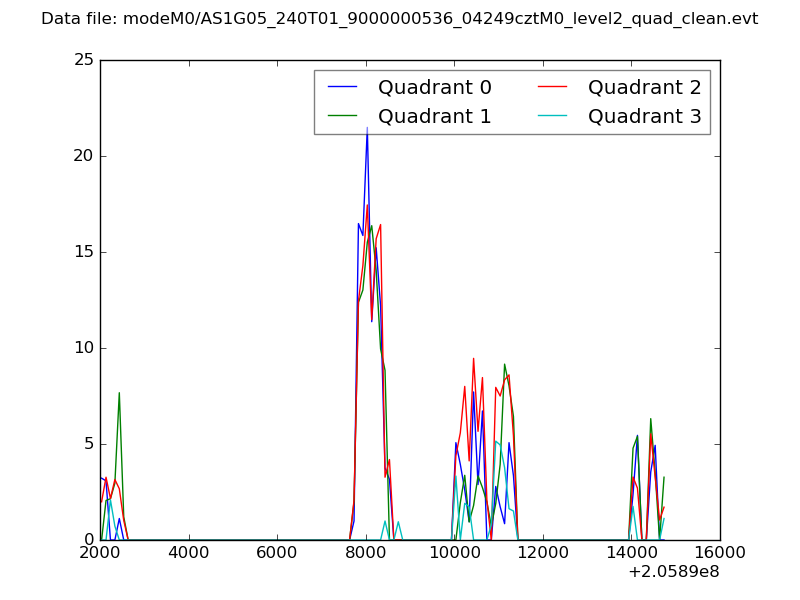 |
|
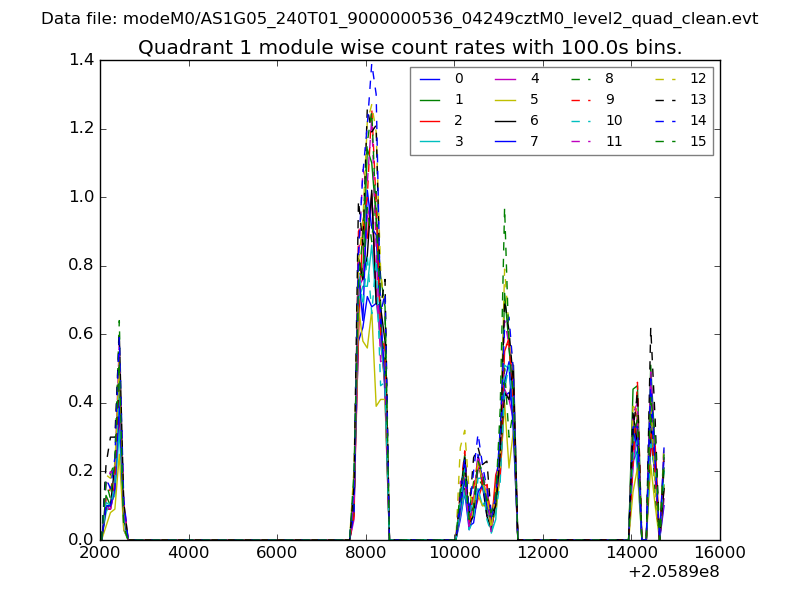
| Module-wise count rates for Quadrant A Data is divided into 100 sec bins |
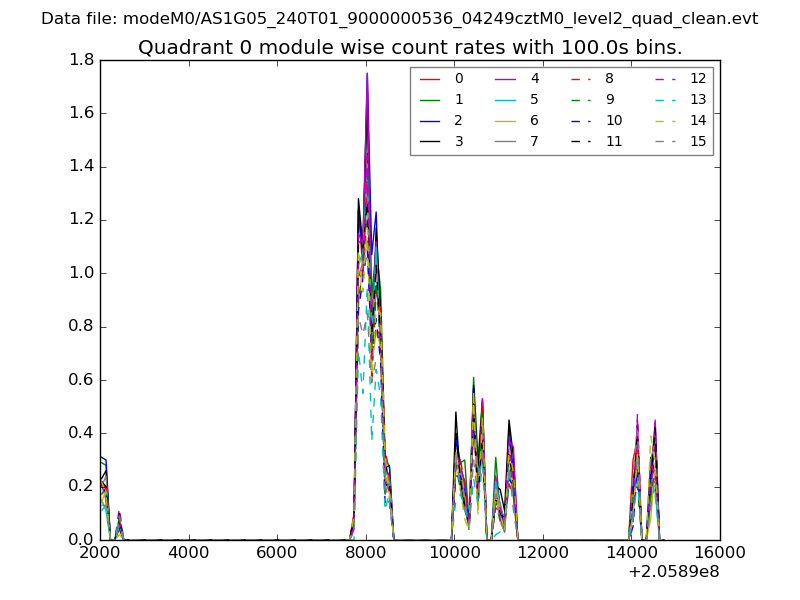 |
 |
| Module-wise count rates for Quadrant B Data is divided into 100 sec bins |
 |
 |
| Module-wise count rates for Quadrant C Data is divided into 100 sec bins |
 |
 |
| Module-wise count rates for Quadrant D Data is divided into 100 sec bins |
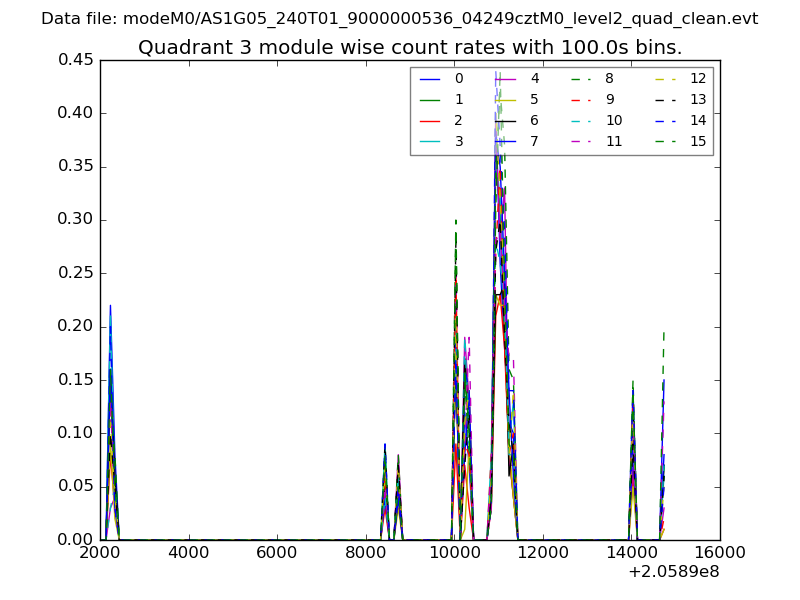 |
 |
| Parameter | Plot |
|---|---|
| CZT HV Monitor |  |
| D_VDD | 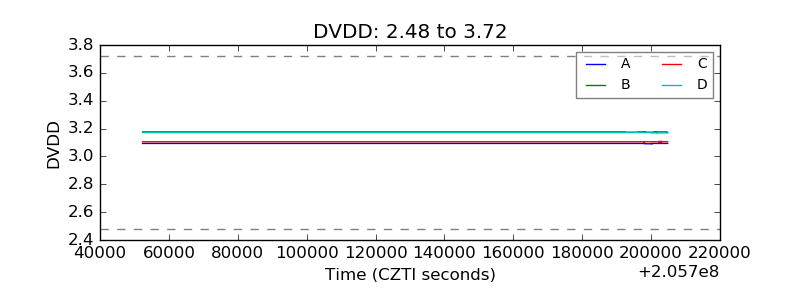 |
| Temperature 1 | 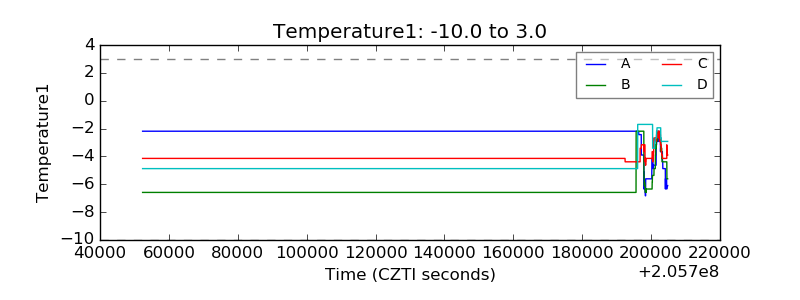 |
| Veto HV Monitor | 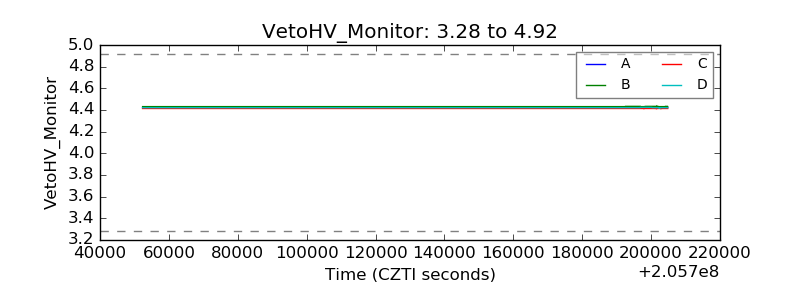 |
| Veto LLD | 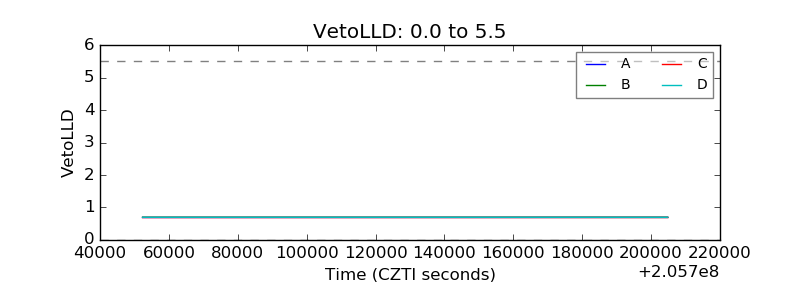 |
| Alpha Counter | 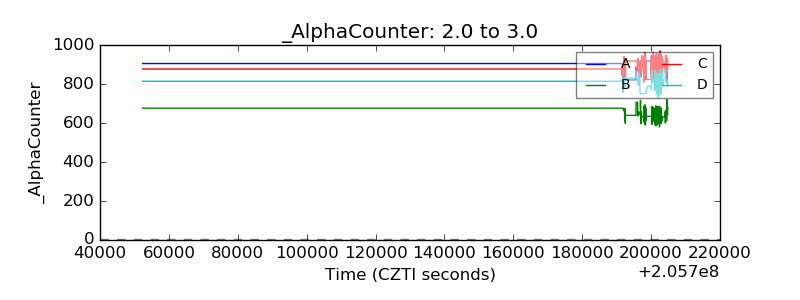 |
| _CPM_Rate | 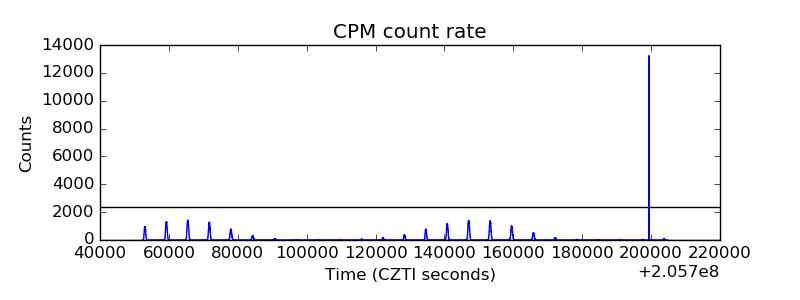 |
| CZT Counter | 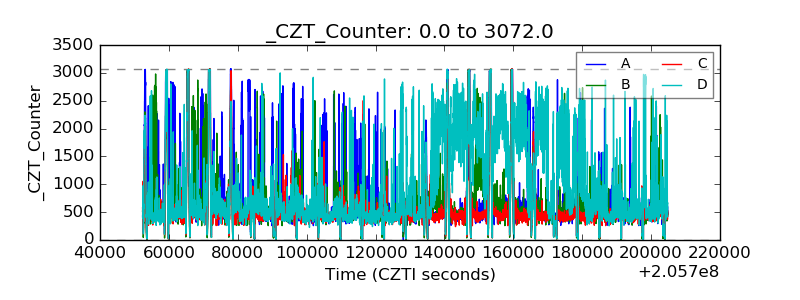 |
| +2.5 Volts monitor |  |
| +5 Volts monitor |  |
| _ROLL_ROT | 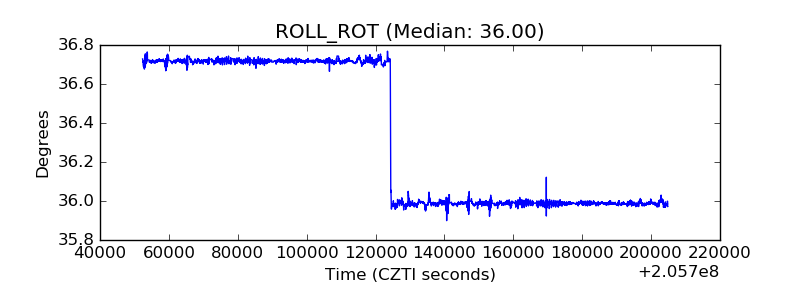 |
| _Roll_DEC | 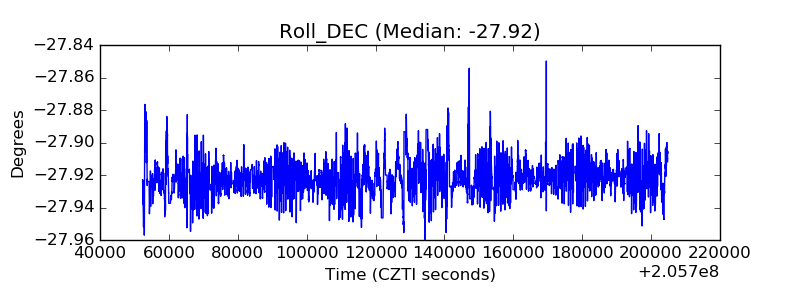 |
| _Roll_RA | 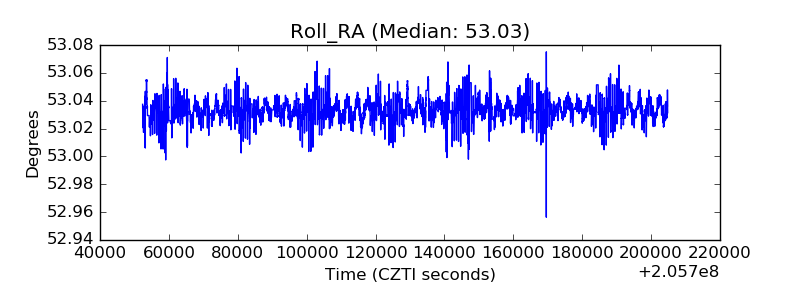 |
| Veto Counter | 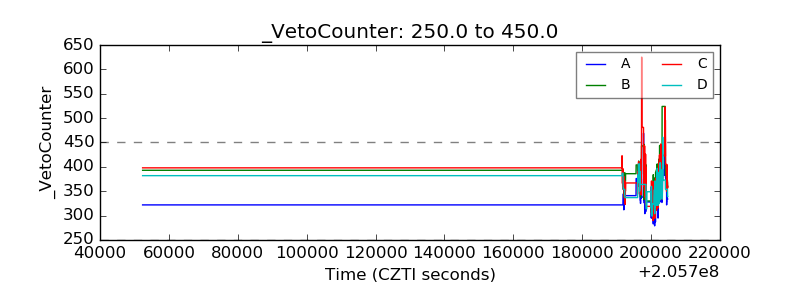 |