| Param | Original file | Final file |
|---|---|---|
| Filename | modeM0/AS1G05_240T01_9000000536_04250cztM0_level2.evt | modeM0/AS1G05_240T01_9000000536_04250cztM0_level2_quad_clean.evt |
| Size (bytes) | 77,106,240 | 8,400,960 |
| Size | 73.5 MB | 8.0 MB |
| Events in quadrant A | 711,009 | 38,162 |
| Events in quadrant B | 691,695 | 51,670 |
| Events in quadrant C | 719,034 | 39,843 |
| Events in quadrant D | 104,912 | 11,099 |
| Mode SS | |||
|---|---|---|---|
| Quadrant | BADHDUFLAG | Total packets | Discarded packets |
| A | 0 | 229 | 54 |
| B | 0 | 229 | 57 |
| C | 0 | 229 | 50 |
| D | 0 | 229 | 50 |
| Mode M9 | |||
|---|---|---|---|
| Quadrant | BADHDUFLAG | Total packets | Discarded packets |
| A | 0 | 6 | 0 |
| B | 0 | 21 | 0 |
| C | 0 | 6 | 0 |
| D | 0 | 21 | 0 |
| Mode M0 | |||
|---|---|---|---|
| Quadrant | BADHDUFLAG | Total packets | Discarded packets |
| A | 0 | 23872 | 20824 |
| B | 0 | 24250 | 21290 |
| C | 0 | 22842 | 19548 |
| D | 0 | 42221 | 41796 |
| Quadrant | Total seconds | Saturated seconds | Saturation percentage |
|---|---|---|---|
| A | 1525 | 2 | 0.131148% |
| B | 1483 | 4 | 0.269724% |
| C | 1649 | 2 | 0.121286% |
| D | 216 | 4 | 1.851852% |
Noise dominated data is calculated using 1-second bins in cleaned event files. If a bin has >2000 counts, and if more than 50% of those come from <1% of pixels, then it is considered to be noise-dominated and hence unusable.
| Quadrant | # 1 sec bins | Bins with >0 counts | Bins with >2000 counts | High rate bins dominated by noise | Noise dominated (total time) | Noise dominated (detector-on time) | Marked lightcurve |
|---|---|---|---|---|---|---|---|
| A | 24996 | 3047 | 0 | 0 | 0.00% | 0.00% |  |
| B | 24996 | 2961 | 0 | 0 | 0.00% | 0.00% |  |
| C | 24996 | 3296 | 0 | 0 | 0.00% | 0.00% | 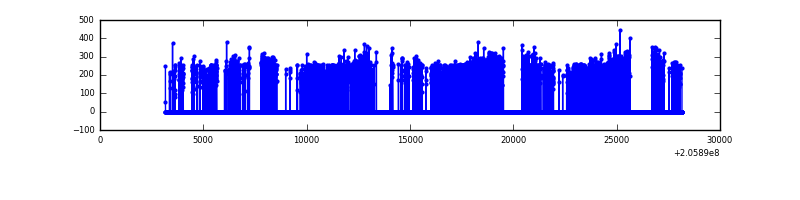 |
| D | 24784 | 428 | 0 | 0 | 0.00% | 0.00% | 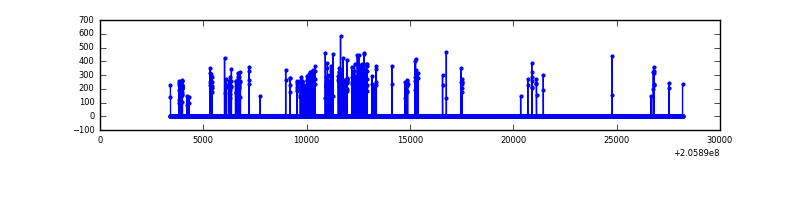 |
Top three noisy pixels from each quadrant. If the there are fewer than three noisy pixels in the level2.evt file, extra rows are filled as -1
| Pixel properties | Quadrant properties | ||||||
|---|---|---|---|---|---|---|---|
| Quadrant | DetID | PixID | Counts | Sigma | Mean | Median | Sigma |
| A | 0 | 149 | 16143 | 413.91 | 176 | 172 | 38.6 |
| A | 0 | 50 | 6469 | 163.19 | 176 | 172 | 38.6 |
| A | 8 | 15 | 6187 | 155.89 | 176 | 172 | 38.6 |
| B | 15 | 204 | 6688 | 185.14 | 172 | 168 | 35.2 |
| B | 0 | 183 | 4528 | 123.8 | 172 | 168 | 35.2 |
| B | 10 | 16 | 4134 | 112.62 | 172 | 168 | 35.2 |
| C | 9 | 144 | 4005 | 86.32 | 182 | 183 | 44.3 |
| C | 13 | 61 | 1517 | 30.13 | 182 | 183 | 44.3 |
| C | 14 | 67 | 1411 | 27.73 | 182 | 183 | 44.3 |
| D | 11 | 132 | 6621 | 883.18 | 23 | 22 | 7.5 |
| D | 2 | 136 | 2538 | 336.73 | 23 | 22 | 7.5 |
| D | 13 | 235 | 2085 | 276.1 | 23 | 22 | 7.5 |
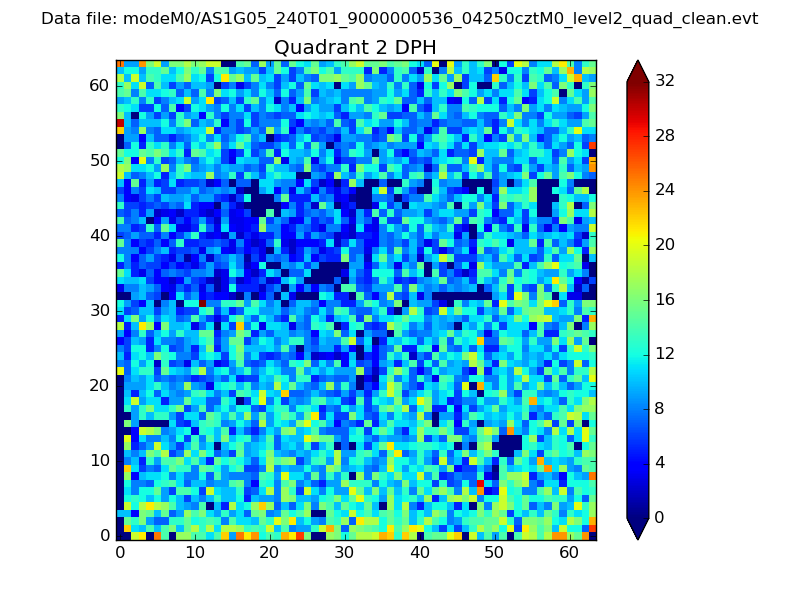
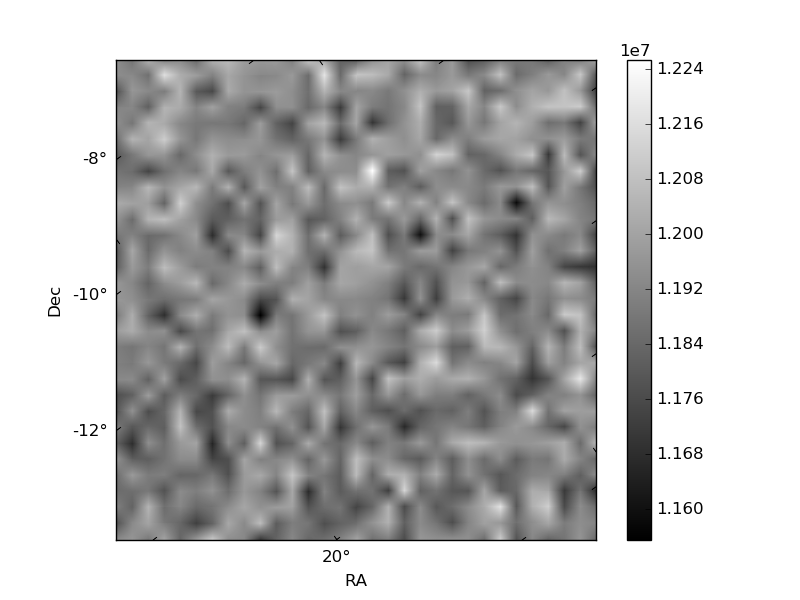
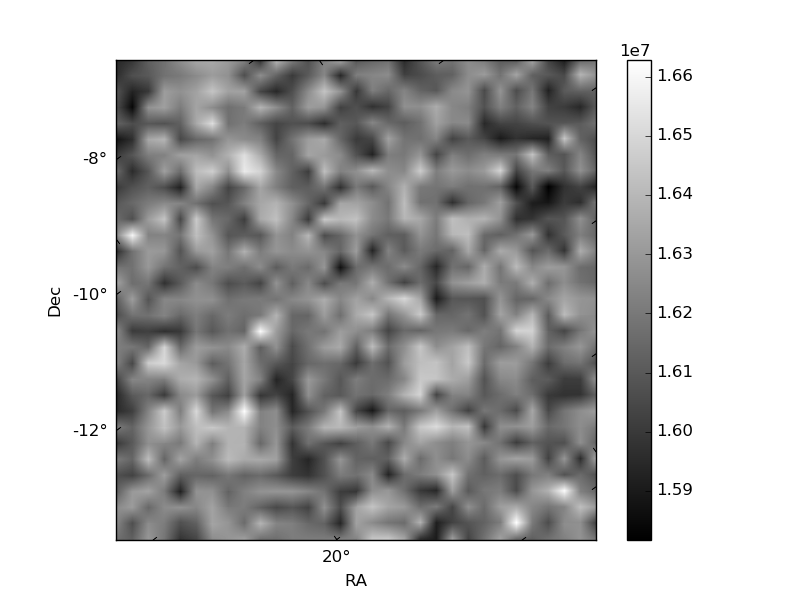
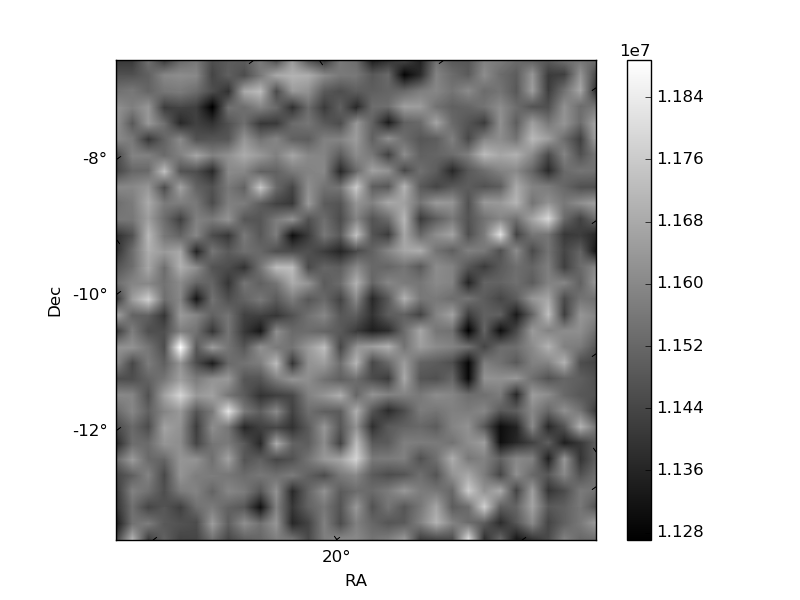
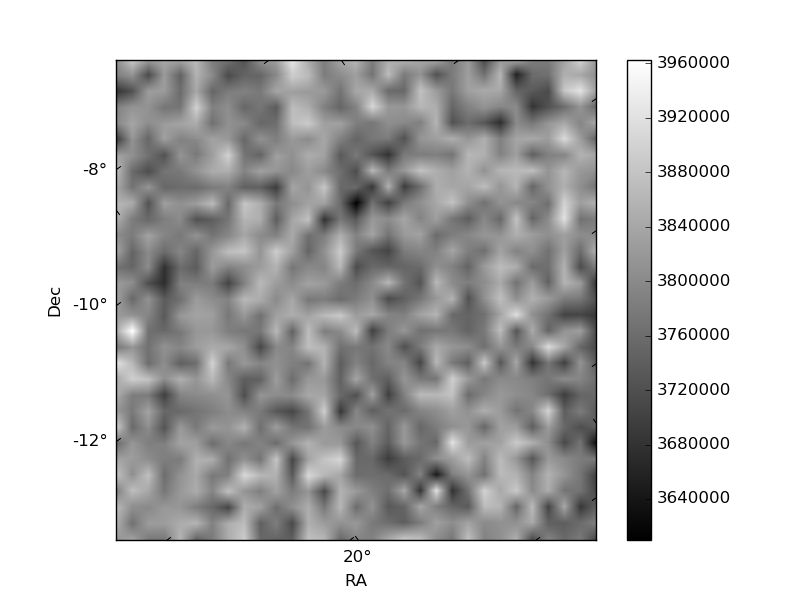
Histogram calculated using DETX and DETY for each event in the final _common_clean file
| Quadrant A | 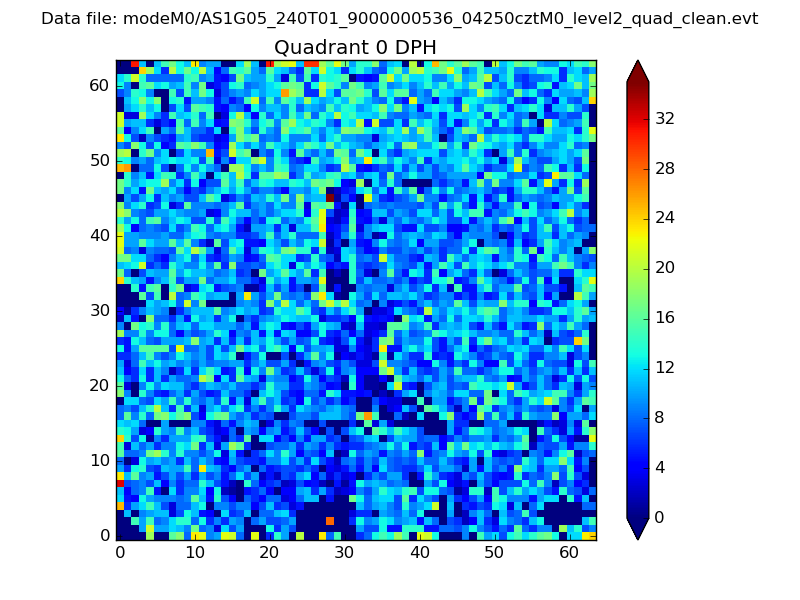 |
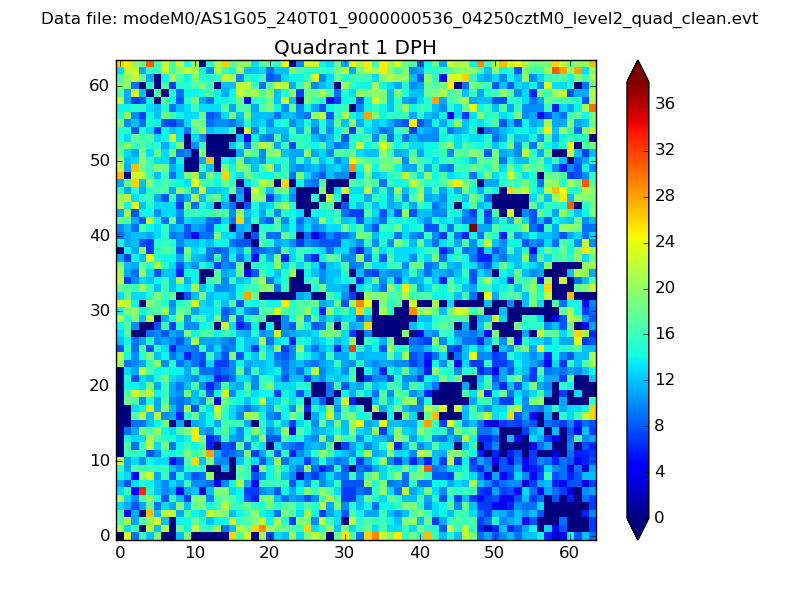 |
Quadrant B |
|---|---|---|---|
| Quadrant D | 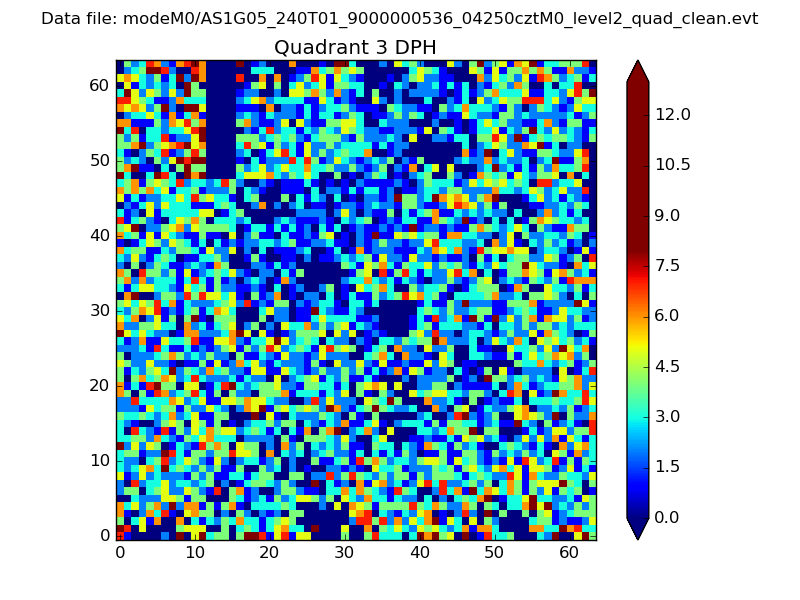 |
 |
Quadrant C |
| Plot type | Count rate plots | Images |
|---|---|---|
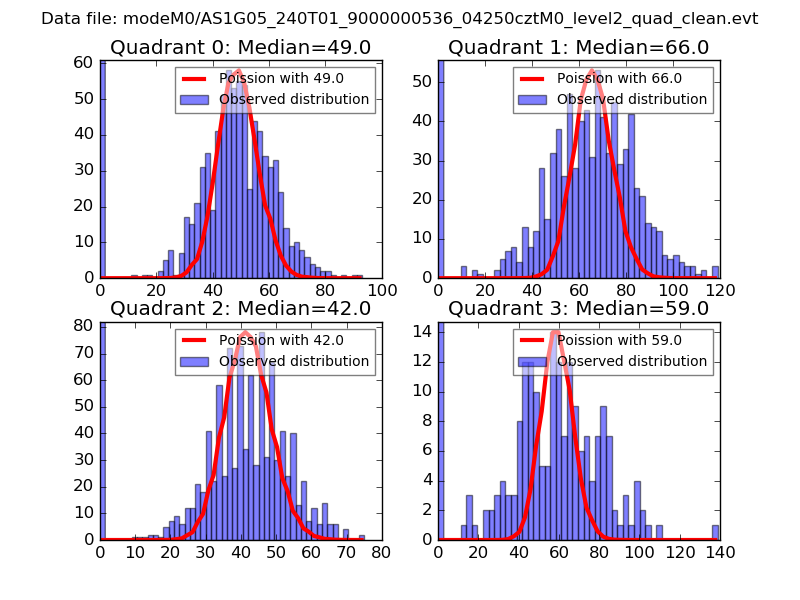
| Comparison with Poisson distribution Blue bars denote a histogram of data divided into 1 sec bins. Red curve is a Poisson curve with rate = median count rate of data. |
 |
 |
| Quadrant-wise count rates Data is divided into 100 sec bins |
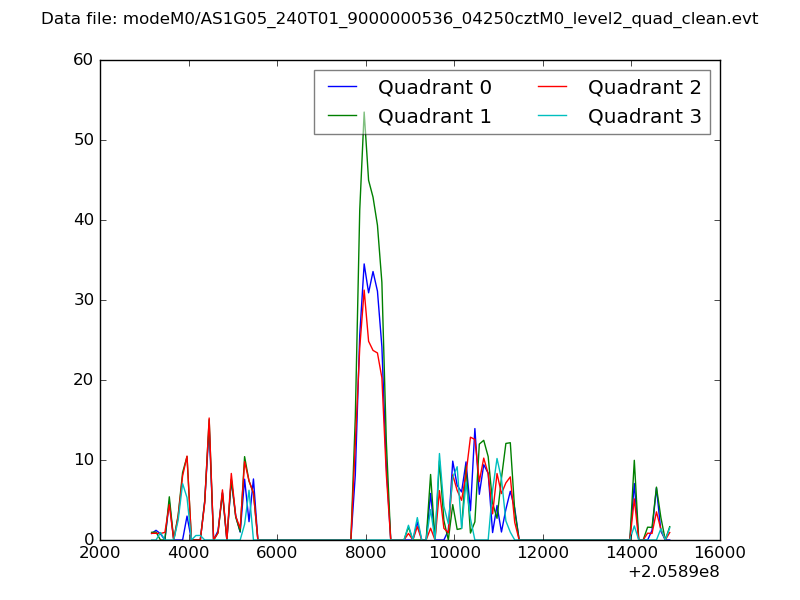 |
|
| Module-wise count rates for Quadrant A Data is divided into 100 sec bins |
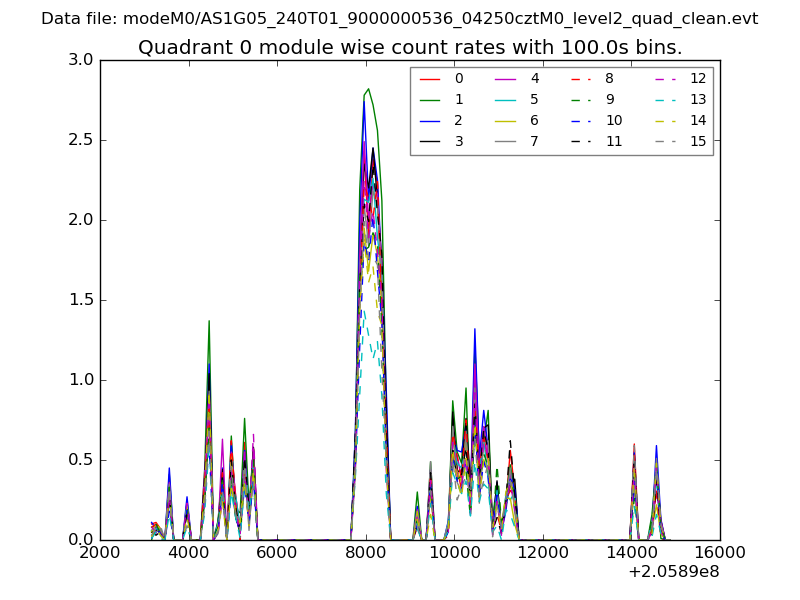 |
 |
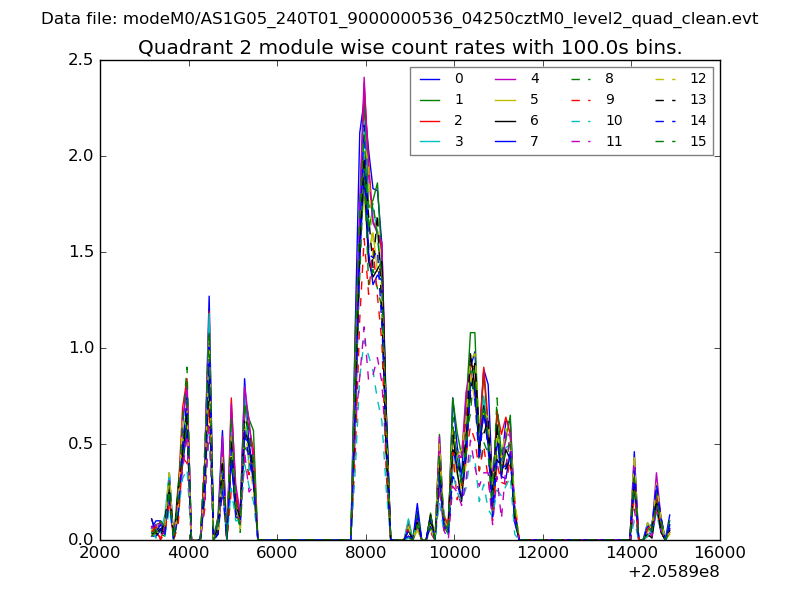
| Module-wise count rates for Quadrant B Data is divided into 100 sec bins |
 |
 |
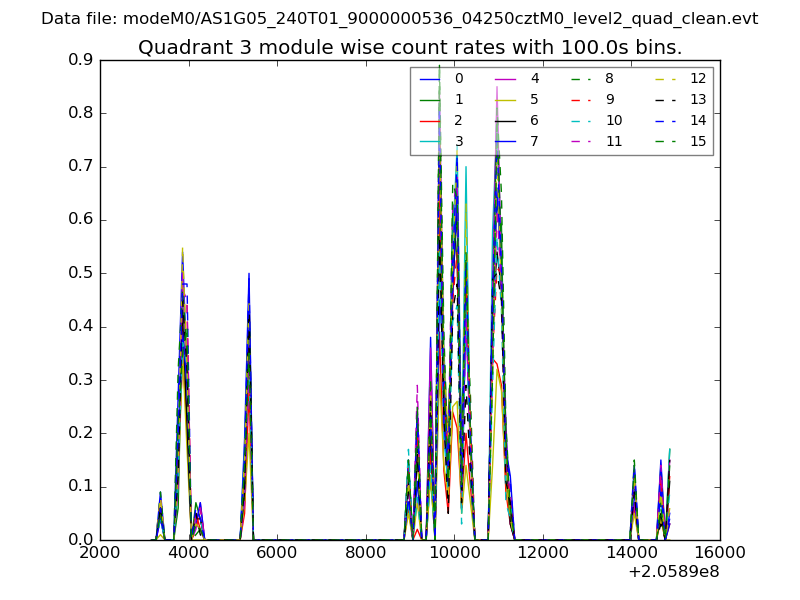
| Module-wise count rates for Quadrant C Data is divided into 100 sec bins |
 |
 |
| Module-wise count rates for Quadrant D Data is divided into 100 sec bins |
 |
 |
| Parameter | Plot |
|---|---|
| CZT HV Monitor | 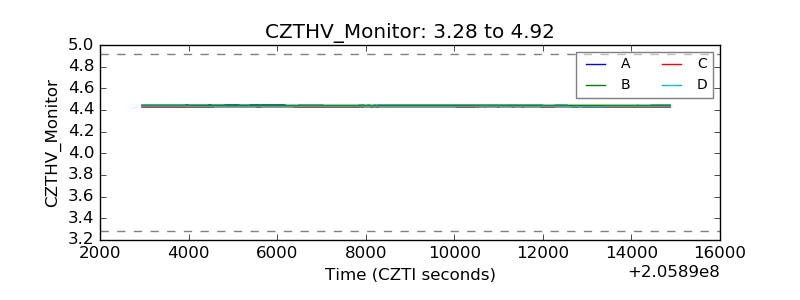 |
| D_VDD | 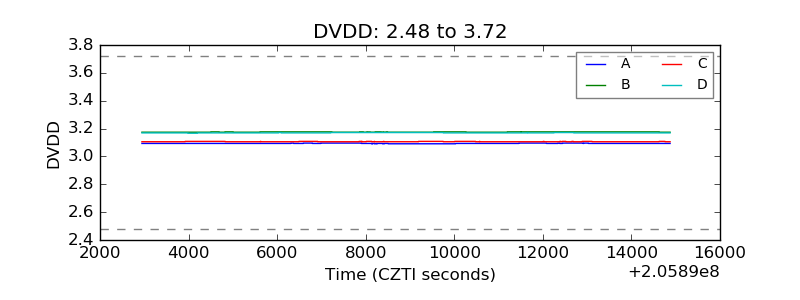 |
| Temperature 1 | 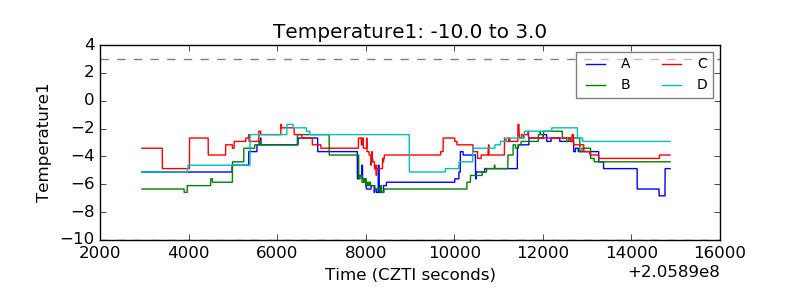 |
| Veto HV Monitor | 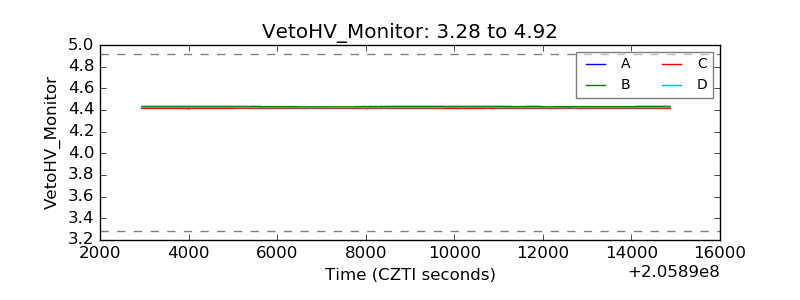 |
| Veto LLD | 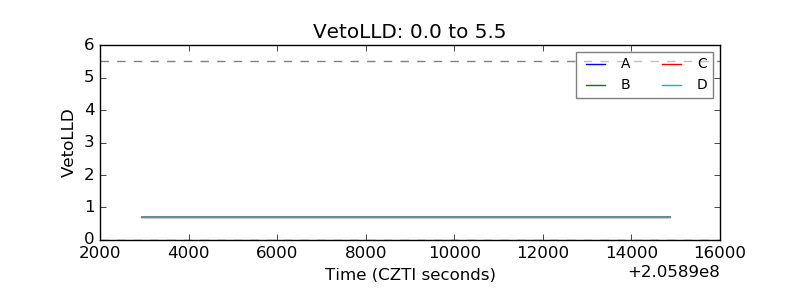 |
| Alpha Counter | 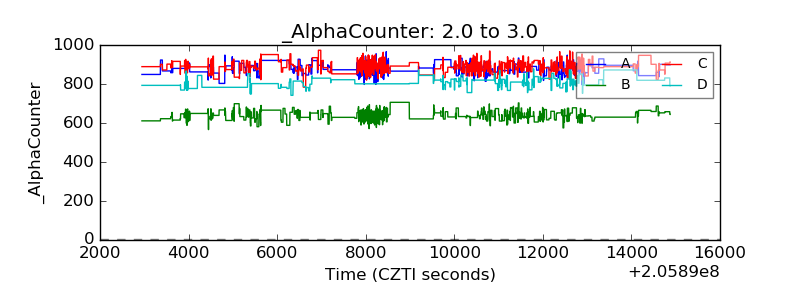 |
| _CPM_Rate | 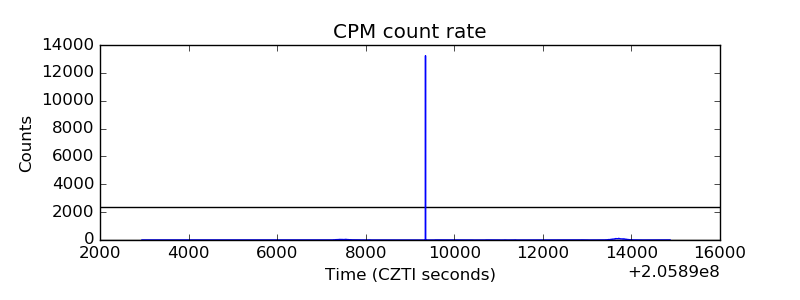 |
| CZT Counter | 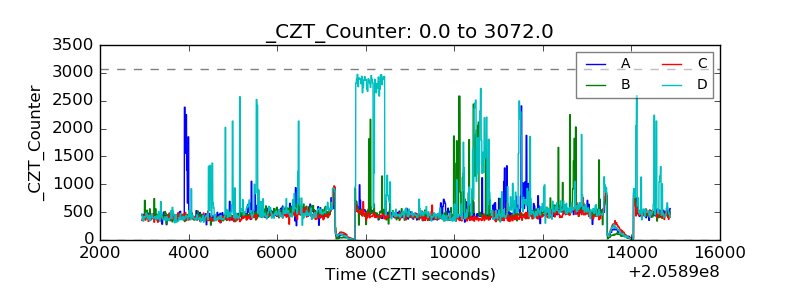 |
| +2.5 Volts monitor |  |
| +5 Volts monitor |  |
| _ROLL_ROT | 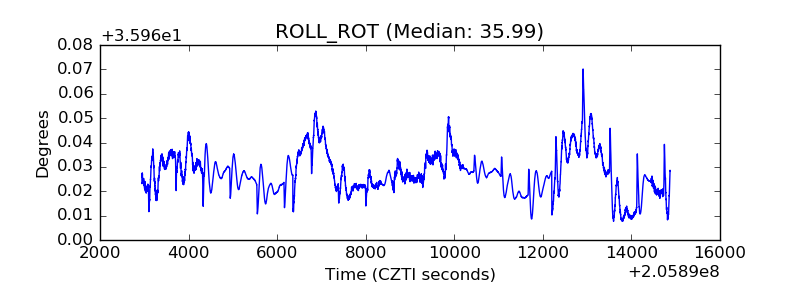 |
| _Roll_DEC | 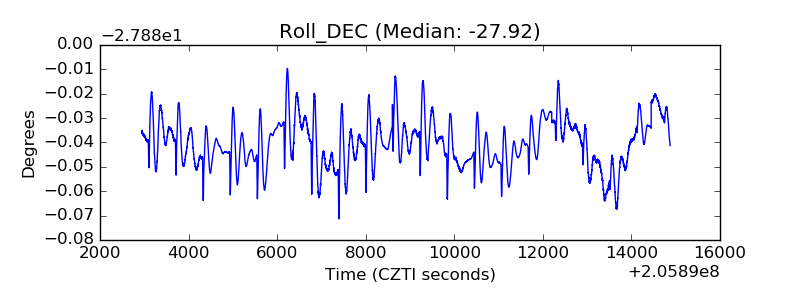 |
| _Roll_RA | 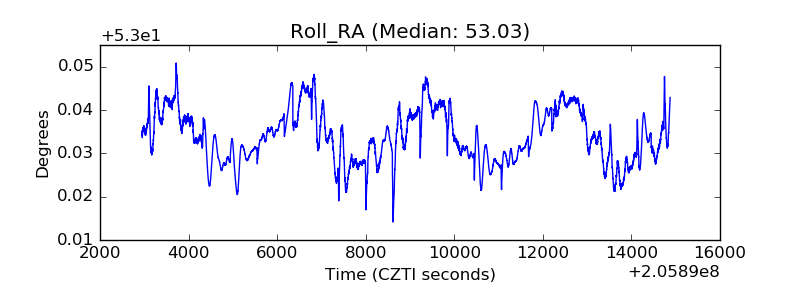 |
| Veto Counter | 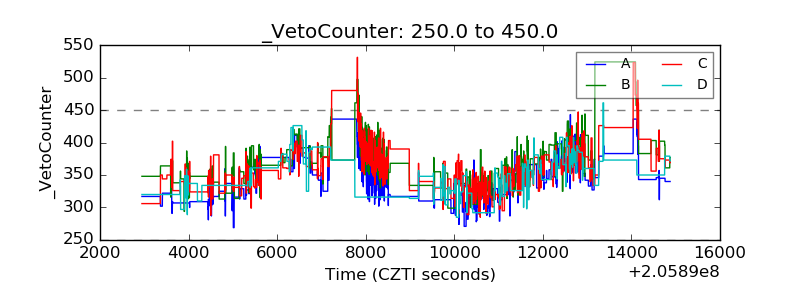 |