| Param | Original file | Final file |
|---|---|---|
| Filename | modeM0/AS1G05_240T01_9000000536_04253cztM0_level2.evt | modeM0/AS1G05_240T01_9000000536_04253cztM0_level2_quad_clean.evt |
| Size (bytes) | 676,745,280 | 71,153,280 |
| Size | 645.4 MB | 67.9 MB |
| Events in quadrant A | 5,879,987 | 420,873 |
| Events in quadrant B | 3,860,007 | 445,971 |
| Events in quadrant C | 2,841,659 | 436,318 |
| Events in quadrant D | 7,491,362 | 415,195 |
| Mode SS | |||
|---|---|---|---|
| Quadrant | BADHDUFLAG | Total packets | Discarded packets |
| A | 0 | 128 | 0 |
| B | 0 | 128 | 0 |
| C | 0 | 128 | 0 |
| D | 0 | 128 | 0 |
| Mode M9 | |||
|---|---|---|---|
| Quadrant | BADHDUFLAG | Total packets | Discarded packets |
| A | 0 | 12 | 0 |
| B | 0 | 12 | 0 |
| C | 0 | 12 | 0 |
| D | 0 | 12 | 0 |
| Mode M0 | |||
|---|---|---|---|
| Quadrant | BADHDUFLAG | Total packets | Discarded packets |
| A | 0 | 21424 | 2 |
| B | 0 | 15424 | 1 |
| C | 0 | 12697 | 1 |
| D | 0 | 26544 | 1 |
| Quadrant | Total seconds | Saturated seconds | Saturation percentage |
|---|---|---|---|
| A | 6237 | 1013 | 16.241783% |
| B | 6237 | 178 | 2.853936% |
| C | 6237 | 14 | 0.224467% |
| D | 6237 | 1620 | 25.974026% |
Noise dominated data is calculated using 1-second bins in cleaned event files. If a bin has >2000 counts, and if more than 50% of those come from <1% of pixels, then it is considered to be noise-dominated and hence unusable.
| Quadrant | # 1 sec bins | Bins with >0 counts | Bins with >2000 counts | High rate bins dominated by noise | Noise dominated (total time) | Noise dominated (detector-on time) | Marked lightcurve |
|---|---|---|---|---|---|---|---|
| A | 7437 | 6238 | 844 | 844 | 11.35% | 13.53% | 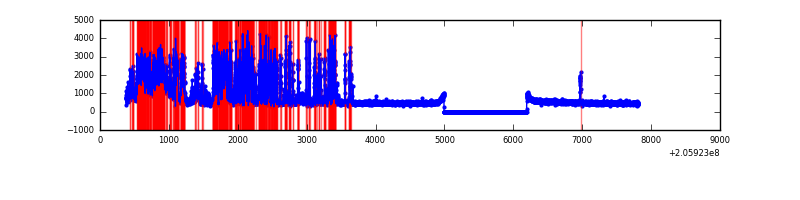 |
| B | 7437 | 6238 | 117 | 117 | 1.57% | 1.88% | 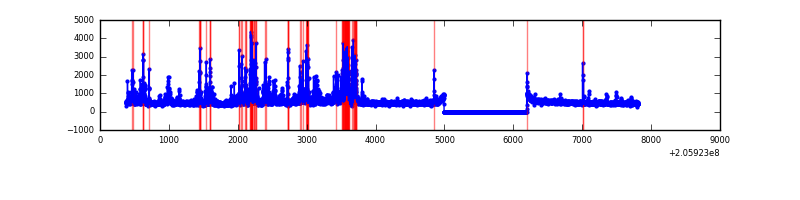 |
| C | 7437 | 6238 | 0 | 0 | 0.00% | 0.00% | 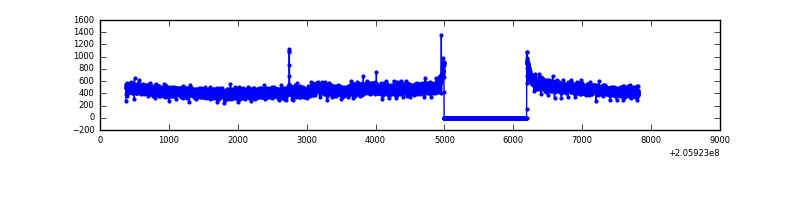 |
| D | 7437 | 6238 | 1548 | 1548 | 20.81% | 24.82% | 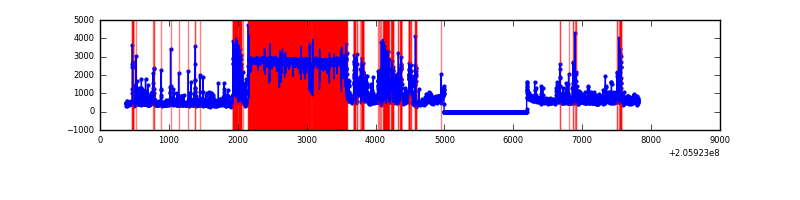 |
Top three noisy pixels from each quadrant. If the there are fewer than three noisy pixels in the level2.evt file, extra rows are filled as -1
| Pixel properties | Quadrant properties | ||||||
|---|---|---|---|---|---|---|---|
| Quadrant | DetID | PixID | Counts | Sigma | Mean | Median | Sigma |
| A | 0 | 199 | 2793150 | 19336.66 | 706 | 693 | 144.4 |
| A | 0 | 226 | 254543 | 1757.81 | 706 | 693 | 144.4 |
| A | 0 | 149 | 63587 | 435.52 | 706 | 693 | 144.4 |
| B | 14 | 167 | 799250 | 5607.54 | 742 | 727 | 142.4 |
| B | 15 | 204 | 116528 | 813.2 | 742 | 727 | 142.4 |
| B | 4 | 81 | 17299 | 116.38 | 742 | 727 | 142.4 |
| C | 9 | 144 | 45073 | 265.9 | 715 | 717 | 166.8 |
| C | 13 | 61 | 5904 | 31.09 | 715 | 717 | 166.8 |
| C | 10 | 65 | 2030 | 7.87 | 715 | 717 | 166.8 |
| D | 4 | 95 | 4109725 | 27198.58 | 622 | 604 | 151.1 |
| D | 11 | 132 | 393333 | 2599.5 | 622 | 604 | 151.1 |
| D | 2 | 136 | 222174 | 1466.59 | 622 | 604 | 151.1 |
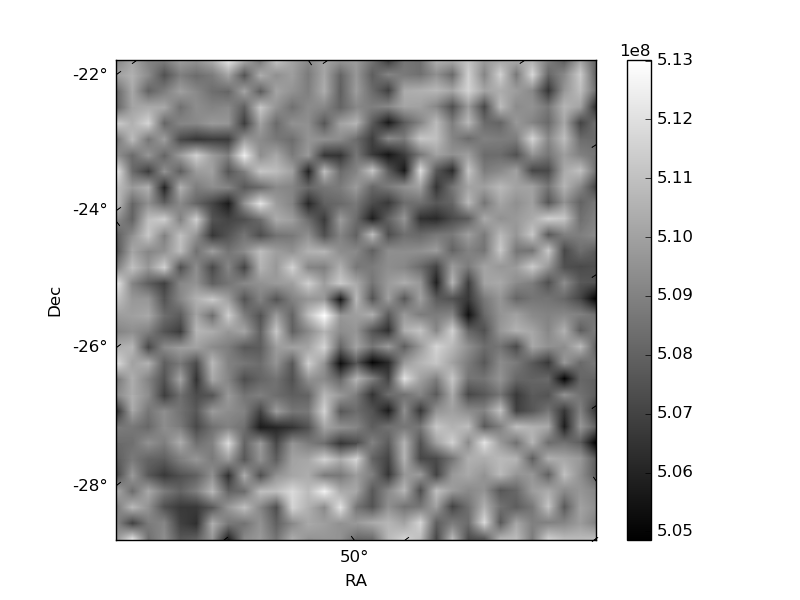
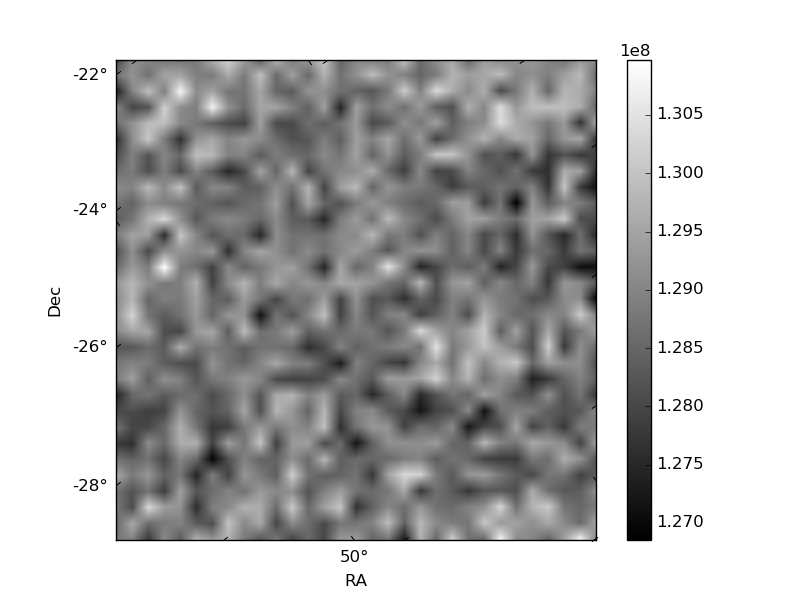
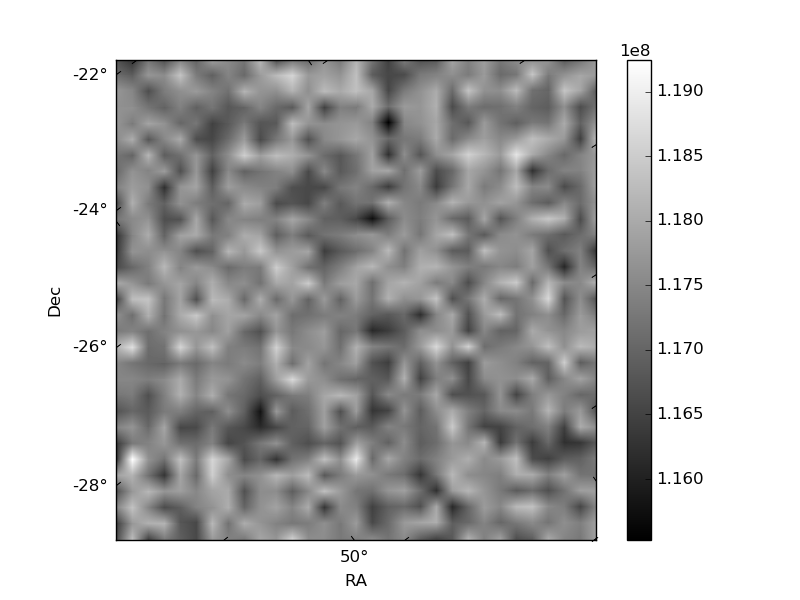
Histogram calculated using DETX and DETY for each event in the final _common_clean file
| Quadrant A | 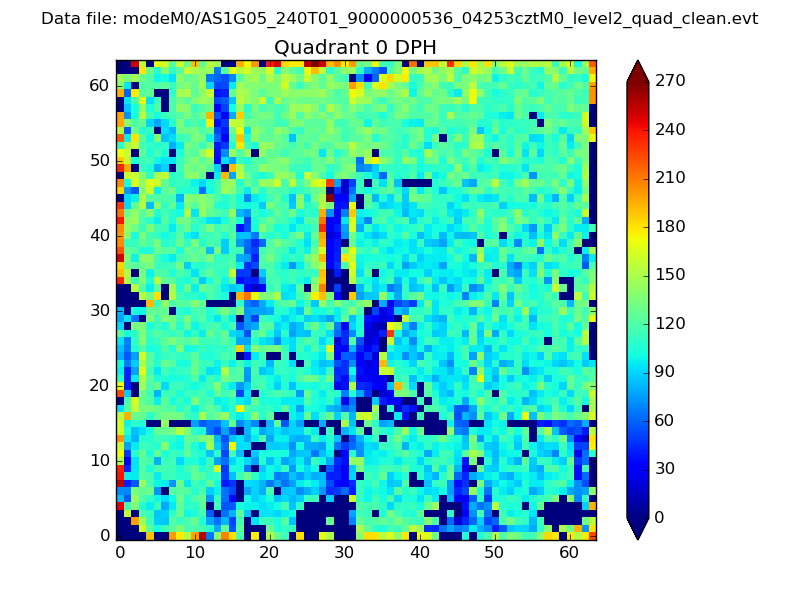 |
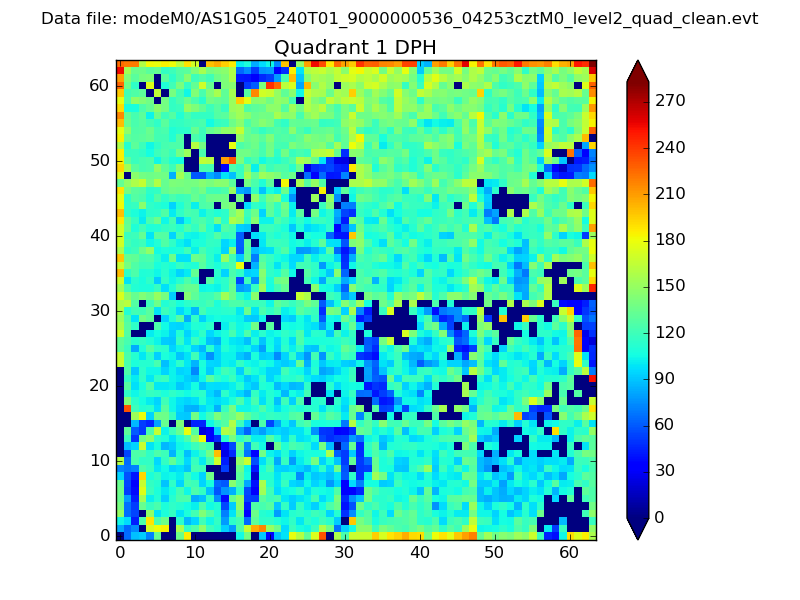 |
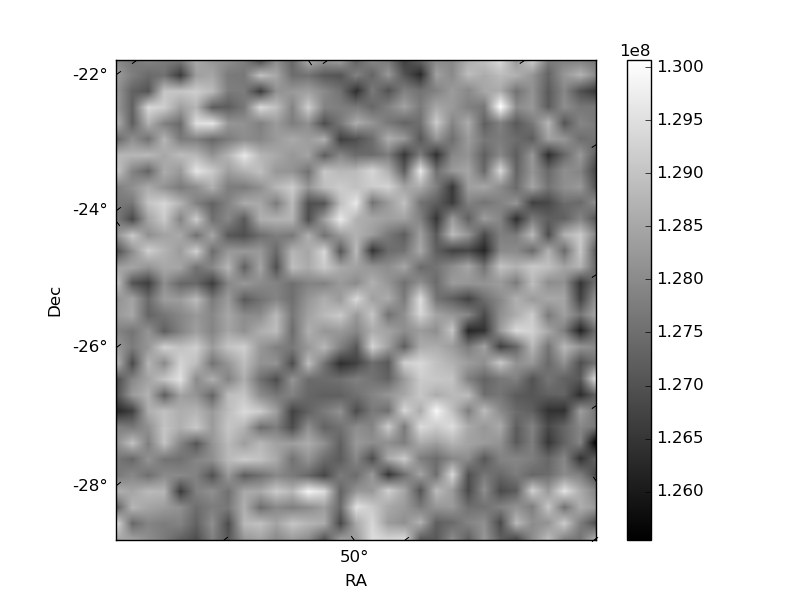
Quadrant B |
|---|---|---|---|
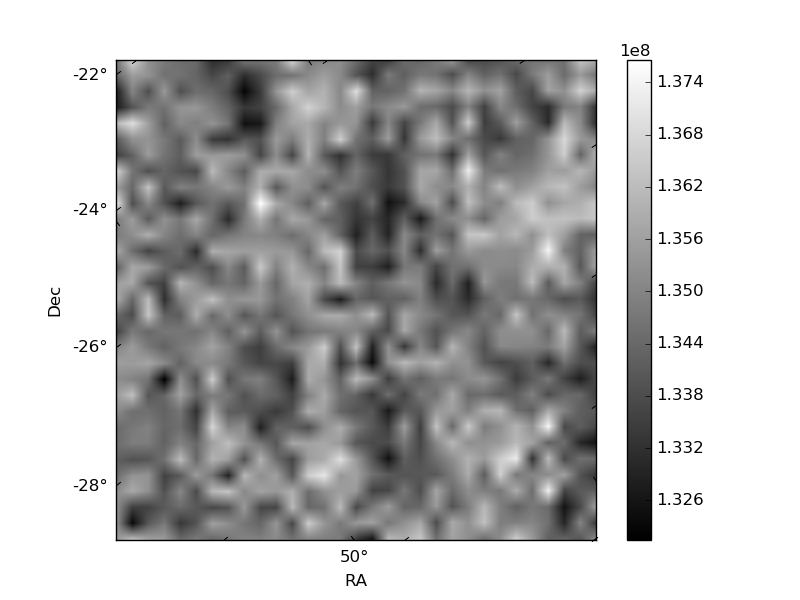
| Quadrant D | 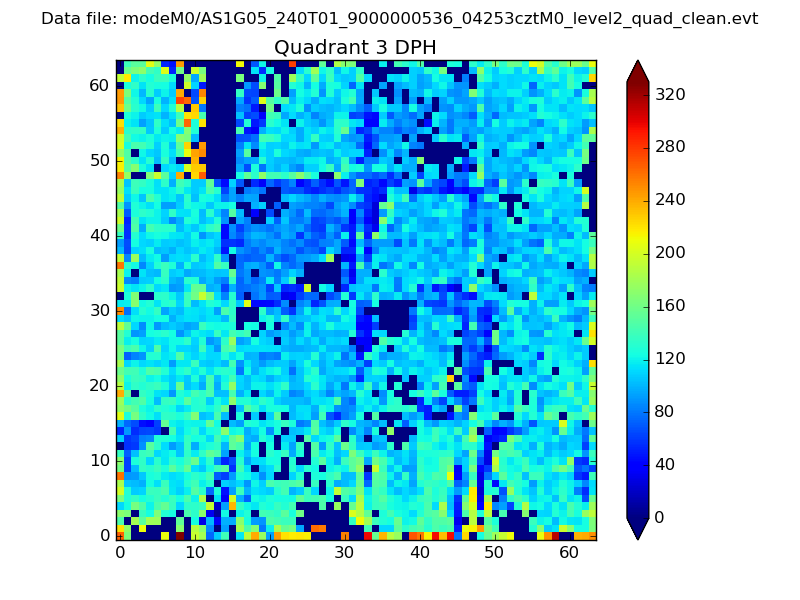 |
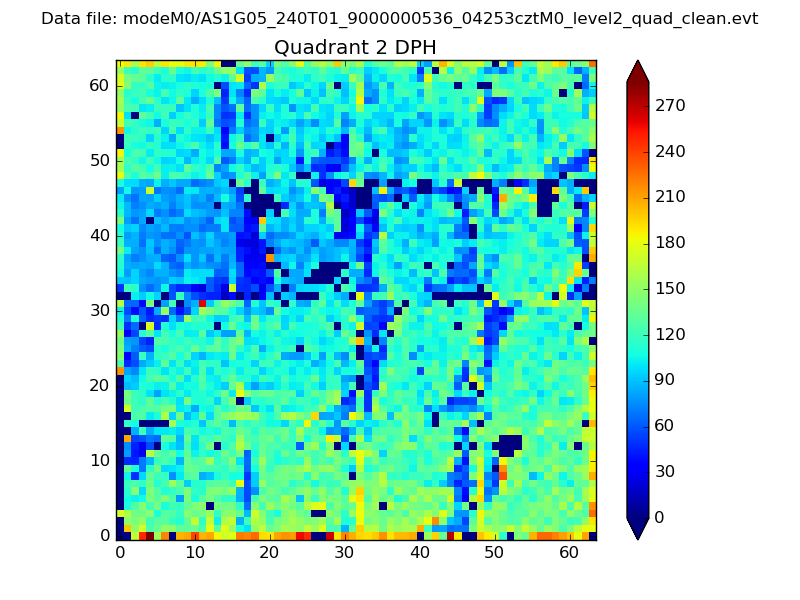 |
Quadrant C |
| Plot type | Count rate plots | Images |
|---|---|---|
| Comparison with Poisson distribution Blue bars denote a histogram of data divided into 1 sec bins. Red curve is a Poisson curve with rate = median count rate of data. |
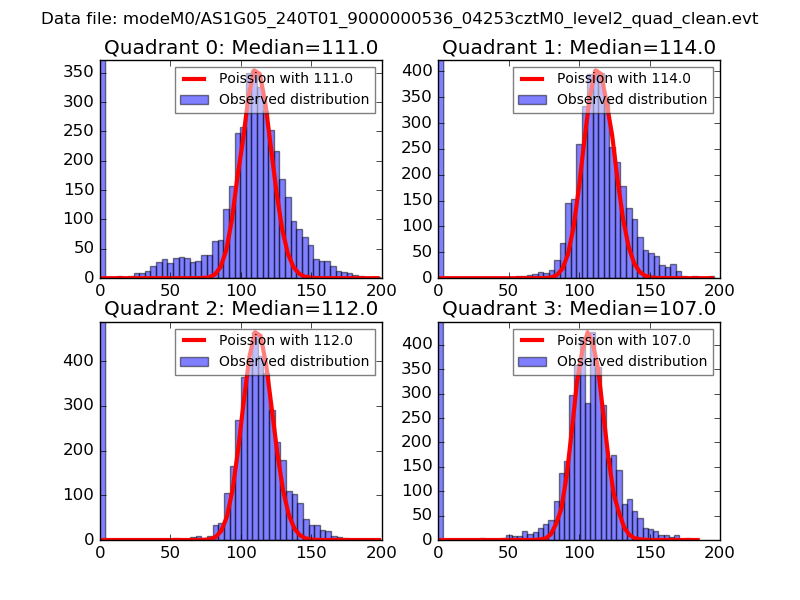 |
 |
| Quadrant-wise count rates Data is divided into 100 sec bins |
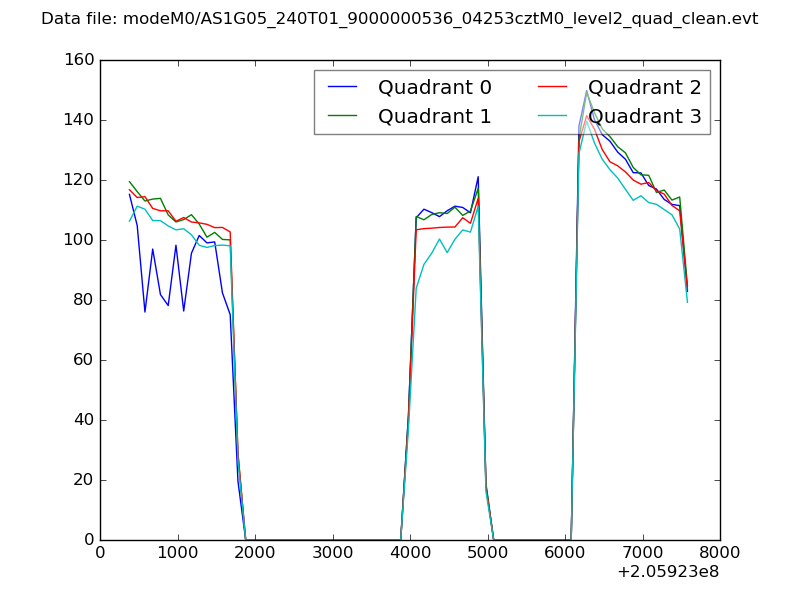 |
|
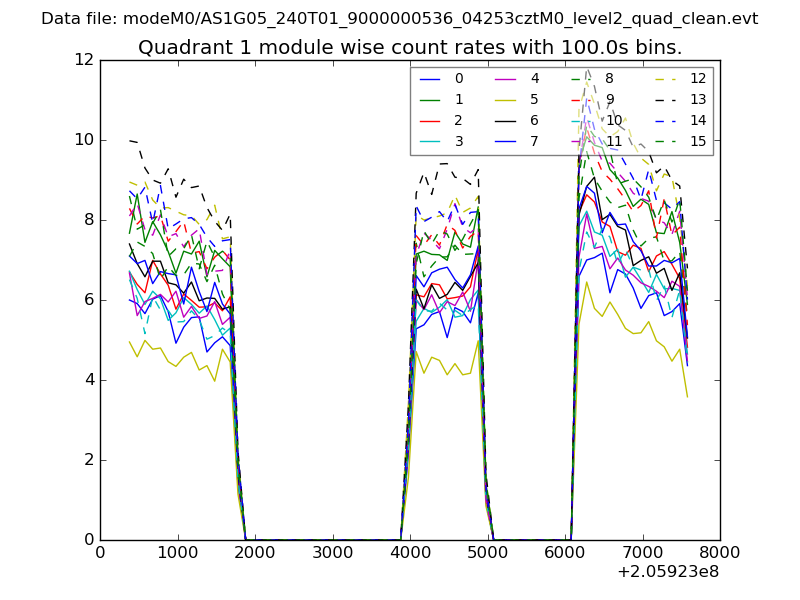
| Module-wise count rates for Quadrant A Data is divided into 100 sec bins |
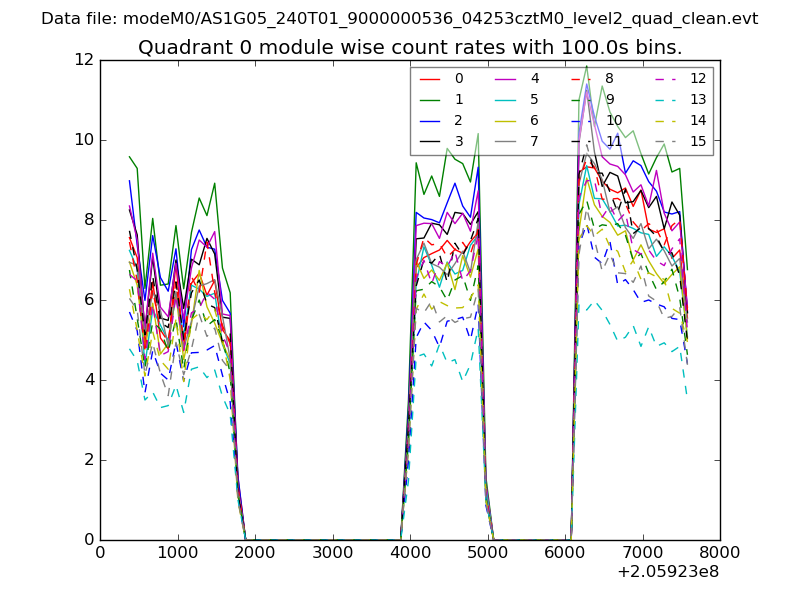 |
 |
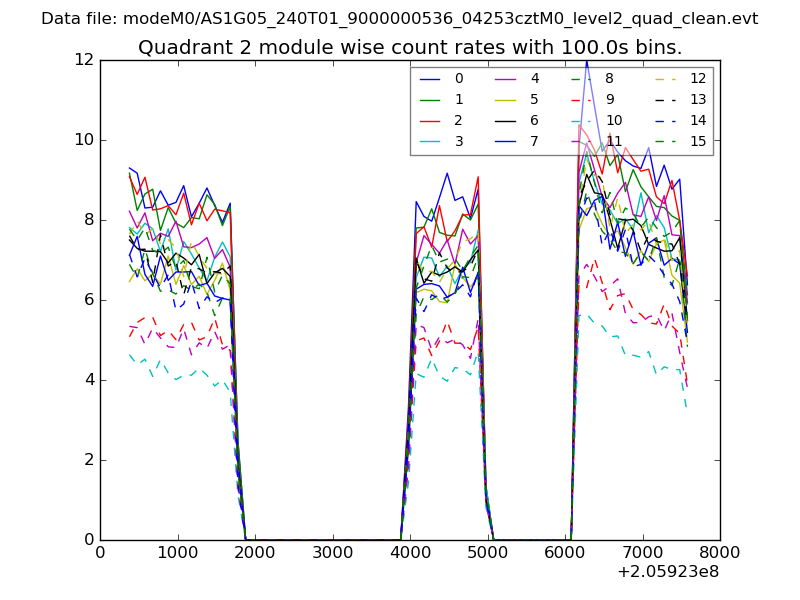
| Module-wise count rates for Quadrant B Data is divided into 100 sec bins |
 |
 |
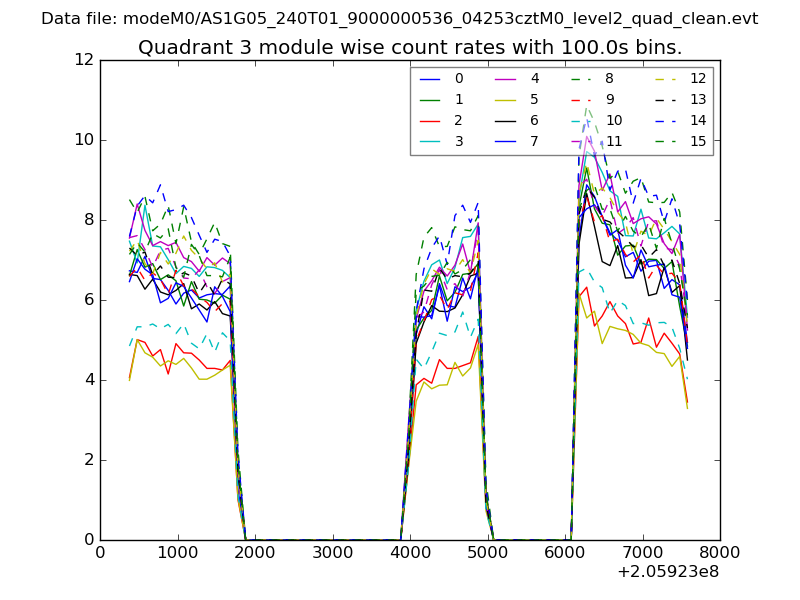
| Module-wise count rates for Quadrant C Data is divided into 100 sec bins |
 |
 |
| Module-wise count rates for Quadrant D Data is divided into 100 sec bins |
 |
 |
| Parameter | Plot |
|---|---|
| CZT HV Monitor | 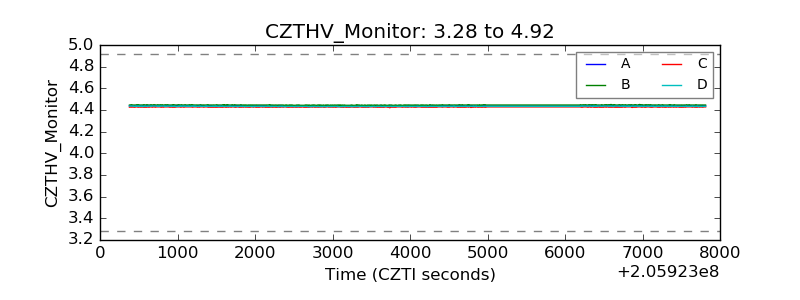 |
| D_VDD |  |
| Temperature 1 | 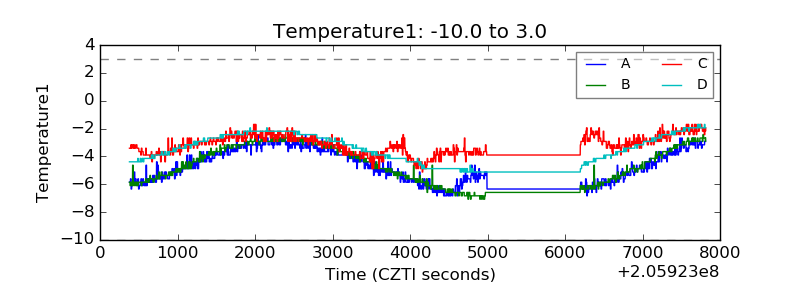 |
| Veto HV Monitor | 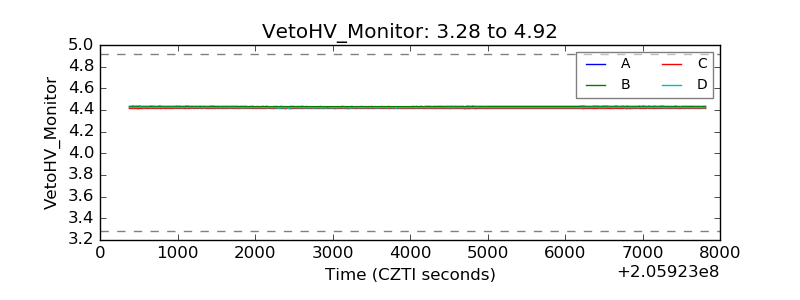 |
| Veto LLD | 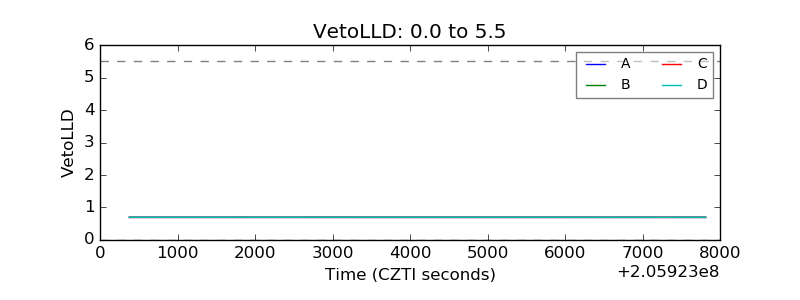 |
| Alpha Counter | 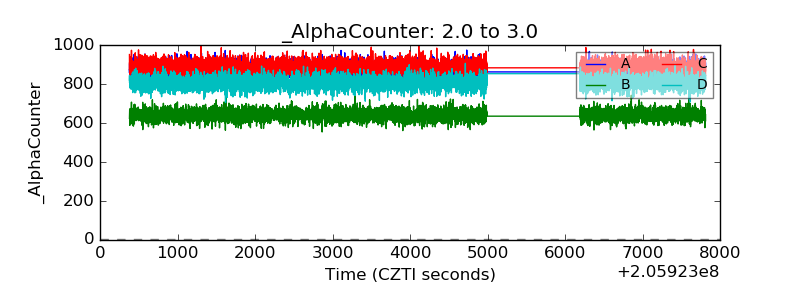 |
| _CPM_Rate | 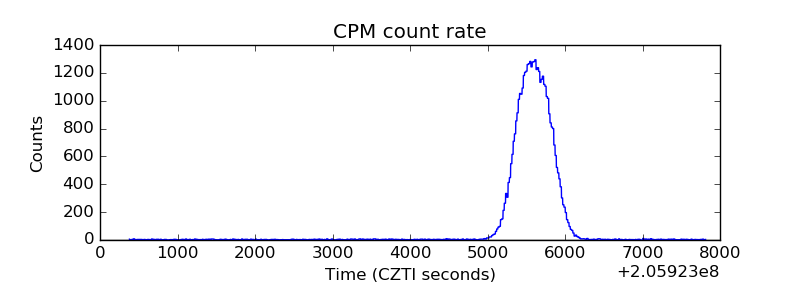 |
| CZT Counter | 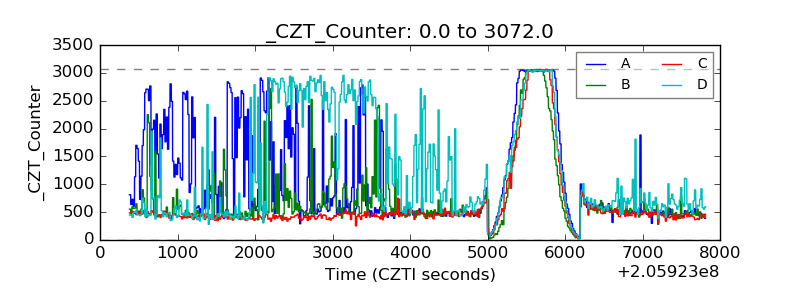 |
| +2.5 Volts monitor |  |
| +5 Volts monitor |  |
| _ROLL_ROT | 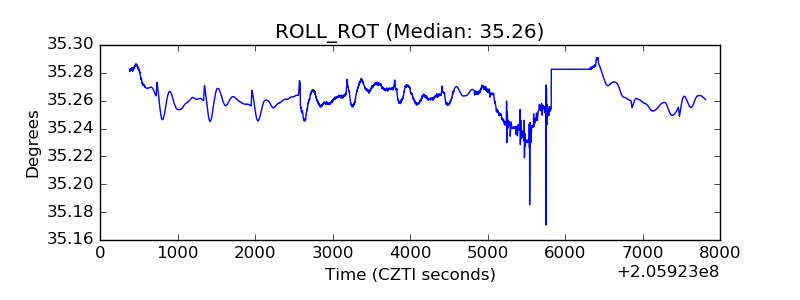 |
| _Roll_DEC | 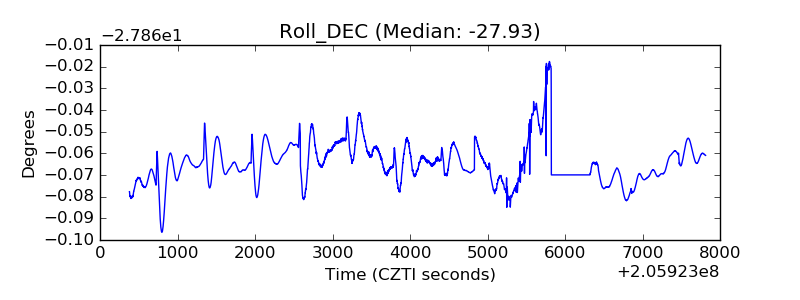 |
| _Roll_RA | 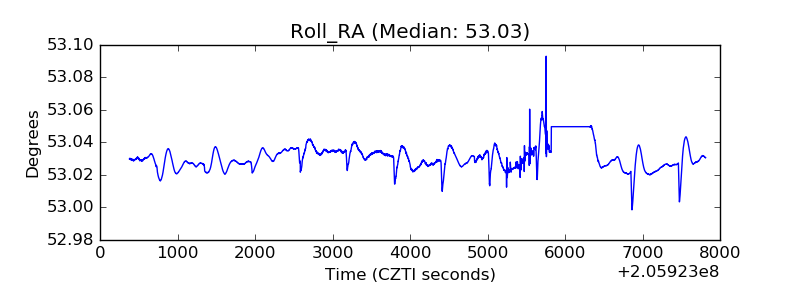 |
| Veto Counter | 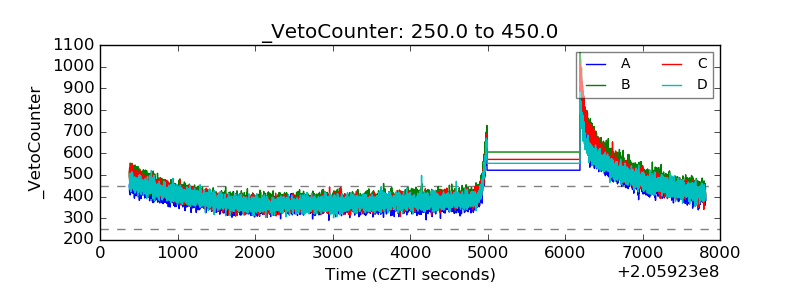 |