| Param | Original file | Final file |
|---|---|---|
| Filename | modeM0/AS1G05_240T01_9000000536_04254cztM0_level2.evt | modeM0/AS1G05_240T01_9000000536_04254cztM0_level2_quad_clean.evt |
| Size (bytes) | 474,724,800 | 73,474,560 |
| Size | 452.7 MB | 70.1 MB |
| Events in quadrant A | 3,230,923 | 452,706 |
| Events in quadrant B | 3,436,167 | 456,252 |
| Events in quadrant C | 3,023,930 | 441,159 |
| Events in quadrant D | 4,247,238 | 423,757 |
| Mode SS | |||
|---|---|---|---|
| Quadrant | BADHDUFLAG | Total packets | Discarded packets |
| A | 0 | 130 | 0 |
| B | 0 | 130 | 0 |
| C | 0 | 130 | 0 |
| D | 0 | 130 | 0 |
| Mode M9 | |||
|---|---|---|---|
| Quadrant | BADHDUFLAG | Total packets | Discarded packets |
| A | 0 | 13 | 0 |
| B | 0 | 13 | 0 |
| C | 0 | 13 | 0 |
| D | 0 | 13 | 0 |
| Mode M0 | |||
|---|---|---|---|
| Quadrant | BADHDUFLAG | Total packets | Discarded packets |
| A | 0 | 13496 | 2 |
| B | 0 | 14025 | 1 |
| C | 0 | 13236 | 1 |
| D | 0 | 17057 | 1 |
| Quadrant | Total seconds | Saturated seconds | Saturation percentage |
|---|---|---|---|
| A | 6468 | 54 | 0.834879% |
| B | 6468 | 71 | 1.097712% |
| C | 6468 | 23 | 0.355597% |
| D | 6468 | 66 | 1.020408% |
Noise dominated data is calculated using 1-second bins in cleaned event files. If a bin has >2000 counts, and if more than 50% of those come from <1% of pixels, then it is considered to be noise-dominated and hence unusable.
| Quadrant | # 1 sec bins | Bins with >0 counts | Bins with >2000 counts | High rate bins dominated by noise | Noise dominated (total time) | Noise dominated (detector-on time) | Marked lightcurve |
|---|---|---|---|---|---|---|---|
| A | 7743 | 6469 | 1 | 1 | 0.01% | 0.02% | 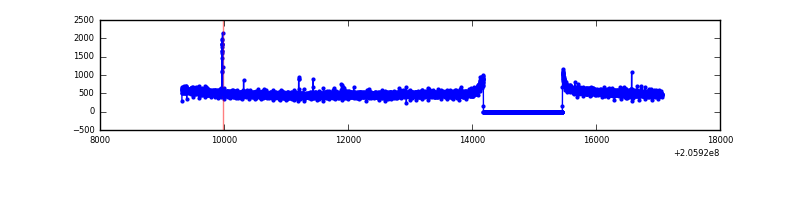 |
| B | 7743 | 6469 | 24 | 24 | 0.31% | 0.37% | 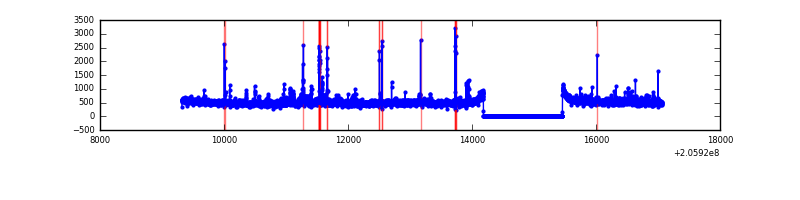 |
| C | 7743 | 6469 | 0 | 0 | 0.00% | 0.00% | 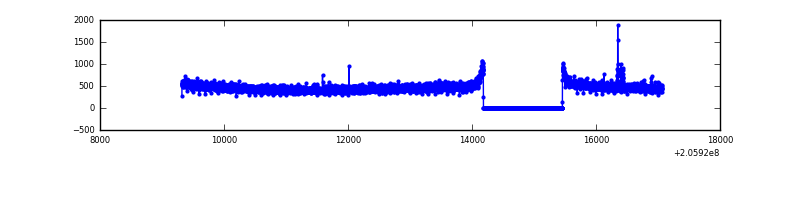 |
| D | 7743 | 6469 | 33 | 33 | 0.43% | 0.51% | 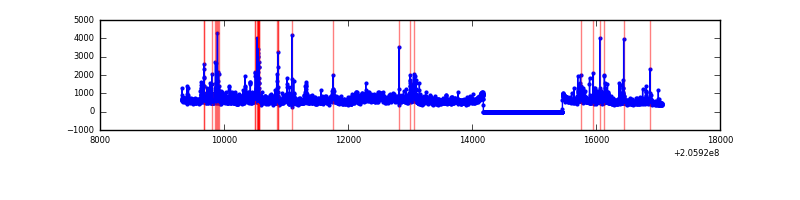 |
Top three noisy pixels from each quadrant. If the there are fewer than three noisy pixels in the level2.evt file, extra rows are filled as -1
| Pixel properties | Quadrant properties | ||||||
|---|---|---|---|---|---|---|---|
| Quadrant | DetID | PixID | Counts | Sigma | Mean | Median | Sigma |
| A | 0 | 149 | 63470 | 383.03 | 810 | 797 | 163.6 |
| A | 14 | 111 | 19180 | 112.35 | 810 | 797 | 163.6 |
| A | 0 | 226 | 15139 | 87.65 | 810 | 797 | 163.6 |
| B | 3 | 0 | 89000 | 572.86 | 807 | 792 | 154.0 |
| B | 8 | 3 | 54280 | 347.38 | 807 | 792 | 154.0 |
| B | 15 | 204 | 36482 | 231.79 | 807 | 792 | 154.0 |
| C | 9 | 144 | 13580 | 71.73 | 769 | 773 | 178.5 |
| C | 13 | 61 | 6441 | 31.74 | 769 | 773 | 178.5 |
| C | 10 | 65 | 4053 | 18.37 | 769 | 773 | 178.5 |
| D | 11 | 132 | 747876 | 4051.75 | 777 | 759 | 184.4 |
| D | 13 | 239 | 182364 | 984.88 | 777 | 759 | 184.4 |
| D | 2 | 136 | 123566 | 666.0 | 777 | 759 | 184.4 |
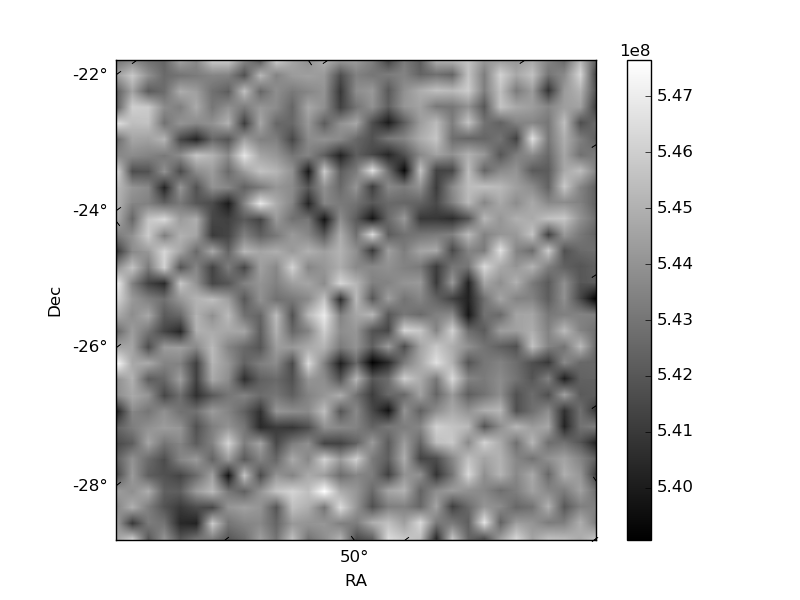
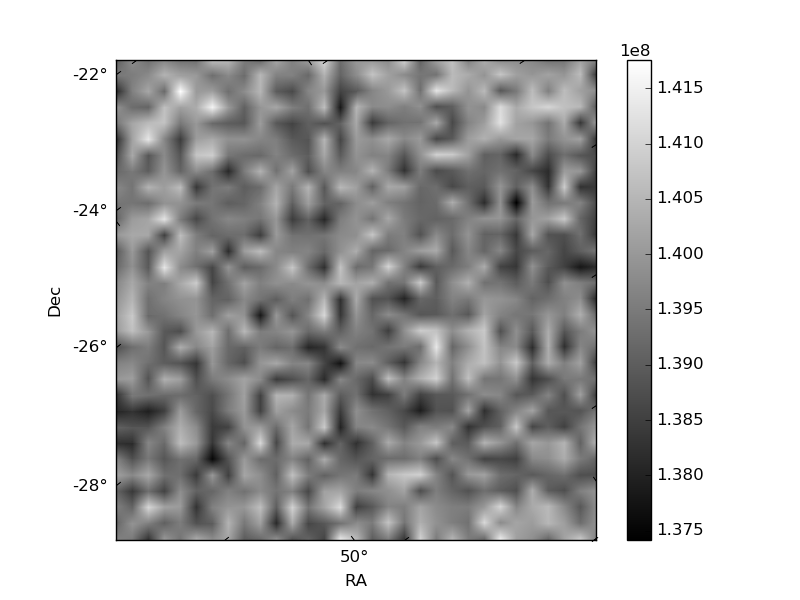
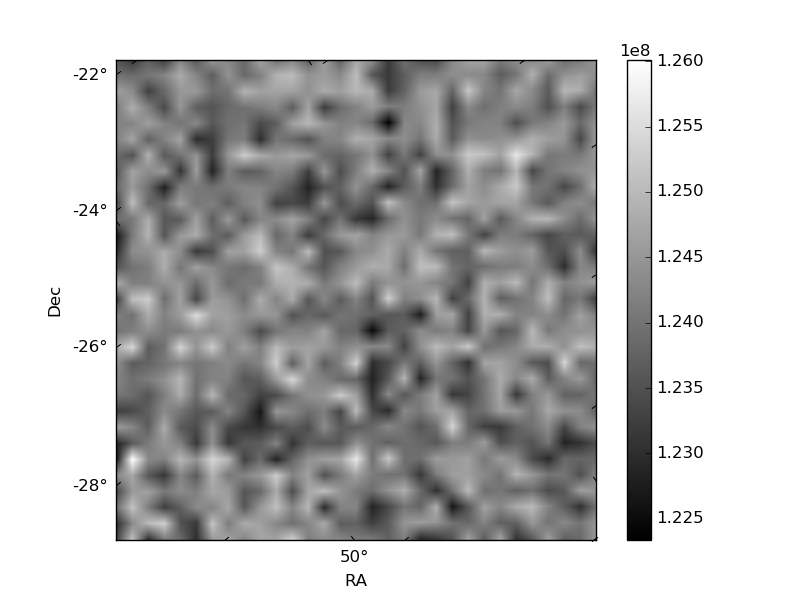
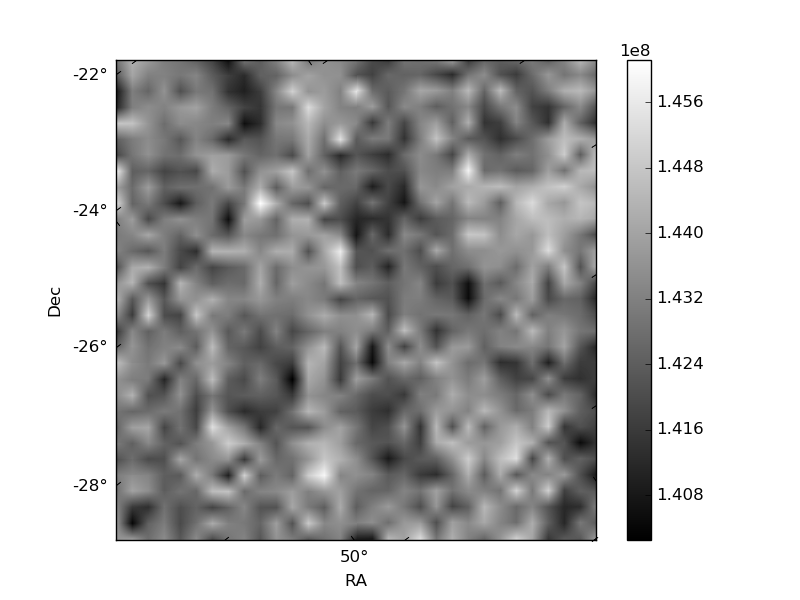
Histogram calculated using DETX and DETY for each event in the final _common_clean file
| Quadrant A | 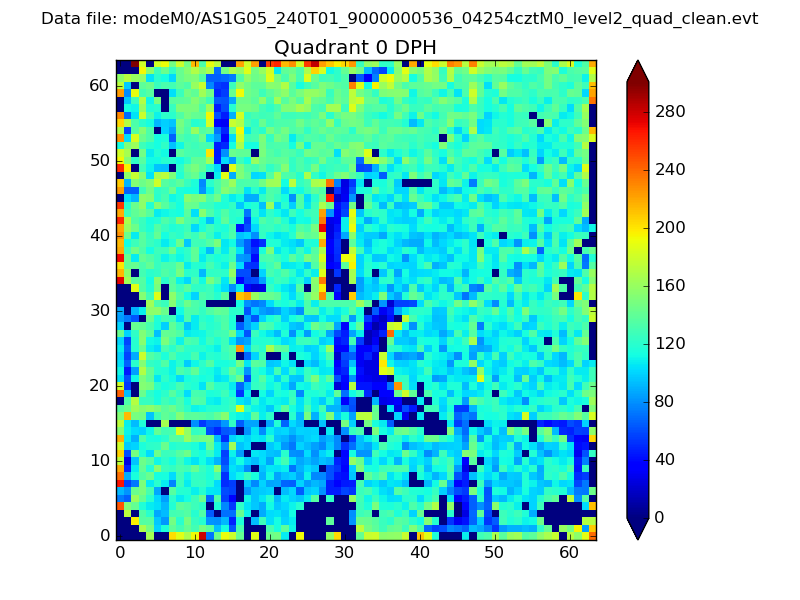 |
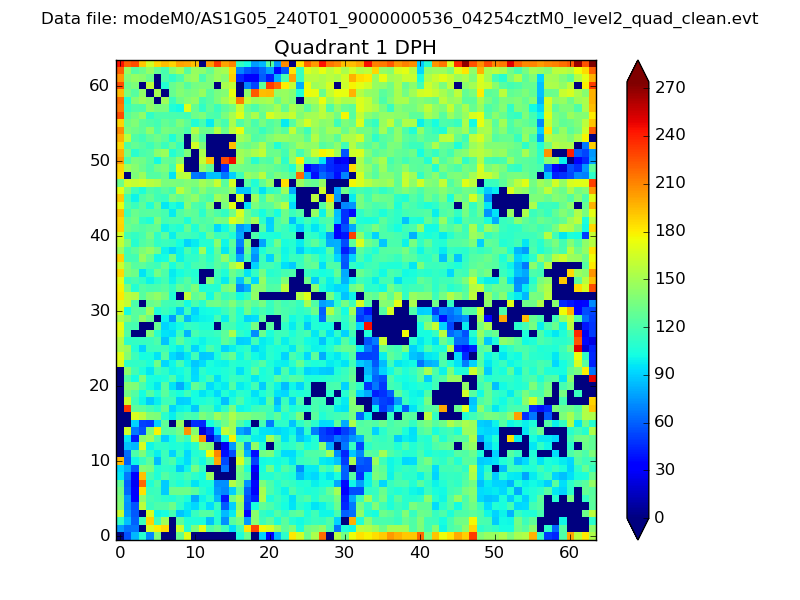 |
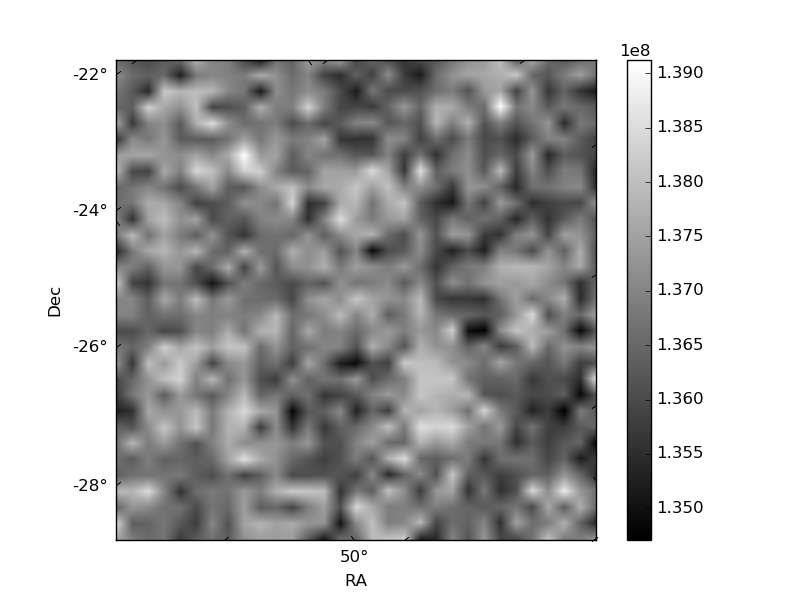
Quadrant B |
|---|---|---|---|
| Quadrant D | 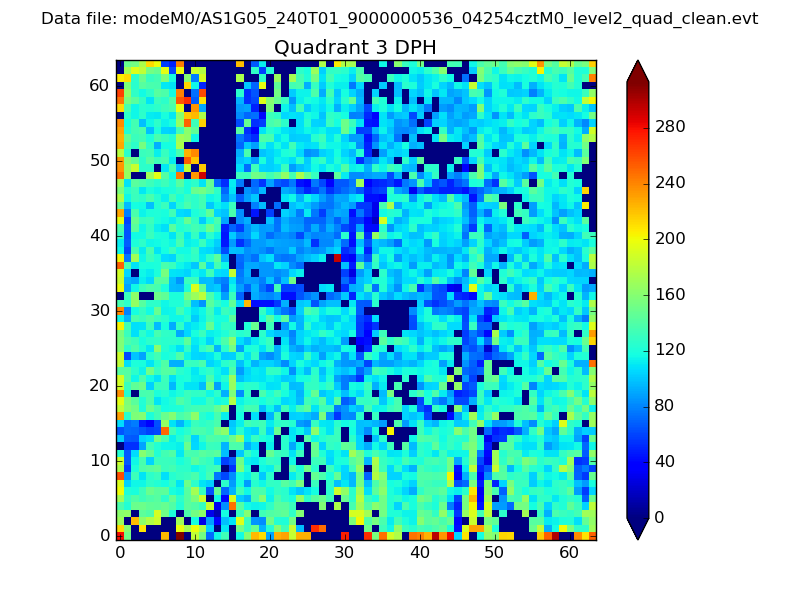 |
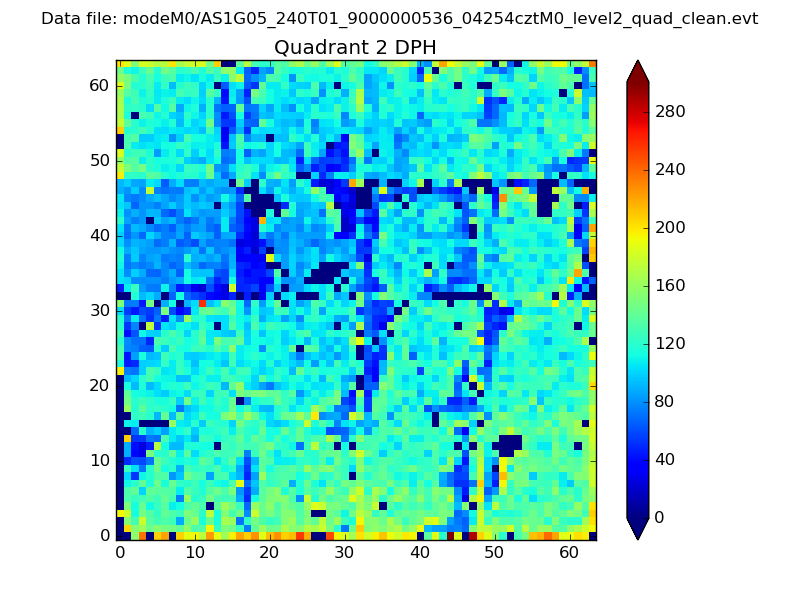 |
Quadrant C |
| Plot type | Count rate plots | Images |
|---|---|---|
| Comparison with Poisson distribution Blue bars denote a histogram of data divided into 1 sec bins. Red curve is a Poisson curve with rate = median count rate of data. |
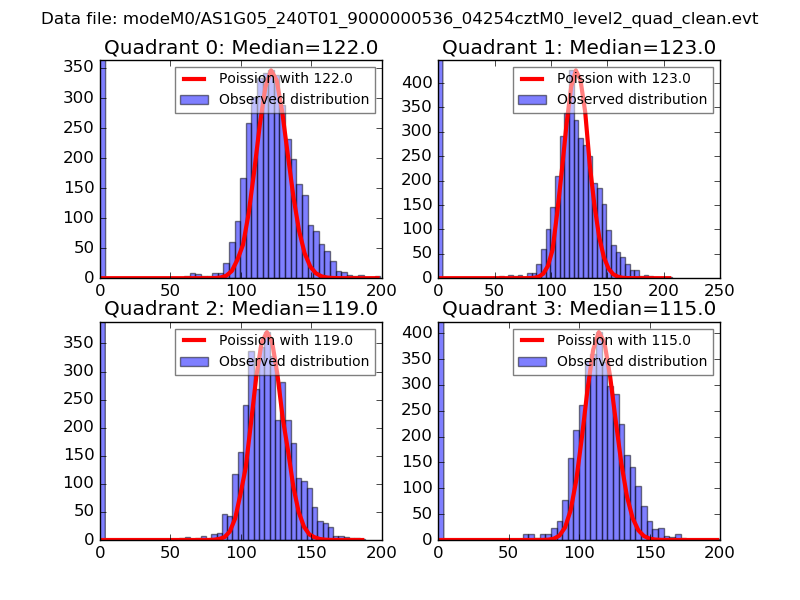 |
 |
| Quadrant-wise count rates Data is divided into 100 sec bins |
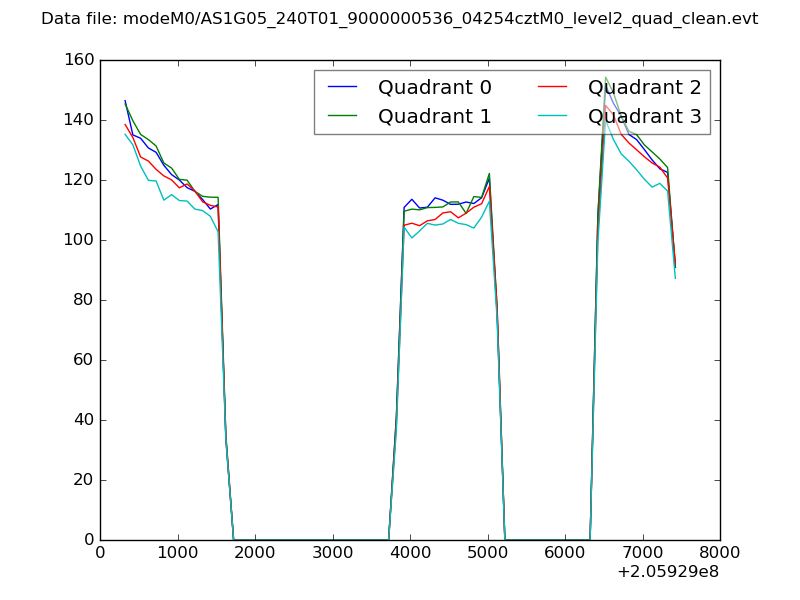 |
|
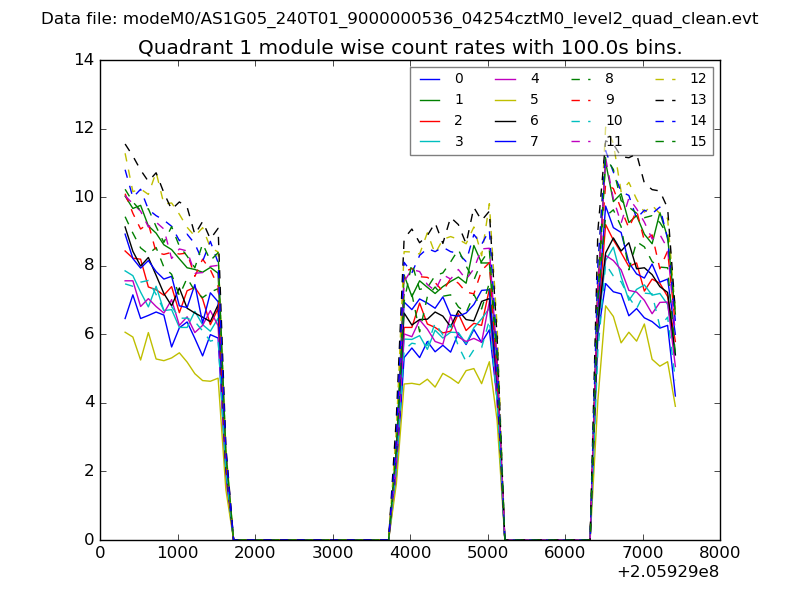
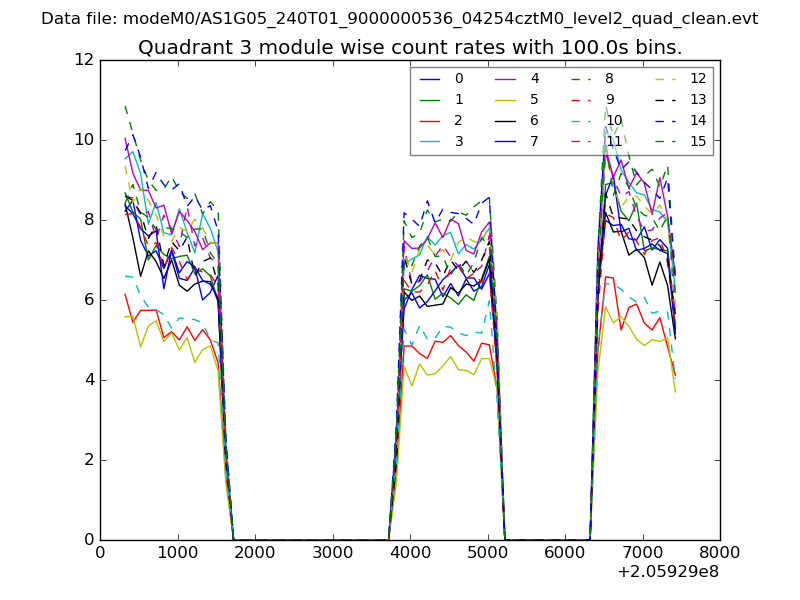
| Module-wise count rates for Quadrant A Data is divided into 100 sec bins |
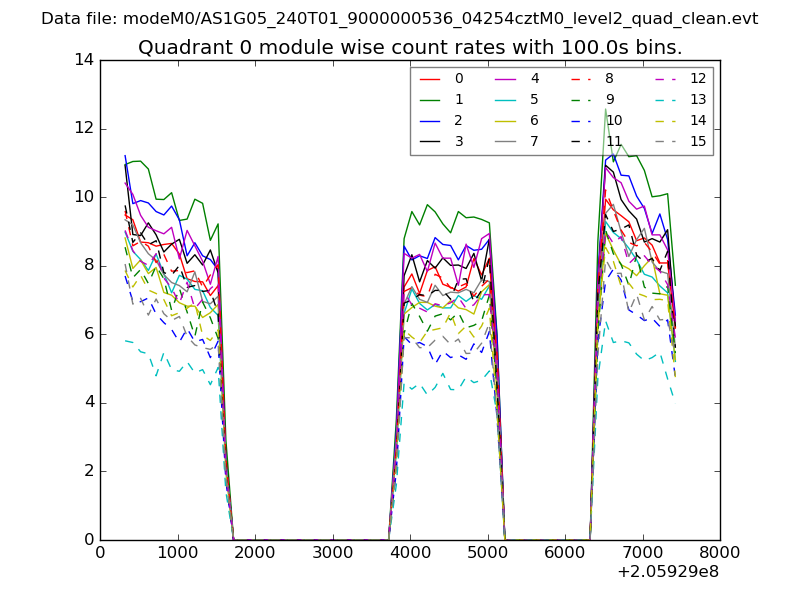 |
 |
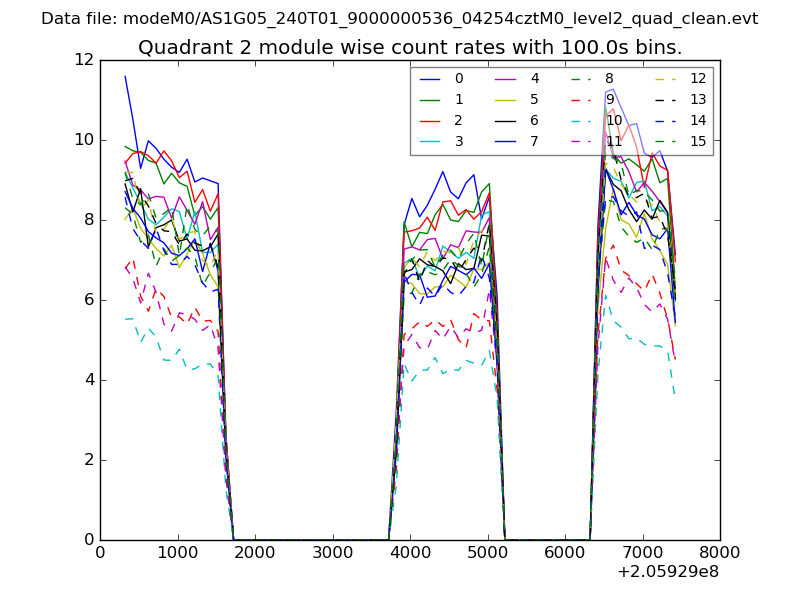
| Module-wise count rates for Quadrant B Data is divided into 100 sec bins |
 |
 |
| Module-wise count rates for Quadrant C Data is divided into 100 sec bins |
 |
 |
| Module-wise count rates for Quadrant D Data is divided into 100 sec bins |
 |
 |
| Parameter | Plot |
|---|---|
| CZT HV Monitor | 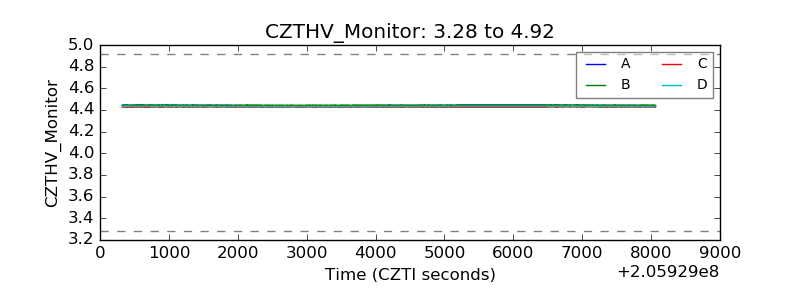 |
| D_VDD | 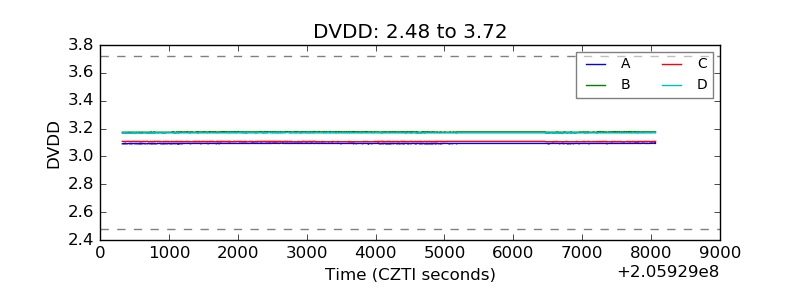 |
| Temperature 1 |  |
| Veto HV Monitor | 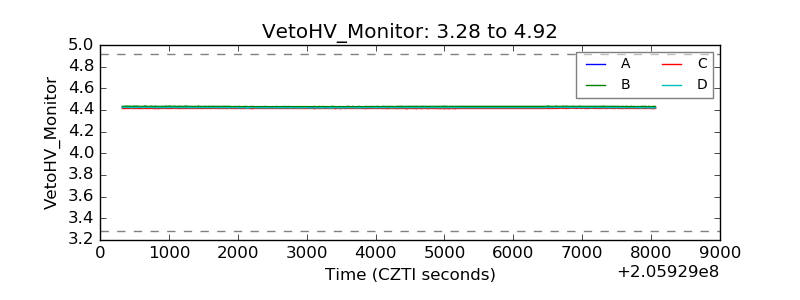 |
| Veto LLD | 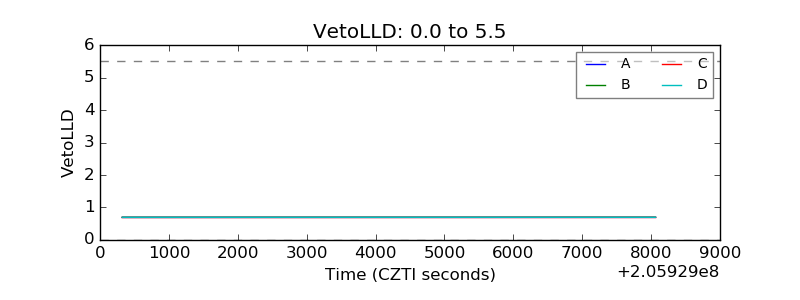 |
| Alpha Counter | 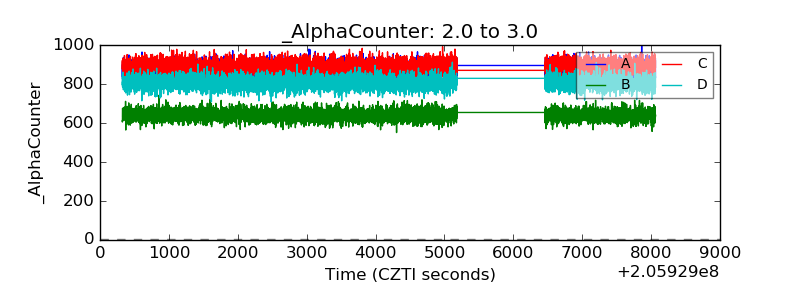 |
| _CPM_Rate |  |
| CZT Counter | 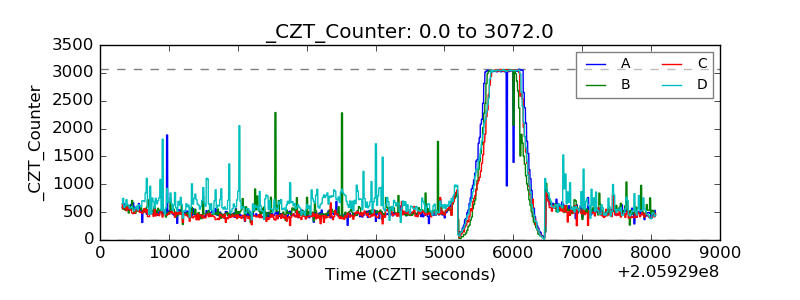 |
| +2.5 Volts monitor |  |
| +5 Volts monitor |  |
| _ROLL_ROT | 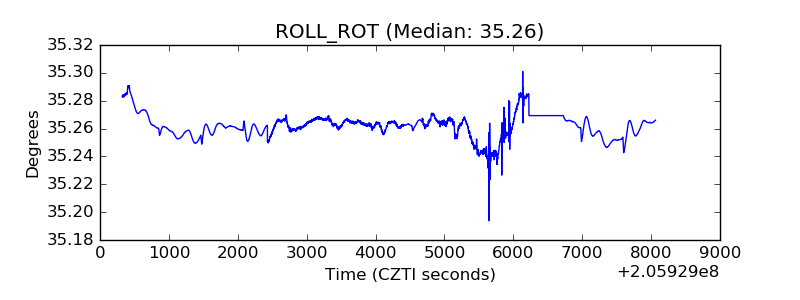 |
| _Roll_DEC | 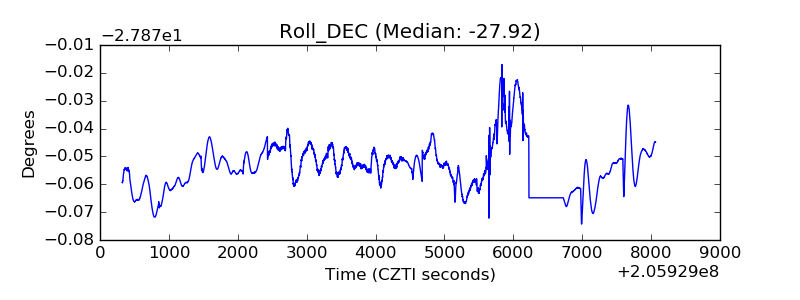 |
| _Roll_RA | 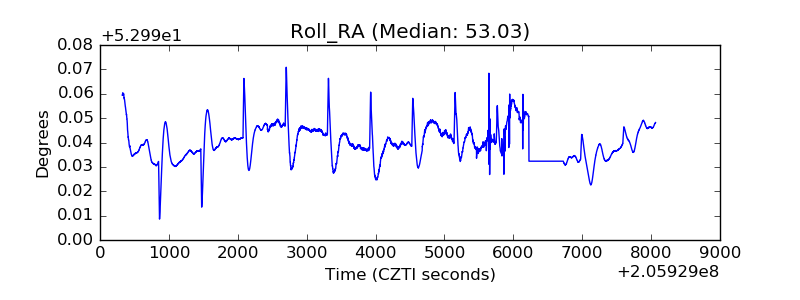 |
| Veto Counter | 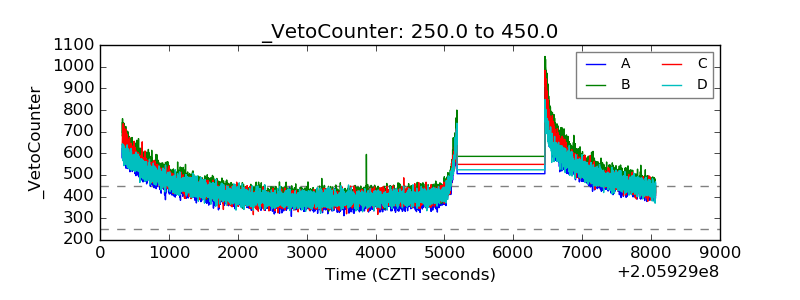 |