| Param | Original file | Final file |
|---|---|---|
| Filename | modeM0/AS1G05_240T01_9000000536_04255cztM0_level2.evt | modeM0/AS1G05_240T01_9000000536_04255cztM0_level2_quad_clean.evt |
| Size (bytes) | 451,321,920 | 62,856,000 |
| Size | 430.4 MB | 59.9 MB |
| Events in quadrant A | 3,181,472 | 375,697 |
| Events in quadrant B | 3,296,920 | 380,311 |
| Events in quadrant C | 2,983,616 | 365,333 |
| Events in quadrant D | 3,786,175 | 349,916 |
| Mode SS | |||
|---|---|---|---|
| Quadrant | BADHDUFLAG | Total packets | Discarded packets |
| A | 0 | 126 | 0 |
| B | 0 | 126 | 0 |
| C | 0 | 126 | 0 |
| D | 0 | 126 | 0 |
| Mode M9 | |||
|---|---|---|---|
| Quadrant | BADHDUFLAG | Total packets | Discarded packets |
| A | 0 | 13 | 0 |
| B | 0 | 13 | 0 |
| C | 0 | 13 | 0 |
| D | 0 | 13 | 0 |
| Mode M0 | |||
|---|---|---|---|
| Quadrant | BADHDUFLAG | Total packets | Discarded packets |
| A | 0 | 13092 | 3 |
| B | 0 | 13328 | 2 |
| C | 0 | 12841 | 2 |
| D | 0 | 15210 | 2 |
| Quadrant | Total seconds | Saturated seconds | Saturation percentage |
|---|---|---|---|
| A | 6184 | 84 | 1.358344% |
| B | 6184 | 81 | 1.309832% |
| C | 6184 | 67 | 1.083441% |
| D | 6184 | 101 | 1.633247% |
Noise dominated data is calculated using 1-second bins in cleaned event files. If a bin has >2000 counts, and if more than 50% of those come from <1% of pixels, then it is considered to be noise-dominated and hence unusable.
| Quadrant | # 1 sec bins | Bins with >0 counts | Bins with >2000 counts | High rate bins dominated by noise | Noise dominated (total time) | Noise dominated (detector-on time) | Marked lightcurve |
|---|---|---|---|---|---|---|---|
| A | 7509 | 6186 | 3 | 3 | 0.04% | 0.05% |  |
| B | 7509 | 6186 | 2 | 2 | 0.03% | 0.03% |  |
| C | 7509 | 6186 | 16 | 16 | 0.21% | 0.26% | 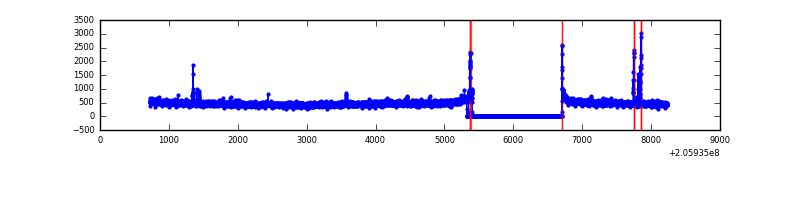 |
| D | 7509 | 6186 | 44 | 44 | 0.59% | 0.71% |  |
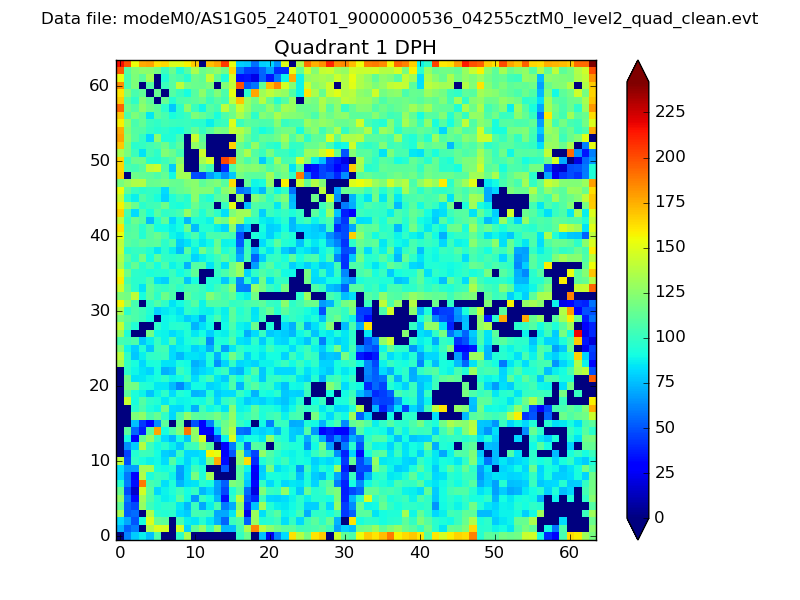
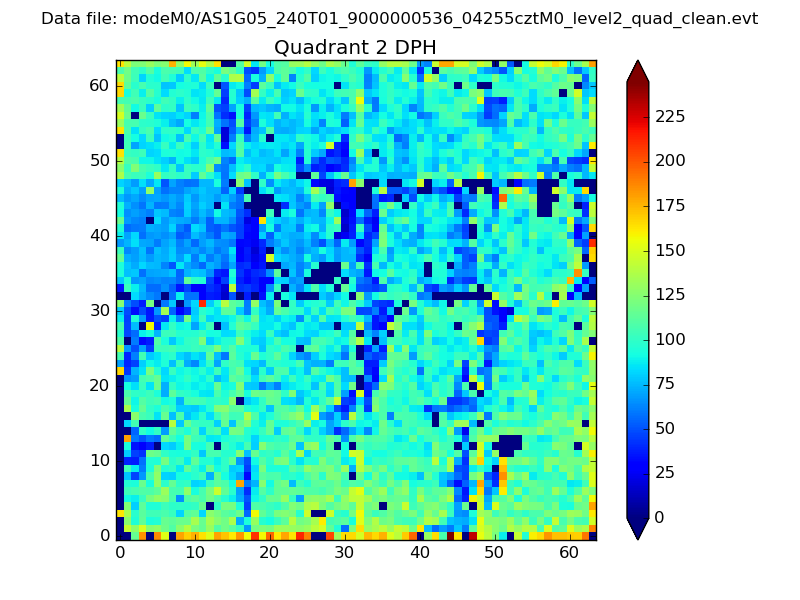
Top three noisy pixels from each quadrant. If the there are fewer than three noisy pixels in the level2.evt file, extra rows are filled as -1
| Pixel properties | Quadrant properties | ||||||
|---|---|---|---|---|---|---|---|
| Quadrant | DetID | PixID | Counts | Sigma | Mean | Median | Sigma |
| A | 0 | 50 | 76905 | 485.26 | 781 | 767 | 156.9 |
| A | 0 | 149 | 66882 | 421.38 | 781 | 767 | 156.9 |
| A | 0 | 226 | 15032 | 90.92 | 781 | 767 | 156.9 |
| B | 3 | 0 | 84824 | 561.73 | 783 | 766 | 149.6 |
| B | 15 | 204 | 61790 | 407.8 | 783 | 766 | 149.6 |
| B | 14 | 167 | 28206 | 183.37 | 783 | 766 | 149.6 |
| C | 9 | 144 | 81838 | 474.13 | 739 | 745 | 171.0 |
| C | 7 | 174 | 11717 | 64.15 | 739 | 745 | 171.0 |
| C | 13 | 61 | 6118 | 31.41 | 739 | 745 | 171.0 |
| D | 11 | 132 | 498265 | 2786.65 | 746 | 725 | 178.5 |
| D | 13 | 239 | 139819 | 779.05 | 746 | 725 | 178.5 |
| D | 1 | 52 | 108955 | 606.18 | 746 | 725 | 178.5 |
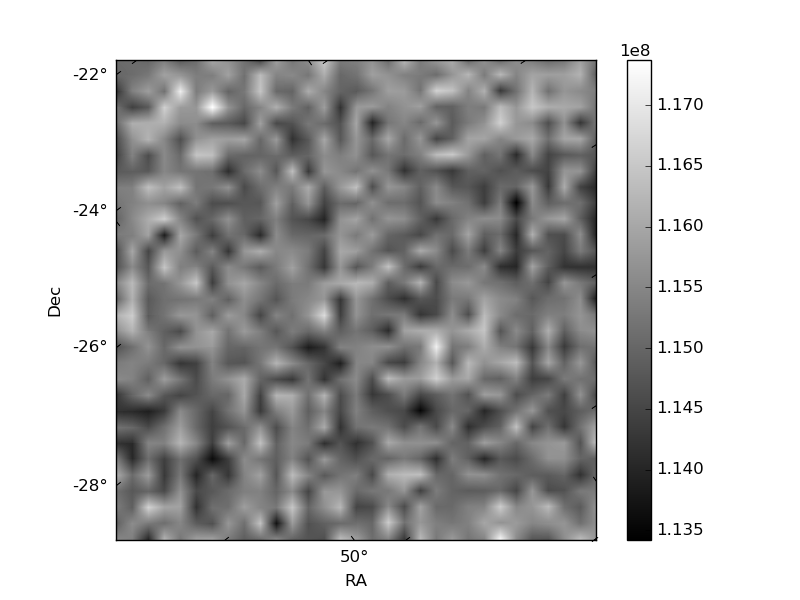
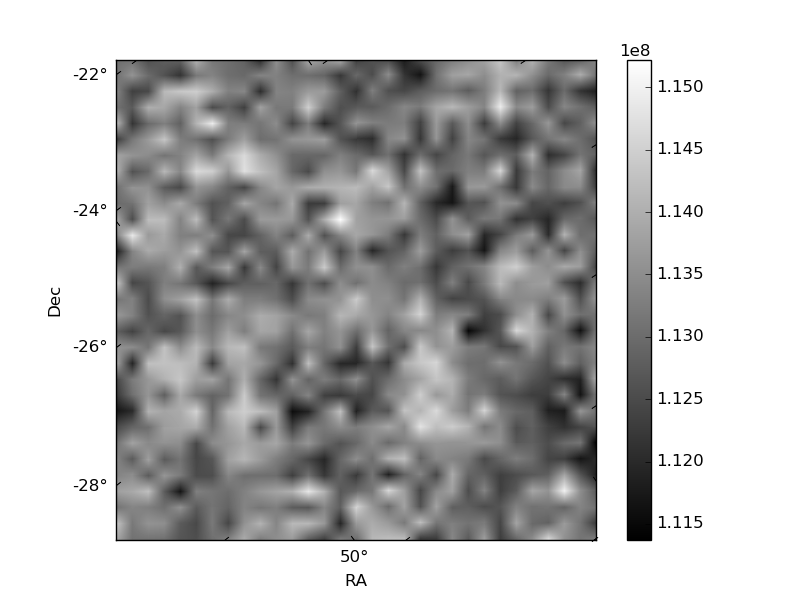
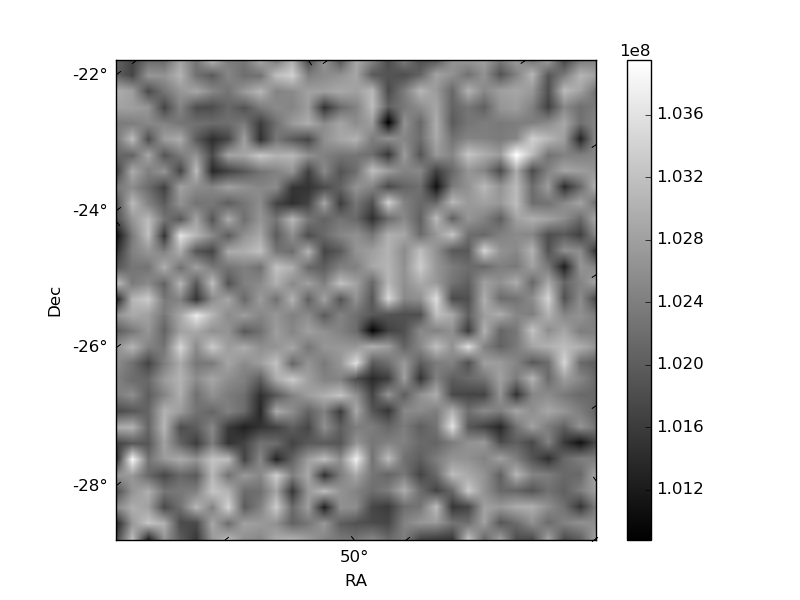
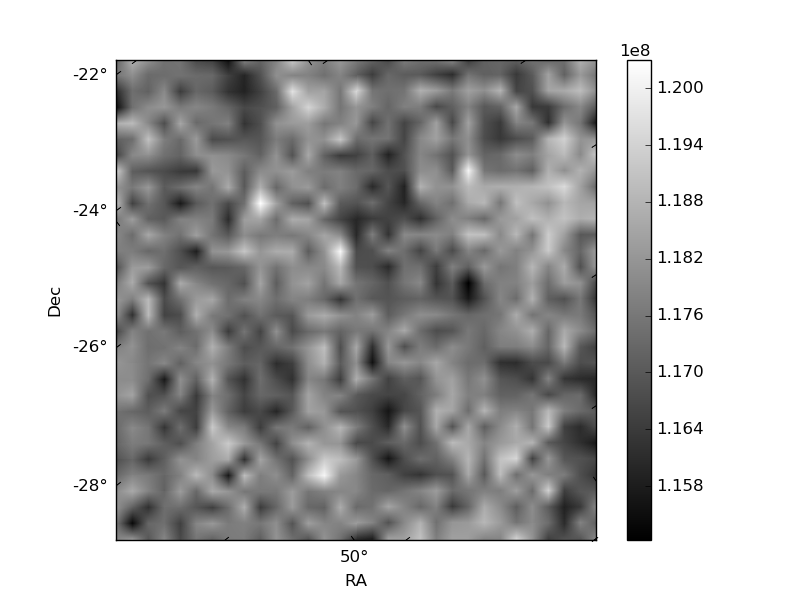
Histogram calculated using DETX and DETY for each event in the final _common_clean file
| Quadrant A | 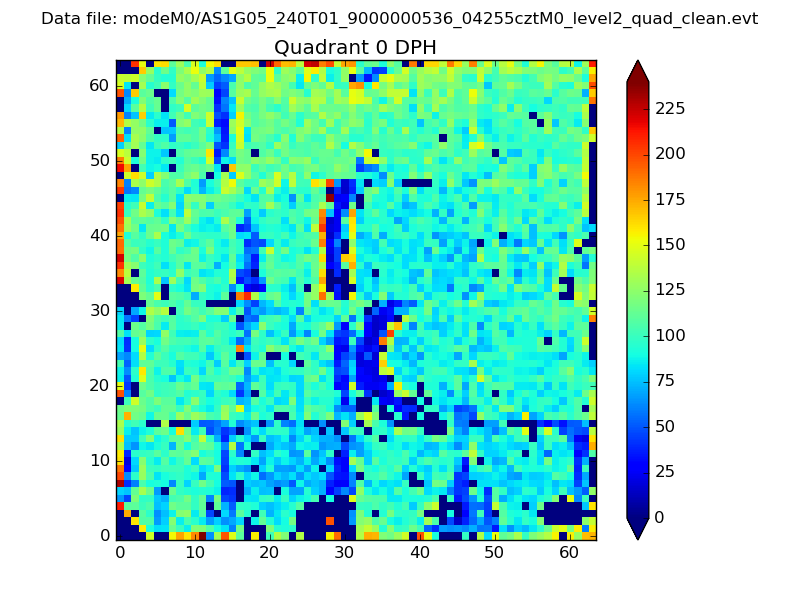 |
 |
Quadrant B |
|---|---|---|---|
| Quadrant D |  |
 |
Quadrant C |
| Plot type | Count rate plots | Images |
|---|---|---|
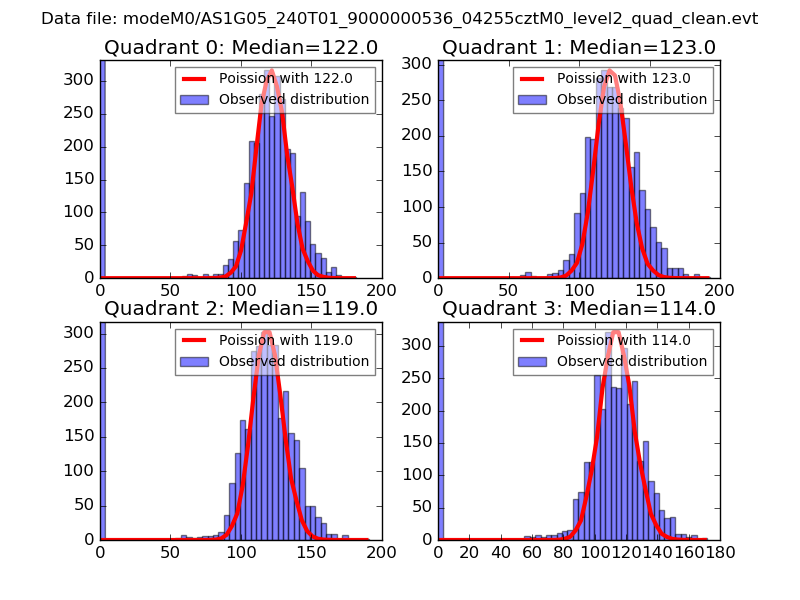
| Comparison with Poisson distribution Blue bars denote a histogram of data divided into 1 sec bins. Red curve is a Poisson curve with rate = median count rate of data. |
 |
 |
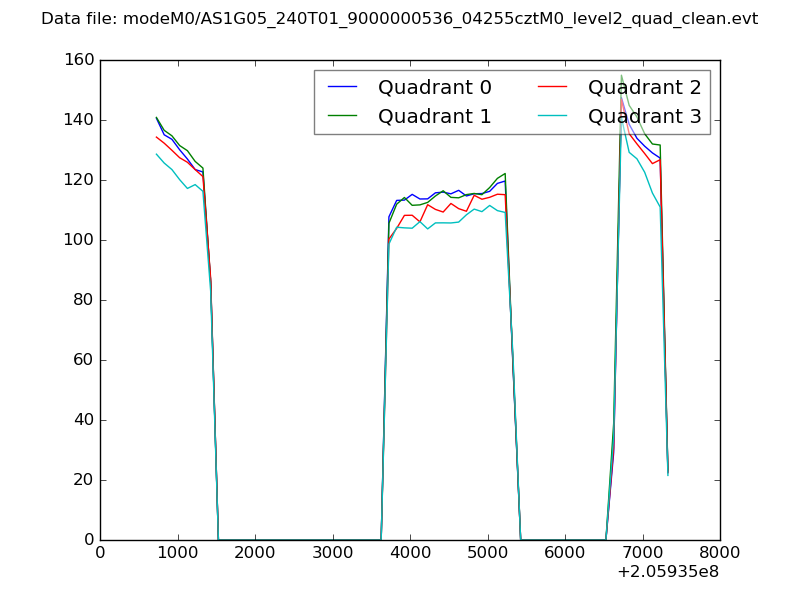
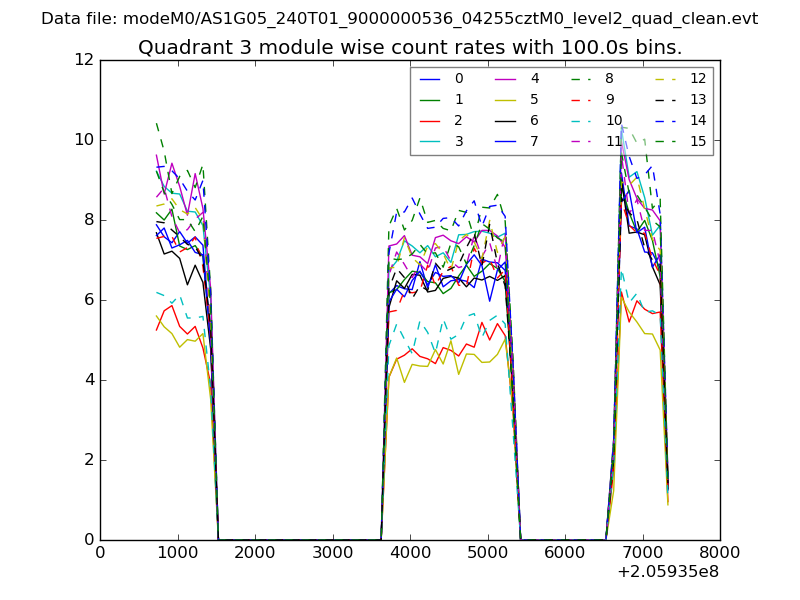
| Quadrant-wise count rates Data is divided into 100 sec bins |
 |
|
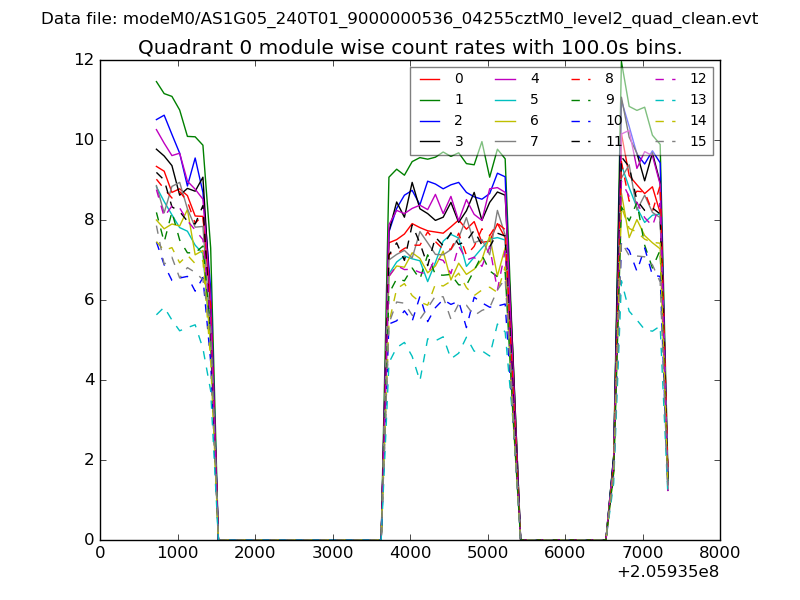
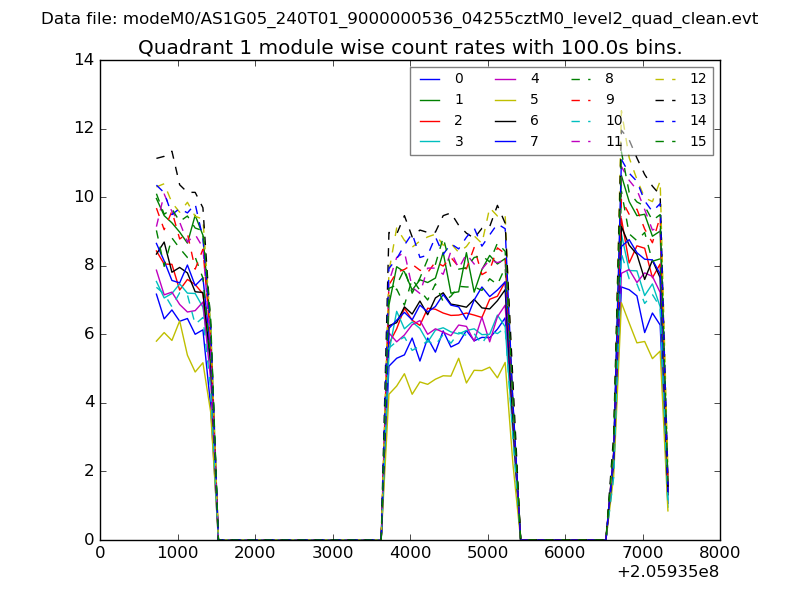
| Module-wise count rates for Quadrant A Data is divided into 100 sec bins |
 |
 |
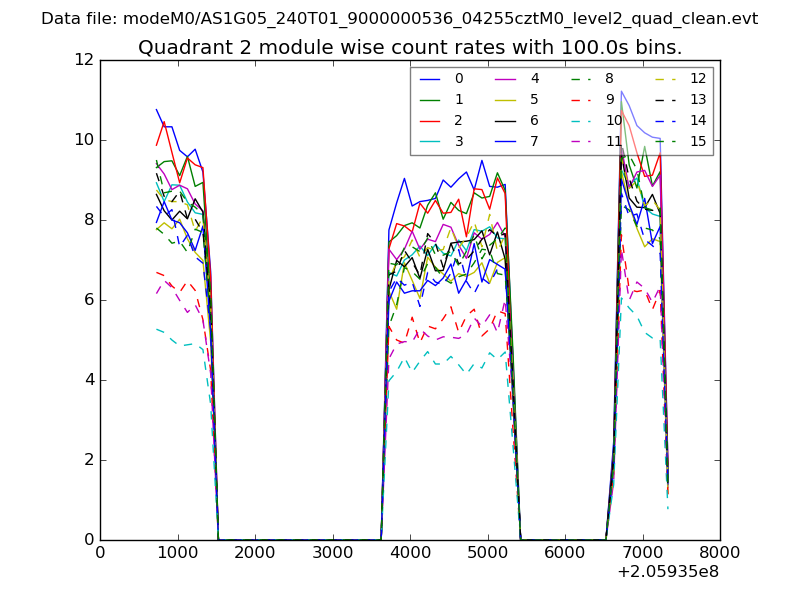
| Module-wise count rates for Quadrant B Data is divided into 100 sec bins |
 |
 |
| Module-wise count rates for Quadrant C Data is divided into 100 sec bins |
 |
 |
| Module-wise count rates for Quadrant D Data is divided into 100 sec bins |
 |
 |
| Parameter | Plot |
|---|---|
| CZT HV Monitor | 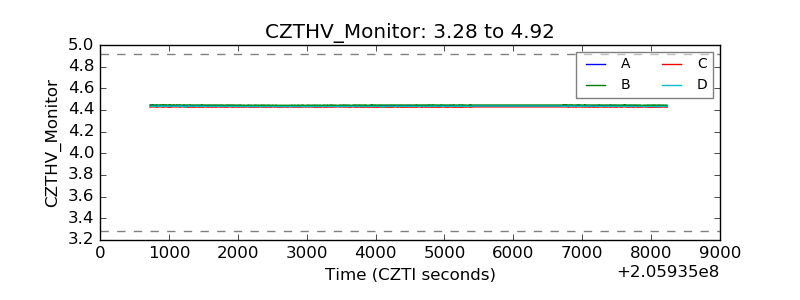 |
| D_VDD | 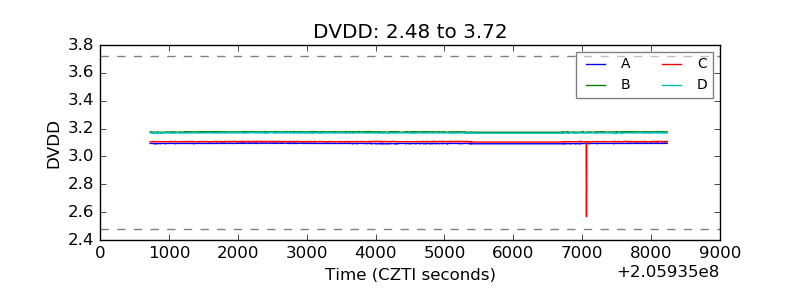 |
| Temperature 1 |  |
| Veto HV Monitor | 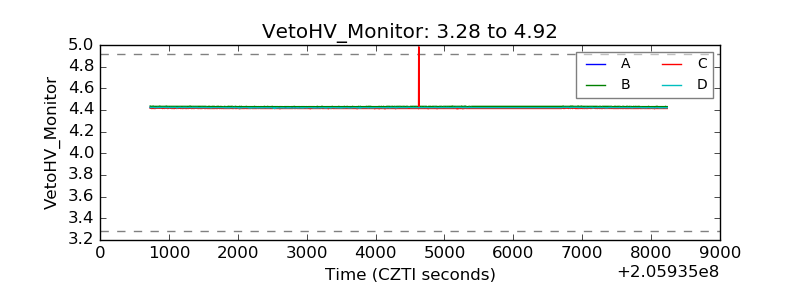 |
| Veto LLD | 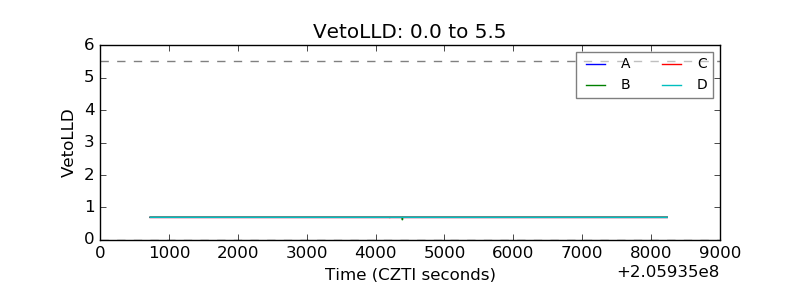 |
| Alpha Counter | 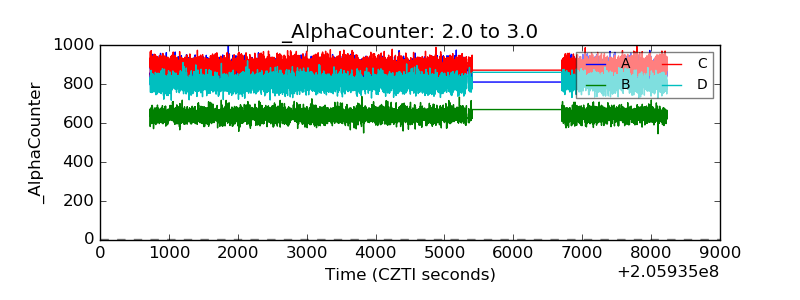 |
| _CPM_Rate | 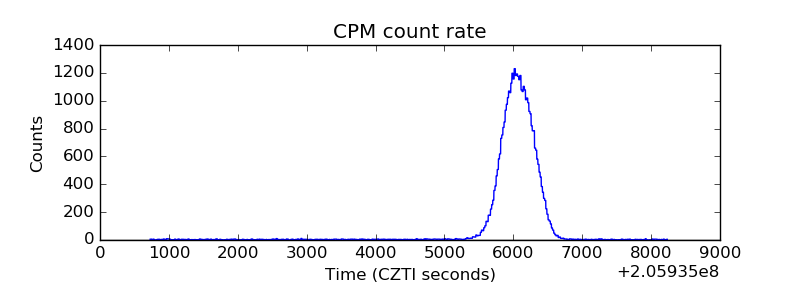 |
| CZT Counter | 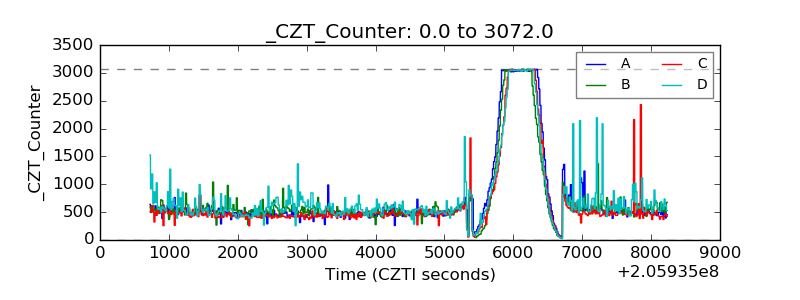 |
| +2.5 Volts monitor |  |
| +5 Volts monitor |  |
| _ROLL_ROT | 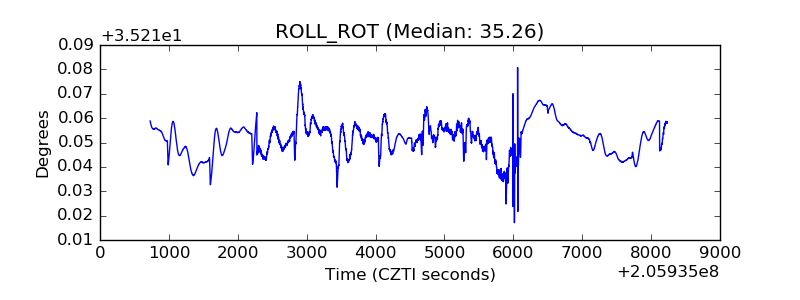 |
| _Roll_DEC | 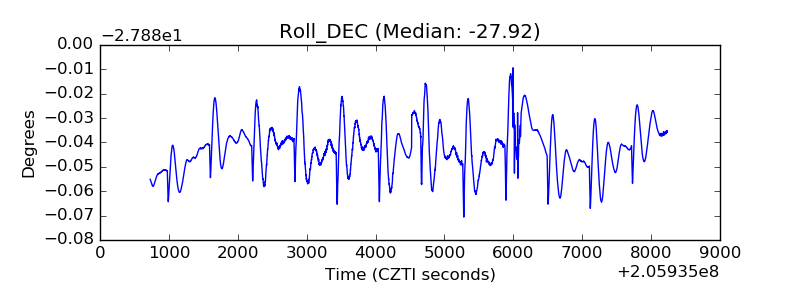 |
| _Roll_RA | 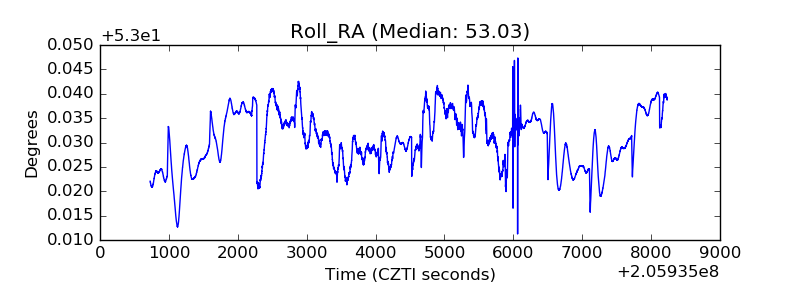 |
| Veto Counter | 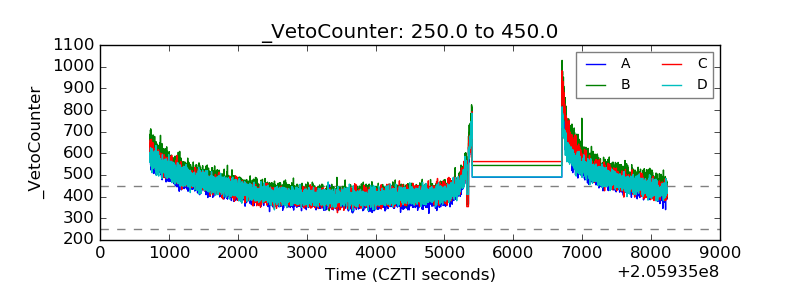 |