| Param | Original file | Final file |
|---|---|---|
| Filename | modeM0/AS1G05_240T01_9000000536_04257cztM0_level2.evt | modeM0/AS1G05_240T01_9000000536_04257cztM0_level2_quad_clean.evt |
| Size (bytes) | 511,830,720 | 52,300,800 |
| Size | 488.1 MB | 49.9 MB |
| Events in quadrant A | 3,549,834 | 290,848 |
| Events in quadrant B | 4,133,386 | 294,621 |
| Events in quadrant C | 2,921,603 | 286,078 |
| Events in quadrant D | 4,475,318 | 278,413 |
| Mode SS | |||
|---|---|---|---|
| Quadrant | BADHDUFLAG | Total packets | Discarded packets |
| A | 0 | 126 | 0 |
| B | 0 | 126 | 0 |
| C | 0 | 126 | 0 |
| D | 0 | 126 | 0 |
| Mode M9 | |||
|---|---|---|---|
| Quadrant | BADHDUFLAG | Total packets | Discarded packets |
| A | 0 | 11 | 0 |
| B | 0 | 11 | 0 |
| C | 0 | 11 | 0 |
| D | 0 | 11 | 0 |
| Mode M0 | |||
|---|---|---|---|
| Quadrant | BADHDUFLAG | Total packets | Discarded packets |
| A | 0 | 14436 | 2 |
| B | 0 | 16366 | 1 |
| C | 0 | 12782 | 1 |
| D | 0 | 17633 | 1 |
| Quadrant | Total seconds | Saturated seconds | Saturation percentage |
|---|---|---|---|
| A | 6206 | 206 | 3.319368% |
| B | 6206 | 182 | 2.932646% |
| C | 6206 | 68 | 1.095714% |
| D | 6206 | 228 | 3.673864% |
Noise dominated data is calculated using 1-second bins in cleaned event files. If a bin has >2000 counts, and if more than 50% of those come from <1% of pixels, then it is considered to be noise-dominated and hence unusable.
| Quadrant | # 1 sec bins | Bins with >0 counts | Bins with >2000 counts | High rate bins dominated by noise | Noise dominated (total time) | Noise dominated (detector-on time) | Marked lightcurve |
|---|---|---|---|---|---|---|---|
| A | 7276 | 6207 | 73 | 73 | 1.00% | 1.18% | 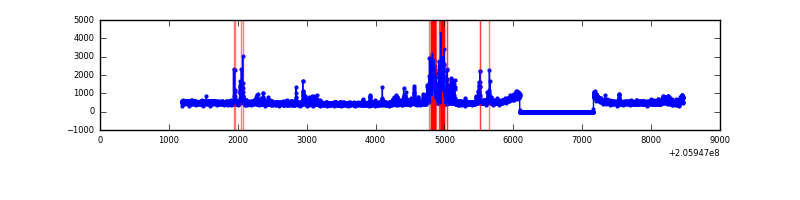 |
| B | 7276 | 6207 | 26 | 26 | 0.36% | 0.42% |  |
| C | 7276 | 6207 | 0 | 0 | 0.00% | 0.00% |  |
| D | 7276 | 6207 | 139 | 139 | 1.91% | 2.24% | 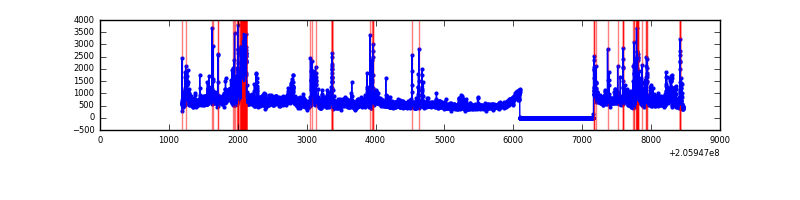 |
Top three noisy pixels from each quadrant. If the there are fewer than three noisy pixels in the level2.evt file, extra rows are filled as -1
| Pixel properties | Quadrant properties | ||||||
|---|---|---|---|---|---|---|---|
| Quadrant | DetID | PixID | Counts | Sigma | Mean | Median | Sigma |
| A | 0 | 50 | 487109 | 3164.59 | 754 | 736 | 153.7 |
| A | 0 | 149 | 62399 | 401.21 | 754 | 736 | 153.7 |
| A | 8 | 15 | 49823 | 319.39 | 754 | 736 | 153.7 |
| B | 5 | 184 | 561090 | 3849.34 | 760 | 742 | 145.6 |
| B | 3 | 0 | 510613 | 3502.58 | 760 | 742 | 145.6 |
| B | 0 | 183 | 23996 | 159.74 | 760 | 742 | 145.6 |
| C | 9 | 144 | 78524 | 460.27 | 727 | 731 | 169.0 |
| C | 13 | 61 | 6082 | 31.66 | 727 | 731 | 169.0 |
| C | 10 | 65 | 3991 | 19.29 | 727 | 731 | 169.0 |
| D | 11 | 132 | 614670 | 3479.91 | 720 | 697 | 176.4 |
| D | 2 | 232 | 411642 | 2329.17 | 720 | 697 | 176.4 |
| D | 9 | 85 | 386862 | 2188.72 | 720 | 697 | 176.4 |
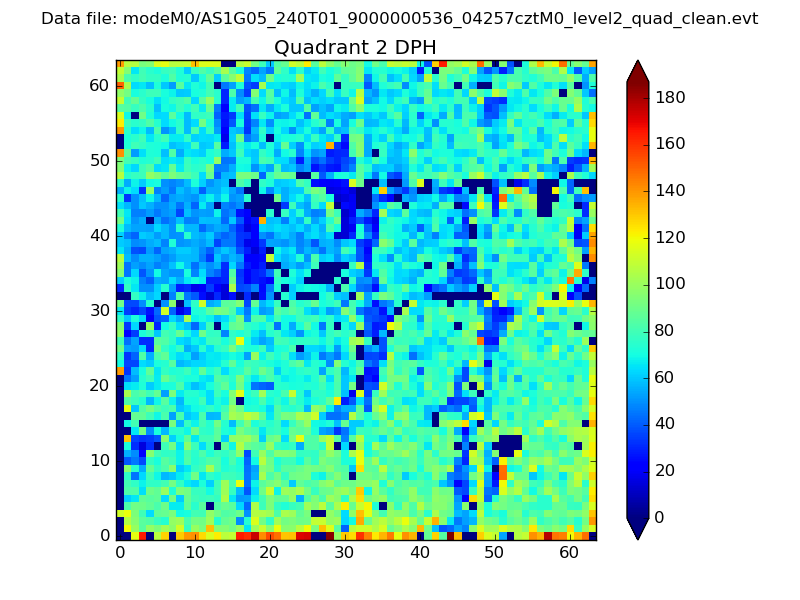
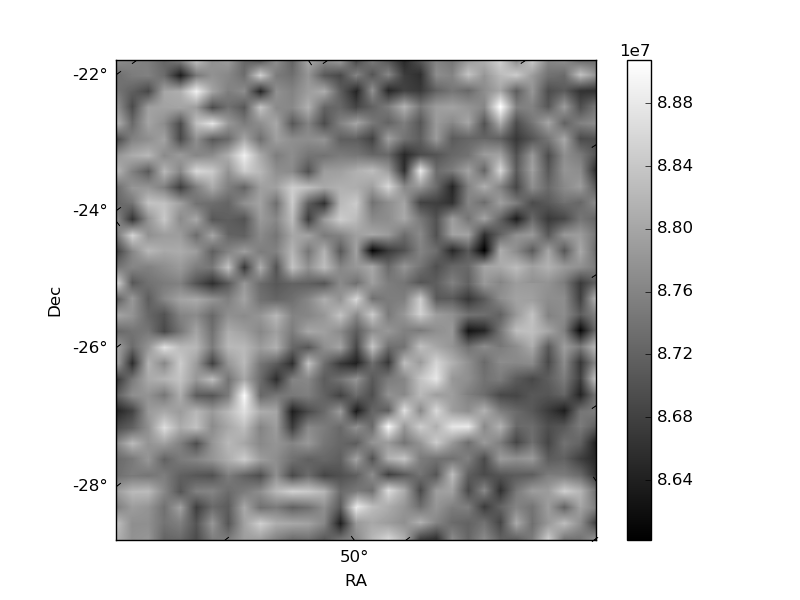
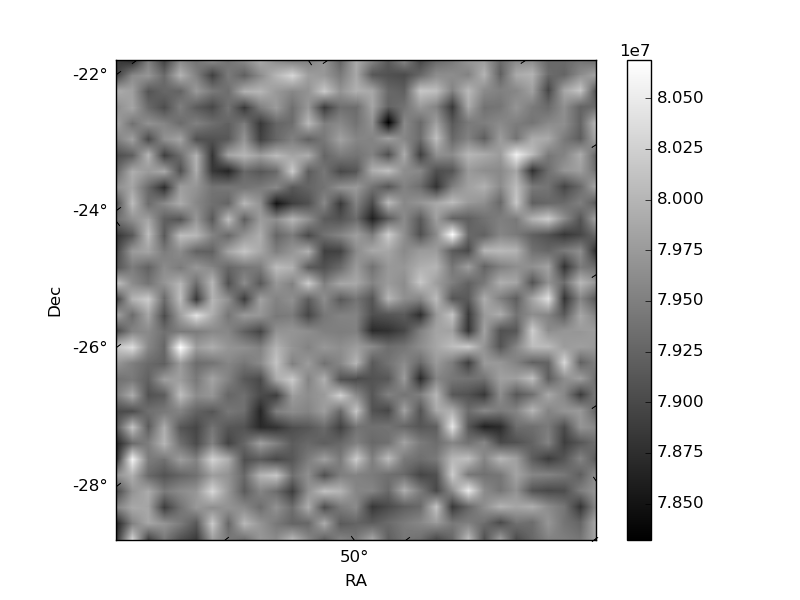
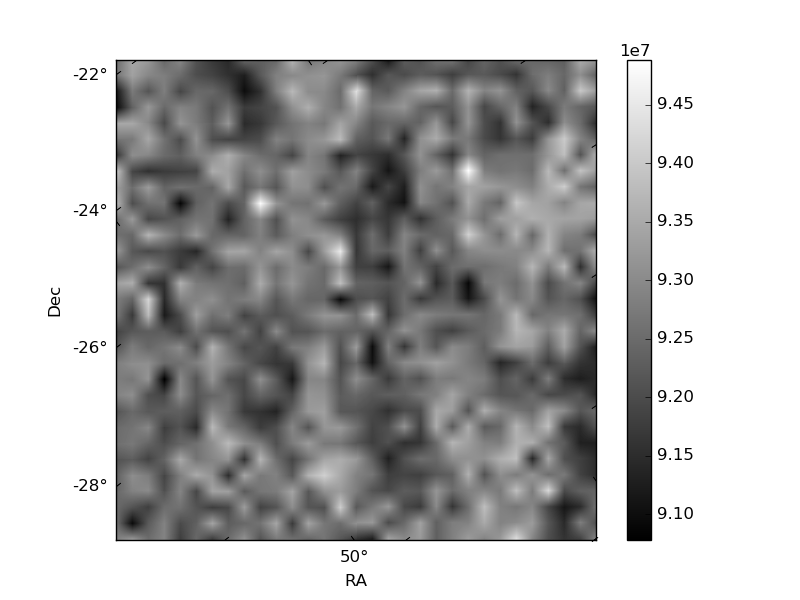
Histogram calculated using DETX and DETY for each event in the final _common_clean file
| Quadrant A | 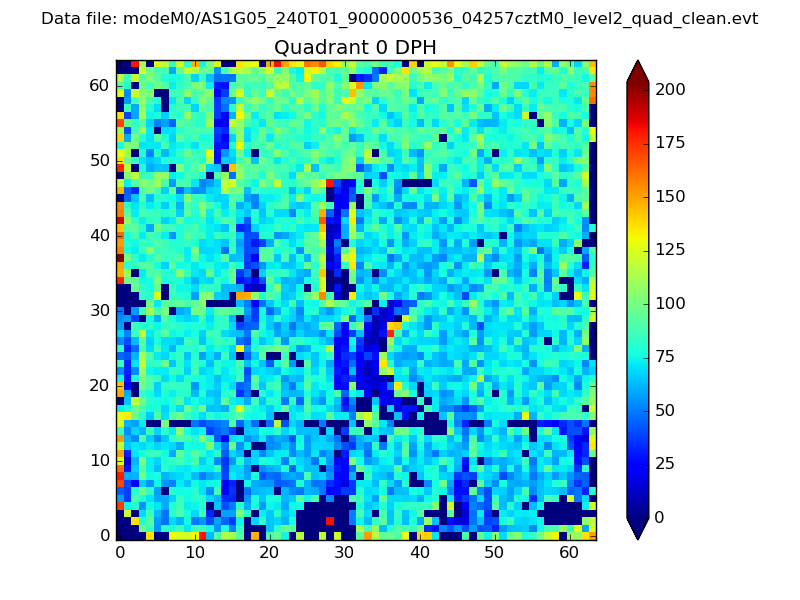 |
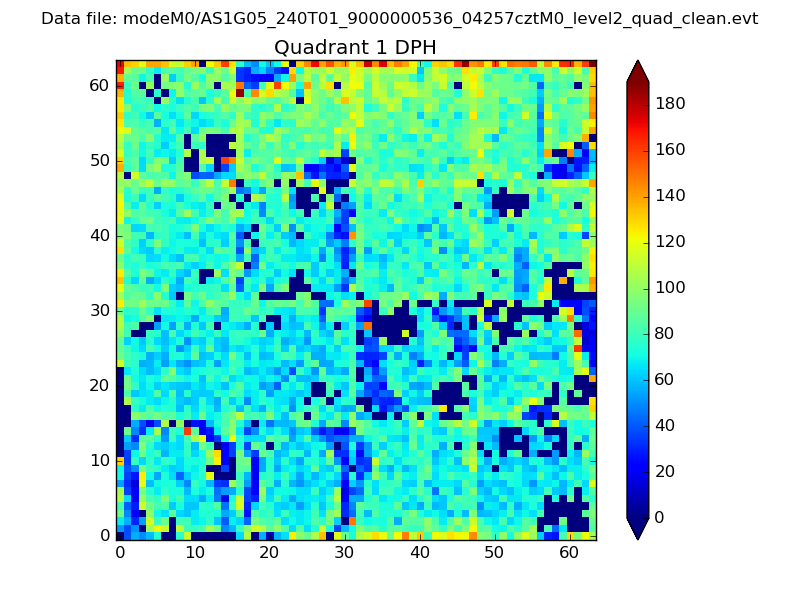 |
Quadrant B |
|---|---|---|---|
| Quadrant D | 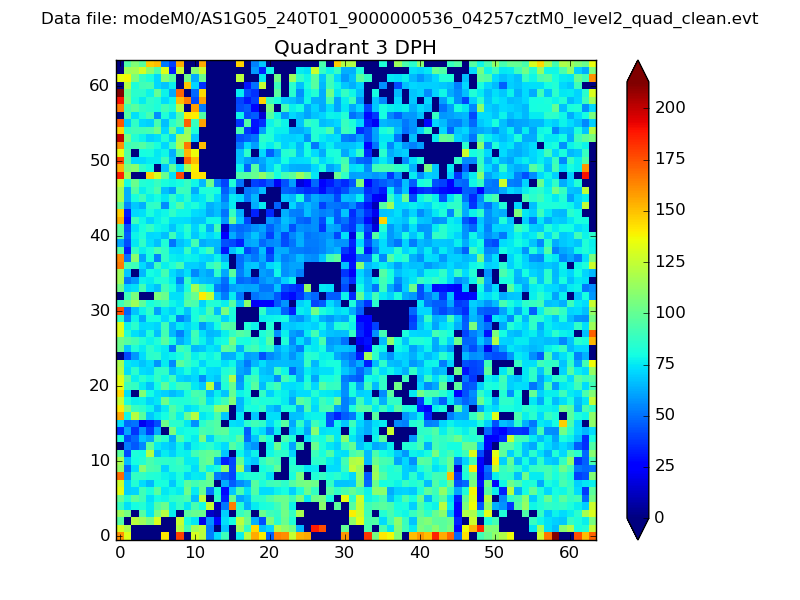 |
 |
Quadrant C |
| Plot type | Count rate plots | Images |
|---|---|---|
| Comparison with Poisson distribution Blue bars denote a histogram of data divided into 1 sec bins. Red curve is a Poisson curve with rate = median count rate of data. |
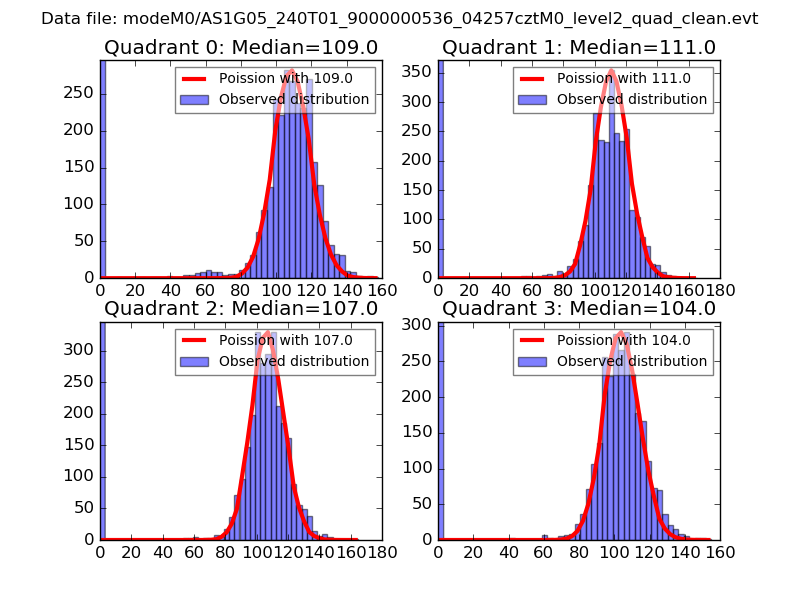 |
 |
| Quadrant-wise count rates Data is divided into 100 sec bins |
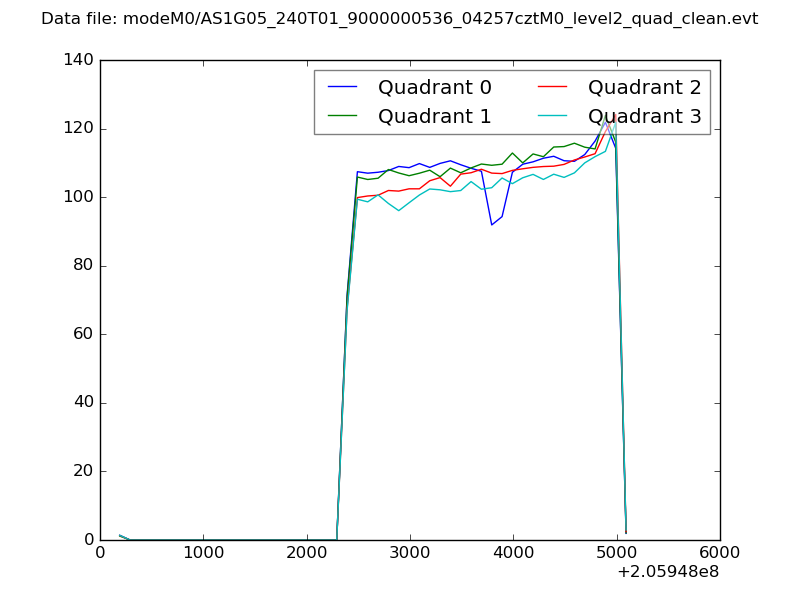 |
|
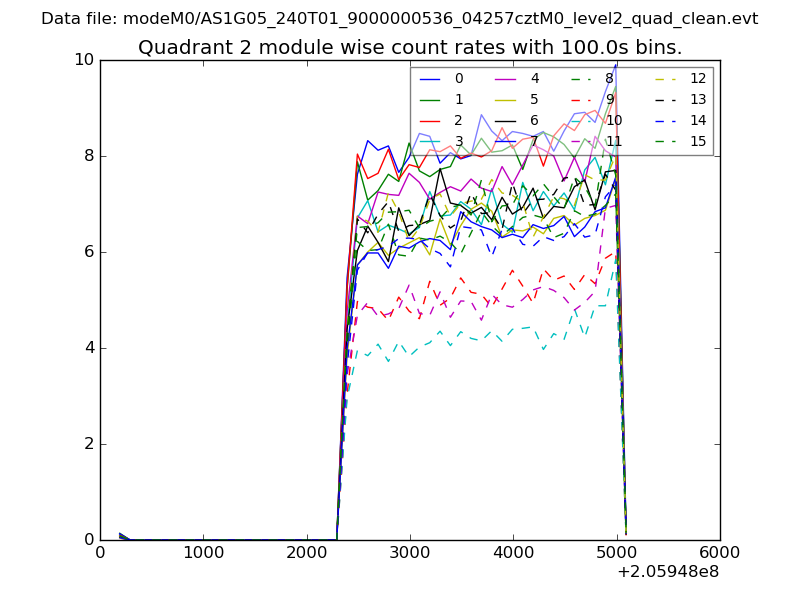
| Module-wise count rates for Quadrant A Data is divided into 100 sec bins |
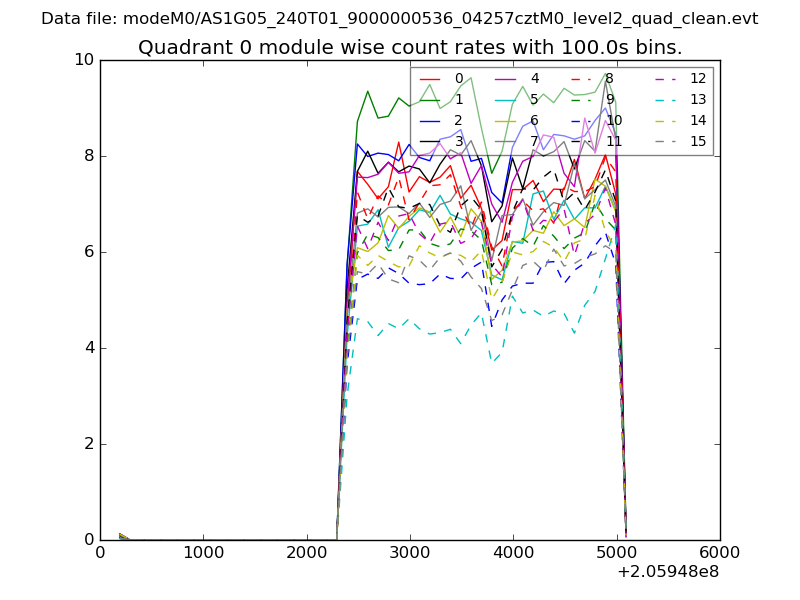 |
 |
| Module-wise count rates for Quadrant B Data is divided into 100 sec bins |
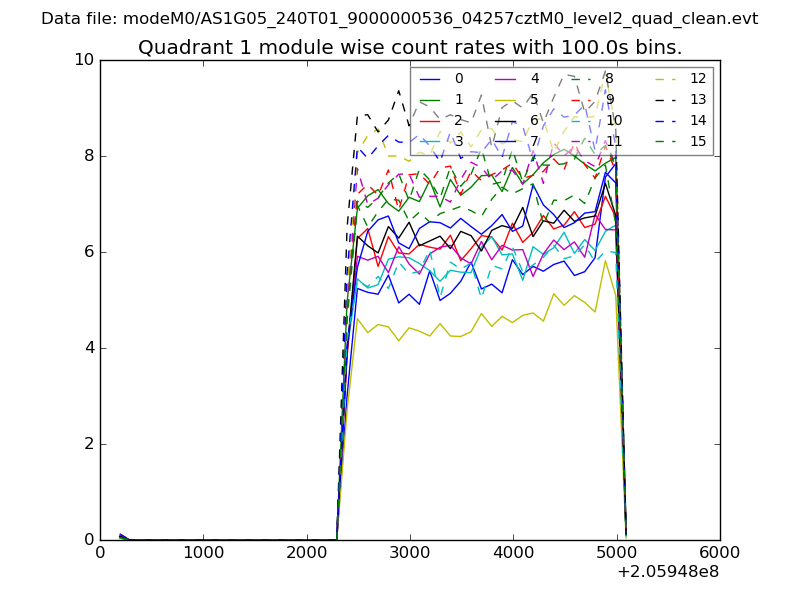 |
 |
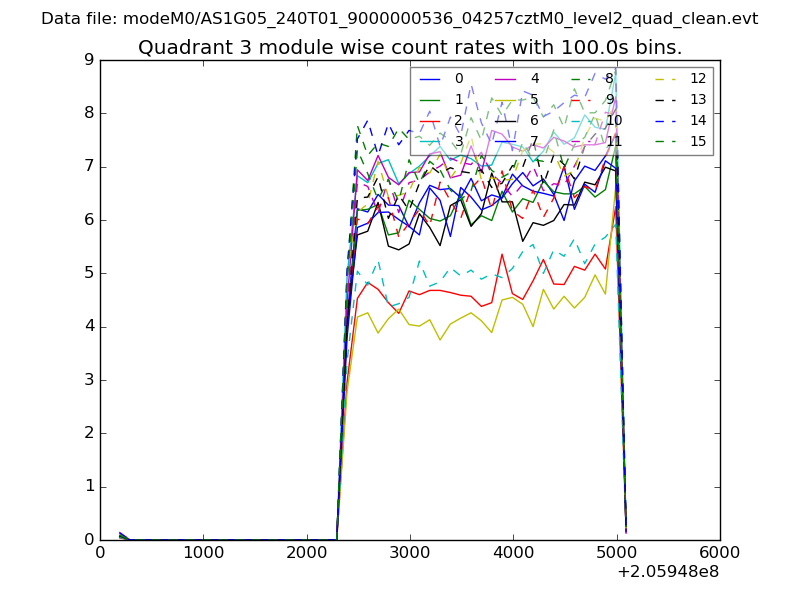
| Module-wise count rates for Quadrant C Data is divided into 100 sec bins |
 |
 |
| Module-wise count rates for Quadrant D Data is divided into 100 sec bins |
 |
 |
| Parameter | Plot |
|---|---|
| CZT HV Monitor | 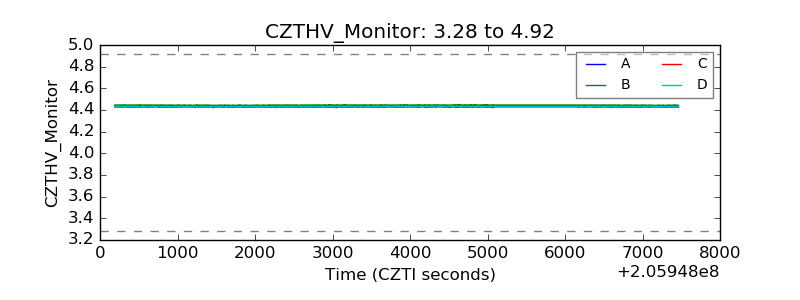 |
| D_VDD | 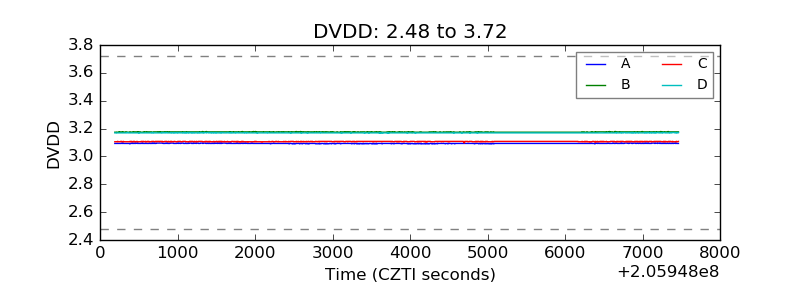 |
| Temperature 1 | 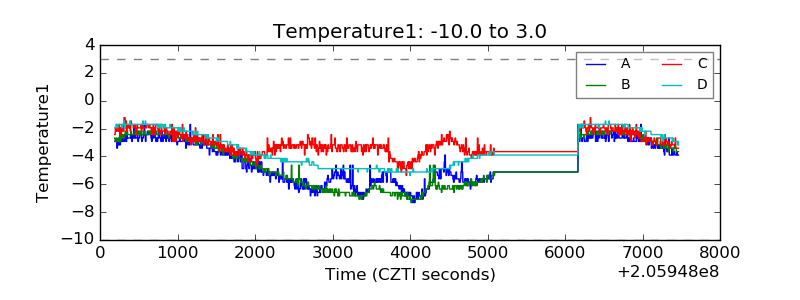 |
| Veto HV Monitor | 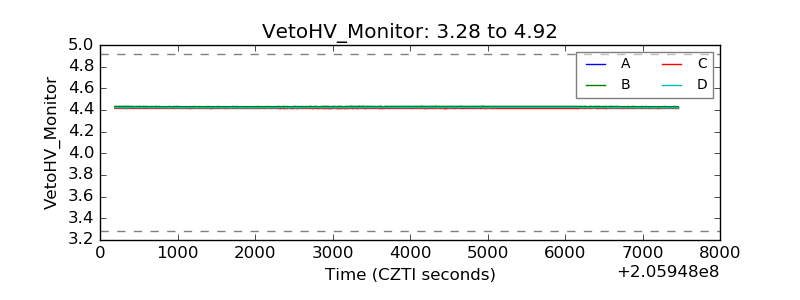 |
| Veto LLD |  |
| Alpha Counter | 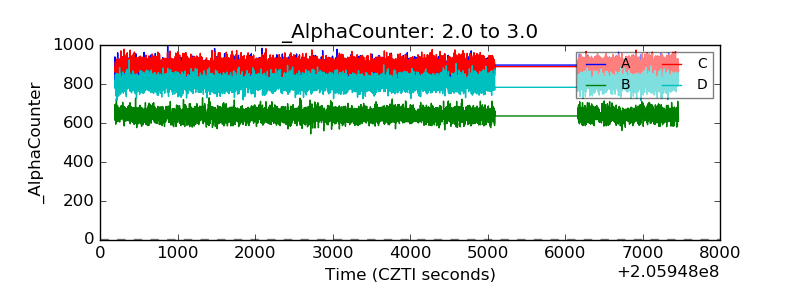 |
| _CPM_Rate | 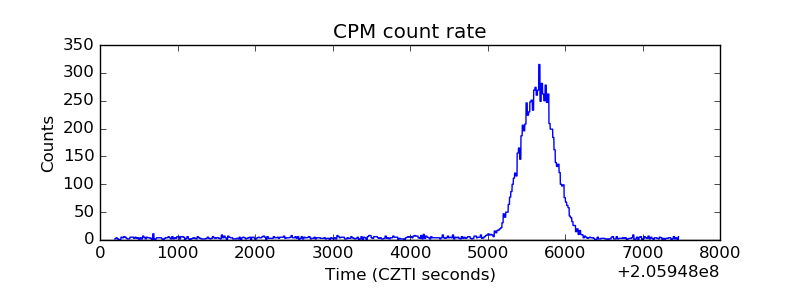 |
| CZT Counter | 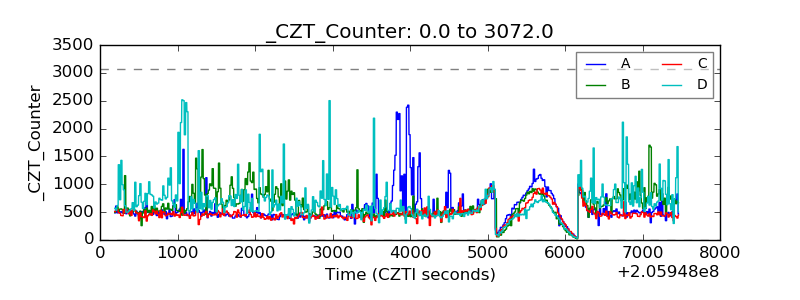 |
| +2.5 Volts monitor |  |
| +5 Volts monitor |  |
| _ROLL_ROT | 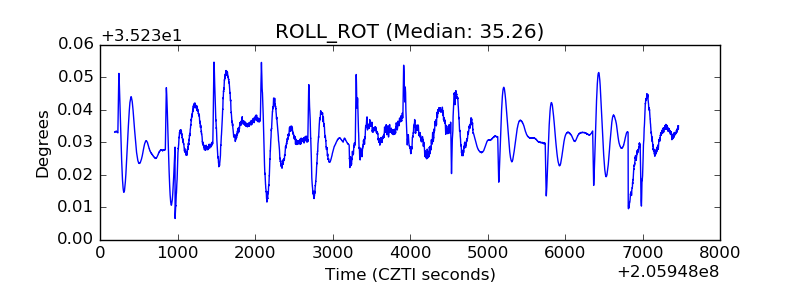 |
| _Roll_DEC | 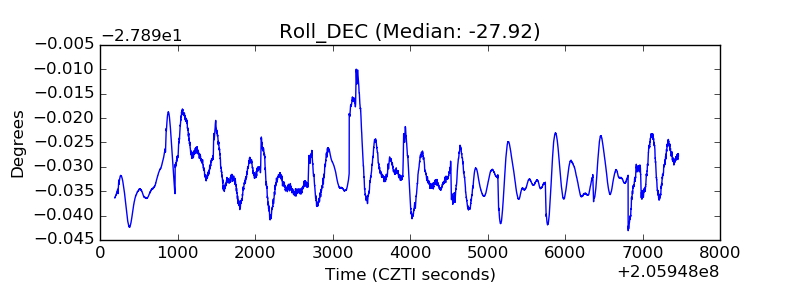 |
| _Roll_RA | 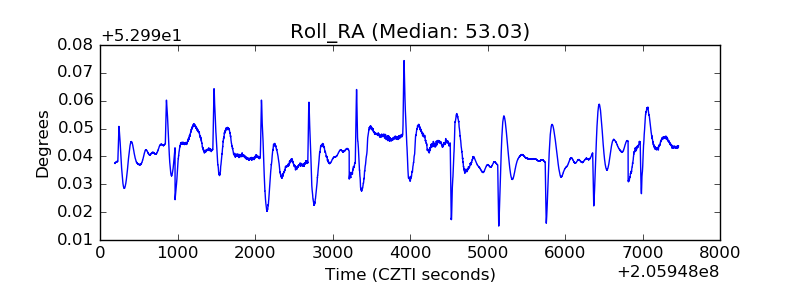 |
| Veto Counter | 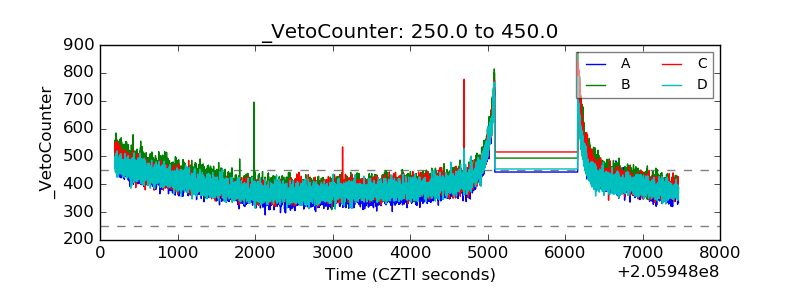 |