| Param | Original file | Final file |
|---|---|---|
| Filename | modeM0/AS1G05_240T01_9000000536_04258cztM0_level2.evt | modeM0/AS1G05_240T01_9000000536_04258cztM0_level2_quad_clean.evt |
| Size (bytes) | 544,841,280 | 62,979,840 |
| Size | 519.6 MB | 60.1 MB |
| Events in quadrant A | 3,474,212 | 365,176 |
| Events in quadrant B | 4,864,878 | 361,128 |
| Events in quadrant C | 3,197,435 | 352,426 |
| Events in quadrant D | 4,492,359 | 343,413 |
| Mode SS | |||
|---|---|---|---|
| Quadrant | BADHDUFLAG | Total packets | Discarded packets |
| A | 0 | 142 | 0 |
| B | 0 | 142 | 0 |
| C | 0 | 142 | 0 |
| D | 0 | 142 | 0 |
| Mode M9 | |||
|---|---|---|---|
| Quadrant | BADHDUFLAG | Total packets | Discarded packets |
| A | 0 | 9 | 0 |
| B | 0 | 9 | 0 |
| C | 0 | 9 | 0 |
| D | 0 | 10 | 0 |
| Mode M0 | |||
|---|---|---|---|
| Quadrant | BADHDUFLAG | Total packets | Discarded packets |
| A | 0 | 14808 | 3 |
| B | 0 | 19240 | 2 |
| C | 0 | 14370 | 2 |
| D | 0 | 18329 | 2 |
| Quadrant | Total seconds | Saturated seconds | Saturation percentage |
|---|---|---|---|
| A | 6953 | 135 | 1.941608% |
| B | 6953 | 302 | 4.343449% |
| C | 6953 | 68 | 0.977995% |
| D | 6953 | 179 | 2.574428% |
Noise dominated data is calculated using 1-second bins in cleaned event files. If a bin has >2000 counts, and if more than 50% of those come from <1% of pixels, then it is considered to be noise-dominated and hence unusable.
| Quadrant | # 1 sec bins | Bins with >0 counts | Bins with >2000 counts | High rate bins dominated by noise | Noise dominated (total time) | Noise dominated (detector-on time) | Marked lightcurve |
|---|---|---|---|---|---|---|---|
| A | 7683 | 6953 | 0 | 0 | 0.00% | 0.00% | 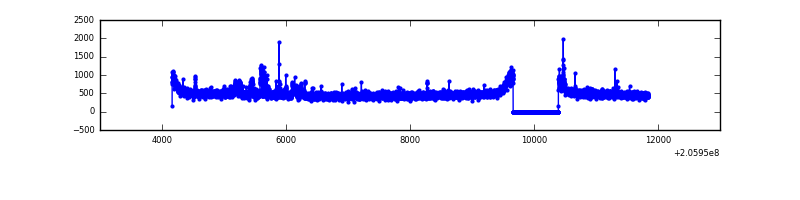 |
| B | 7683 | 6953 | 102 | 102 | 1.33% | 1.47% | 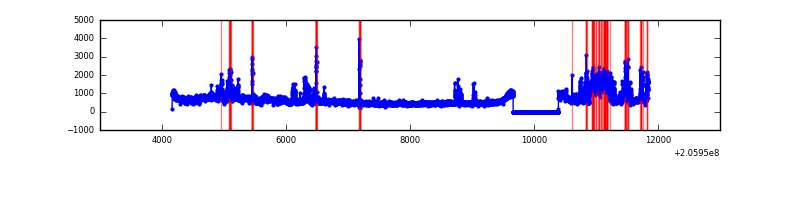 |
| C | 7683 | 6954 | 1 | 1 | 0.01% | 0.01% | 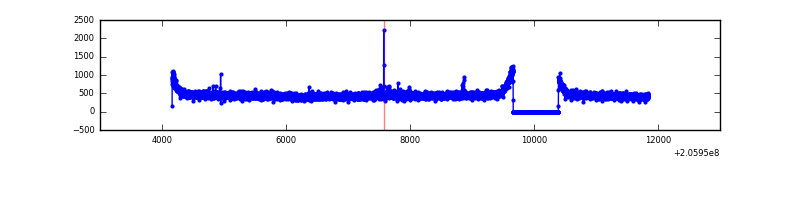 |
| D | 7683 | 6954 | 90 | 90 | 1.17% | 1.29% | 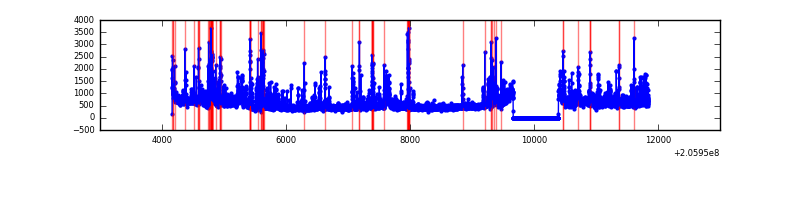 |
Top three noisy pixels from each quadrant. If the there are fewer than three noisy pixels in the level2.evt file, extra rows are filled as -1
| Pixel properties | Quadrant properties | ||||||
|---|---|---|---|---|---|---|---|
| Quadrant | DetID | PixID | Counts | Sigma | Mean | Median | Sigma |
| A | 14 | 111 | 100166 | 581.49 | 834 | 817 | 170.9 |
| A | 0 | 149 | 71550 | 414.0 | 834 | 817 | 170.9 |
| A | 8 | 15 | 44400 | 255.09 | 834 | 817 | 170.9 |
| B | 3 | 0 | 787380 | 4902.42 | 834 | 815 | 160.4 |
| B | 5 | 184 | 676812 | 4213.28 | 834 | 815 | 160.4 |
| B | 14 | 167 | 64784 | 398.7 | 834 | 815 | 160.4 |
| C | 9 | 144 | 57570 | 300.44 | 799 | 802 | 189.0 |
| C | 10 | 65 | 14033 | 70.02 | 799 | 802 | 189.0 |
| C | 13 | 61 | 6528 | 30.3 | 799 | 802 | 189.0 |
| D | 2 | 232 | 389563 | 1986.43 | 797 | 774 | 195.7 |
| D | 9 | 85 | 346497 | 1766.4 | 797 | 774 | 195.7 |
| D | 11 | 132 | 197447 | 1004.86 | 797 | 774 | 195.7 |
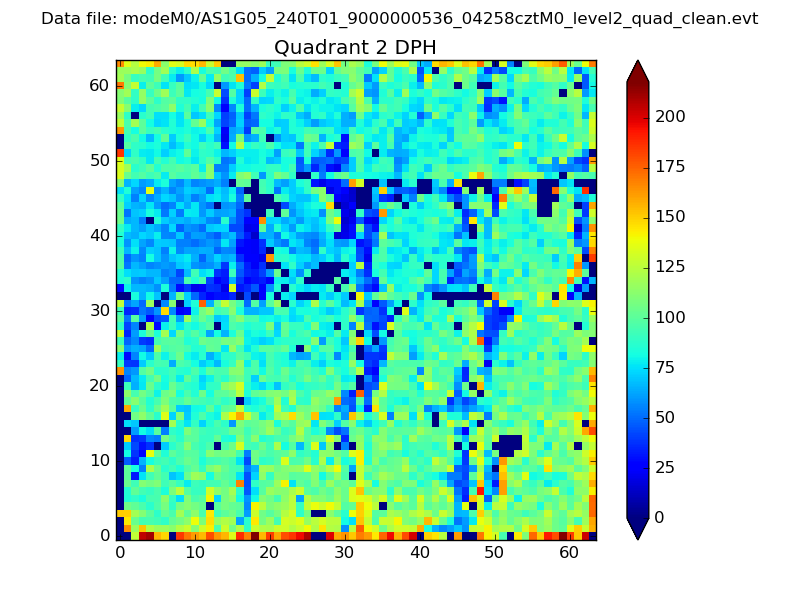
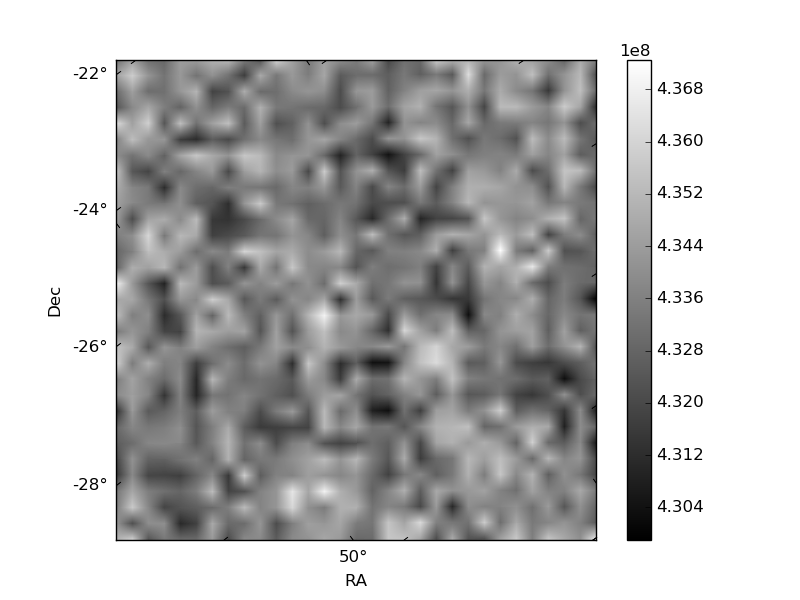
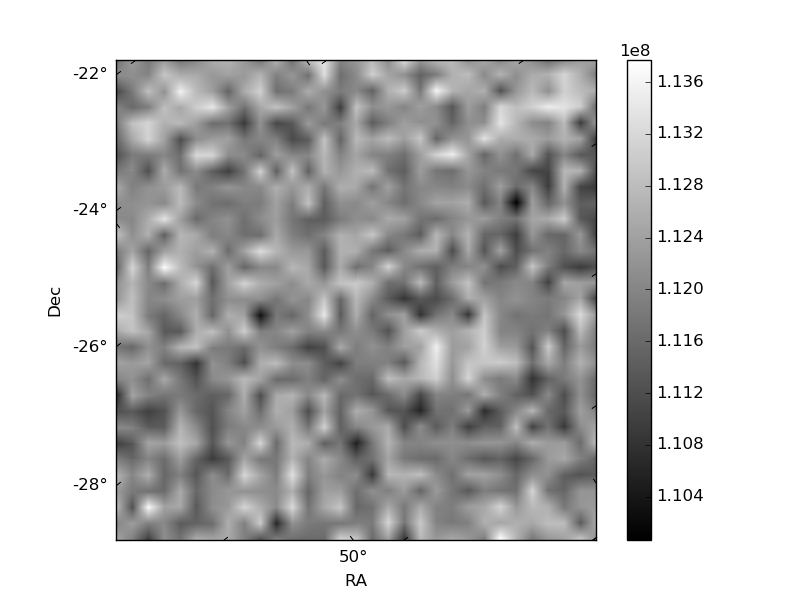
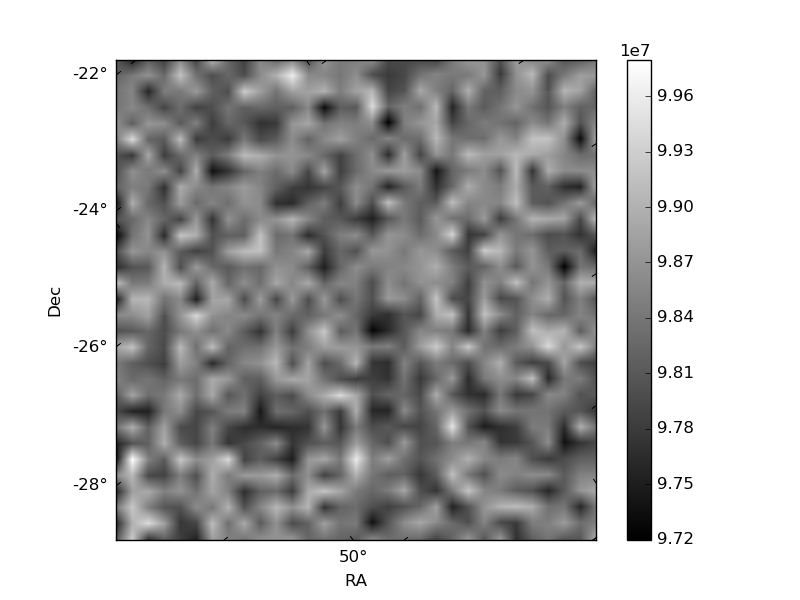
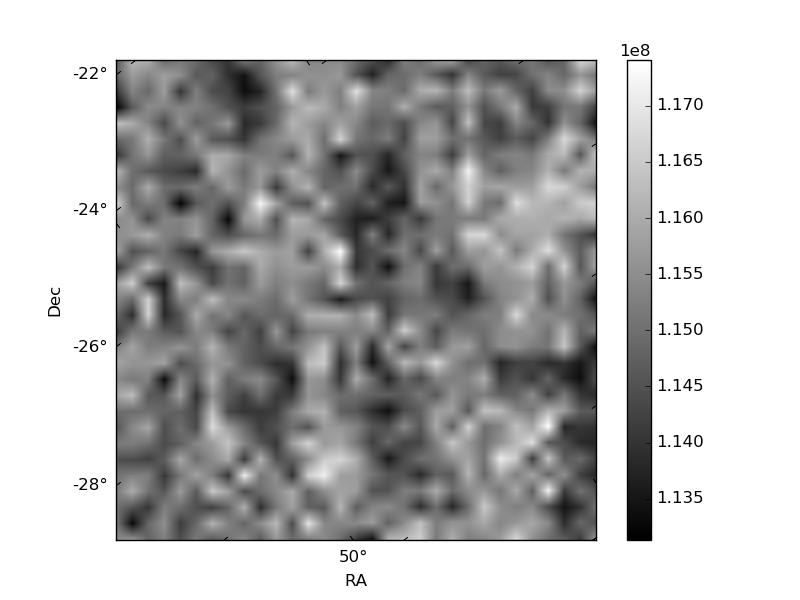
Histogram calculated using DETX and DETY for each event in the final _common_clean file
| Quadrant A | 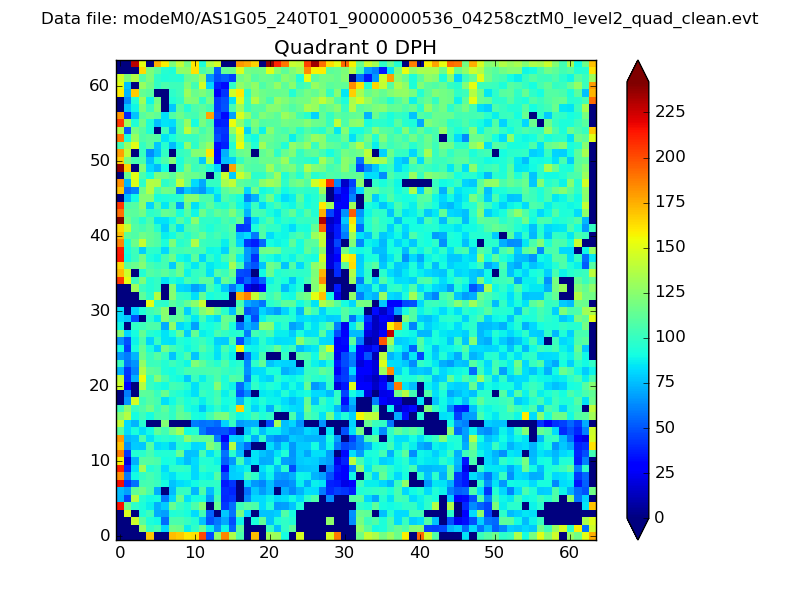 |
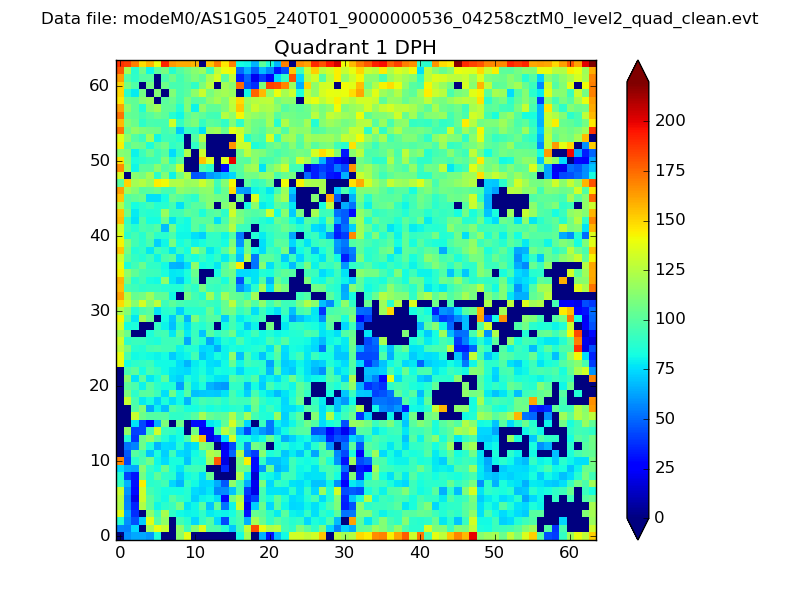 |
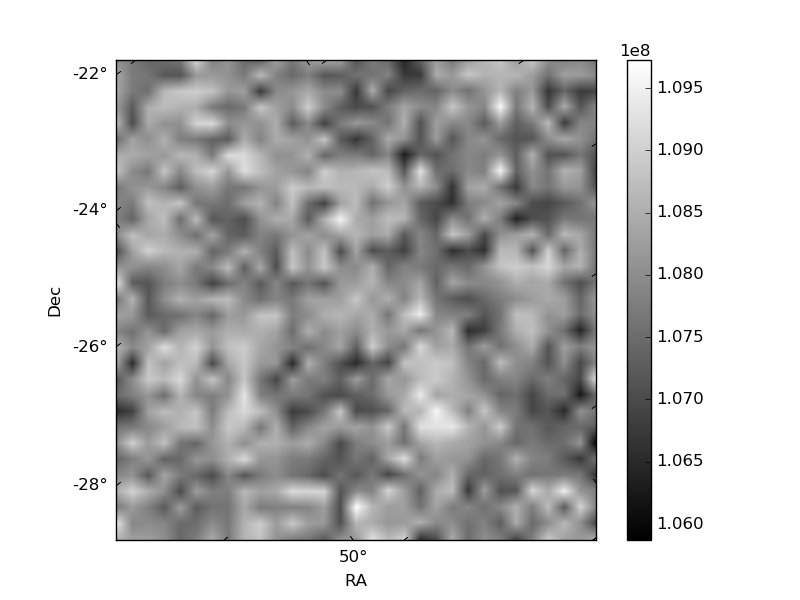
Quadrant B |
|---|---|---|---|
| Quadrant D | 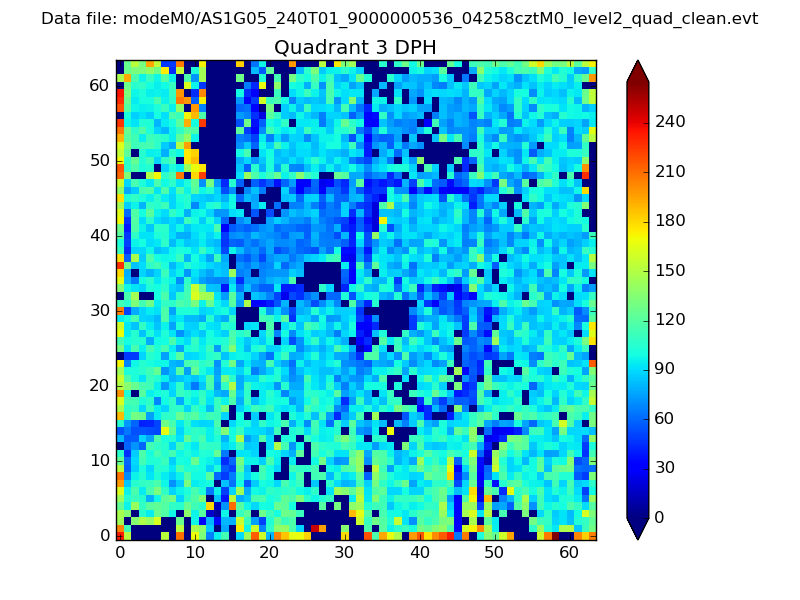 |
 |
Quadrant C |
| Plot type | Count rate plots | Images |
|---|---|---|
| Comparison with Poisson distribution Blue bars denote a histogram of data divided into 1 sec bins. Red curve is a Poisson curve with rate = median count rate of data. |
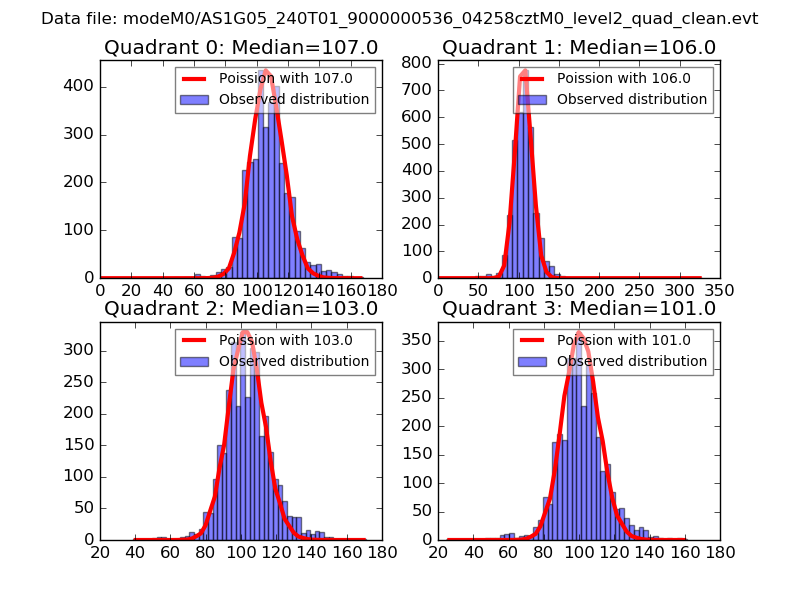 |
 |
| Quadrant-wise count rates Data is divided into 100 sec bins |
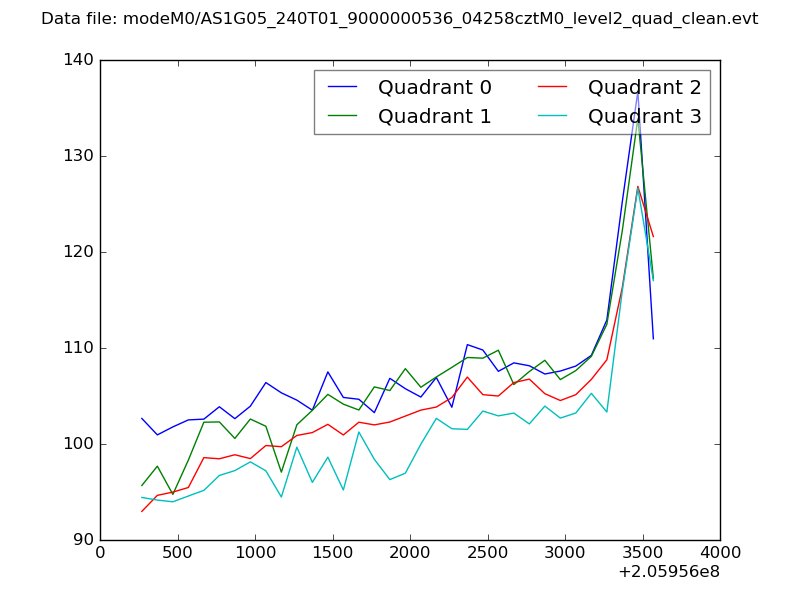 |
|
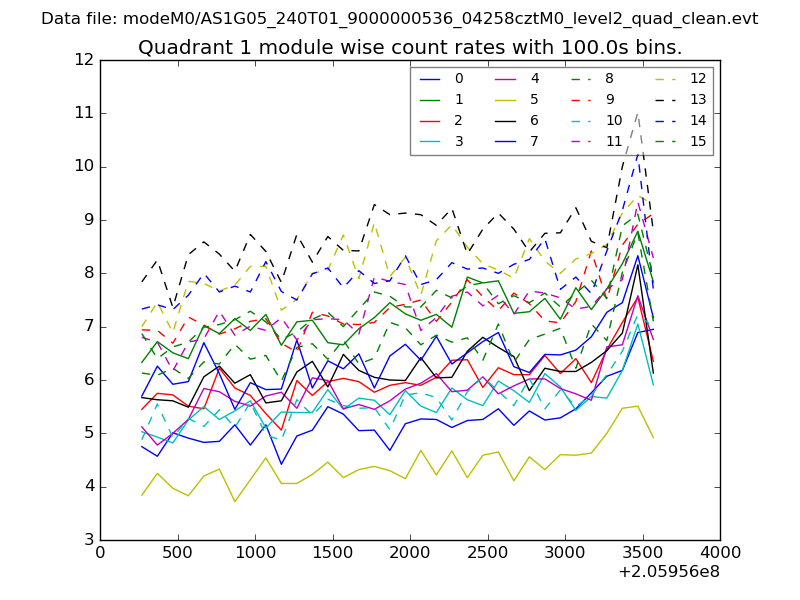
| Module-wise count rates for Quadrant A Data is divided into 100 sec bins |
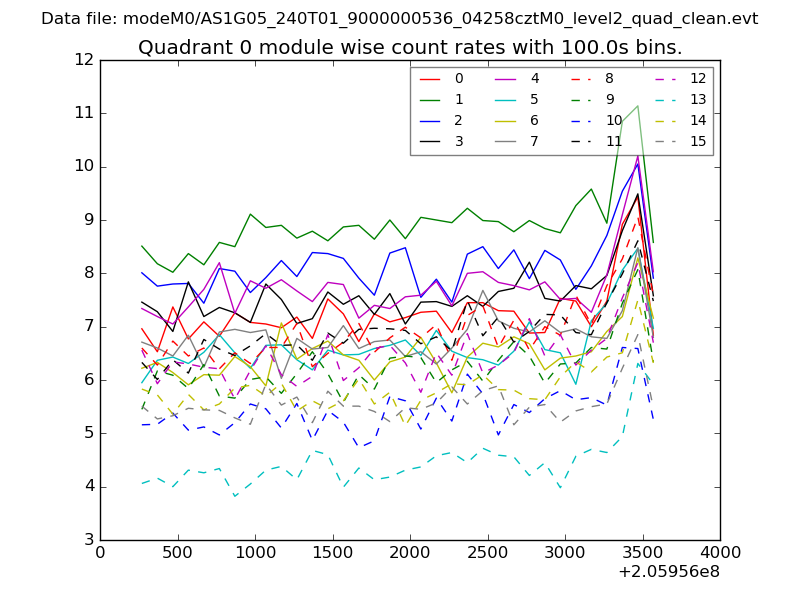 |
 |
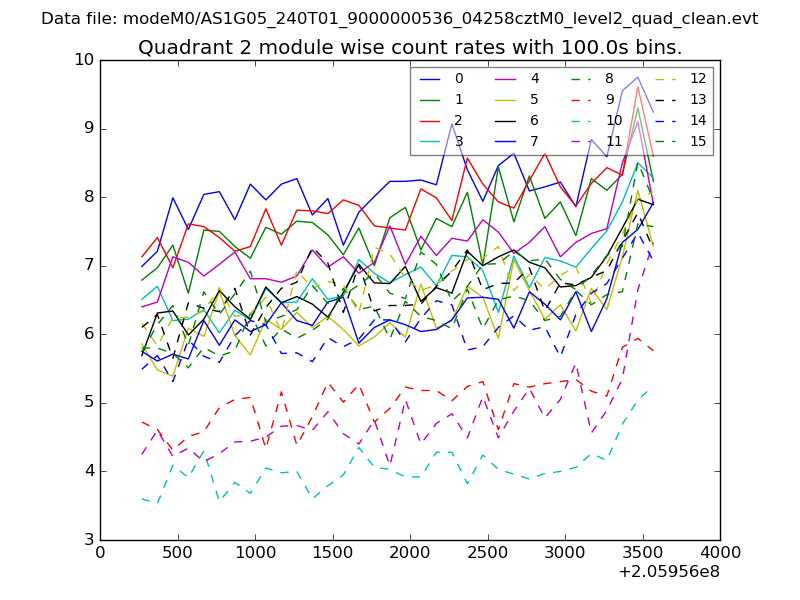
| Module-wise count rates for Quadrant B Data is divided into 100 sec bins |
 |
 |
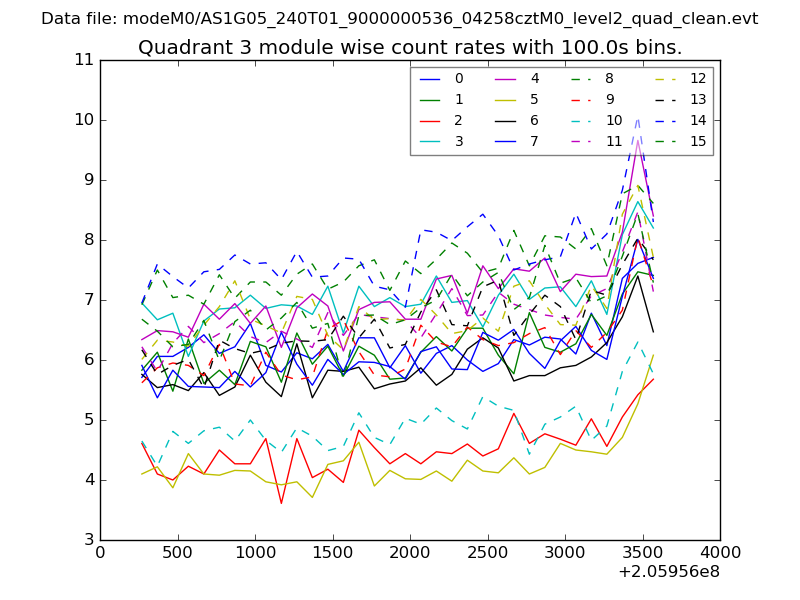
| Module-wise count rates for Quadrant C Data is divided into 100 sec bins |
 |
 |
| Module-wise count rates for Quadrant D Data is divided into 100 sec bins |
 |
 |
| Parameter | Plot |
|---|---|
| CZT HV Monitor | 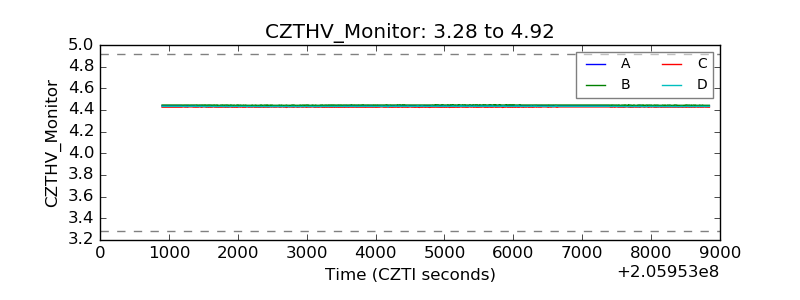 |
| D_VDD | 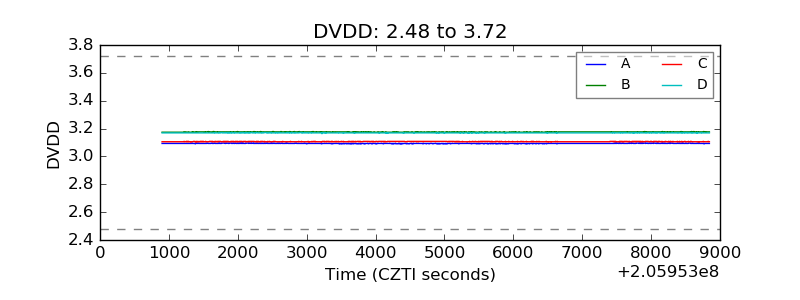 |
| Temperature 1 | 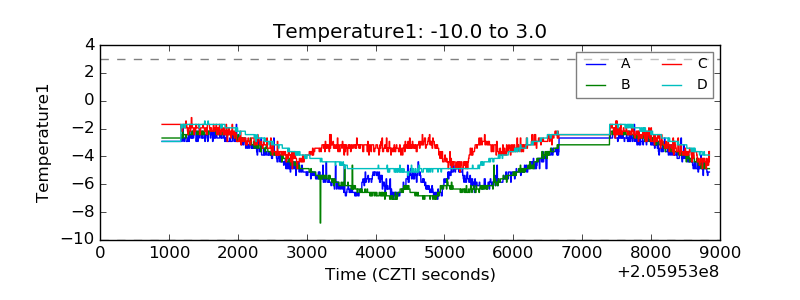 |
| Veto HV Monitor | 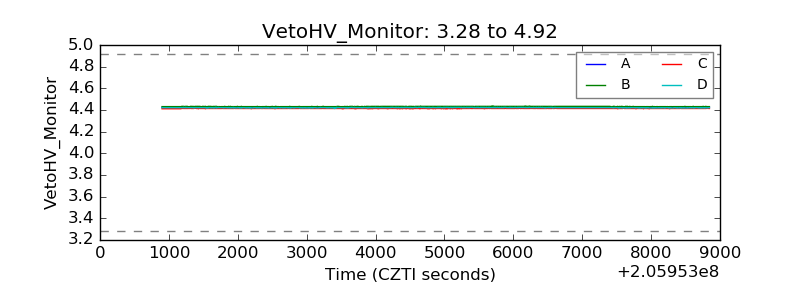 |
| Veto LLD | 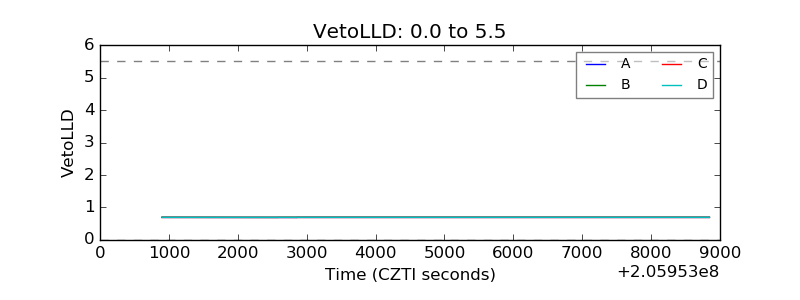 |
| Alpha Counter | 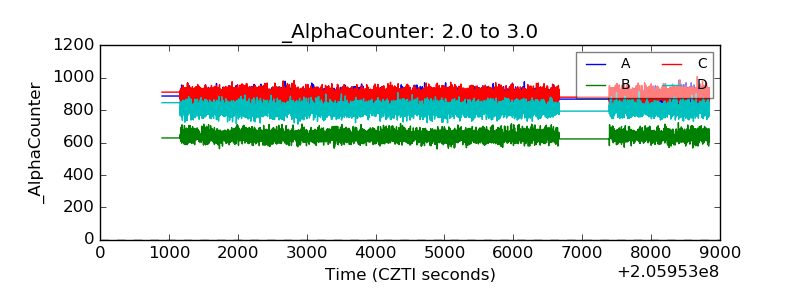 |
| _CPM_Rate | 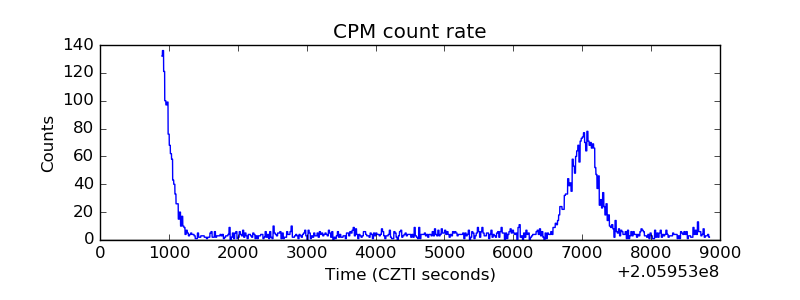 |
| CZT Counter | 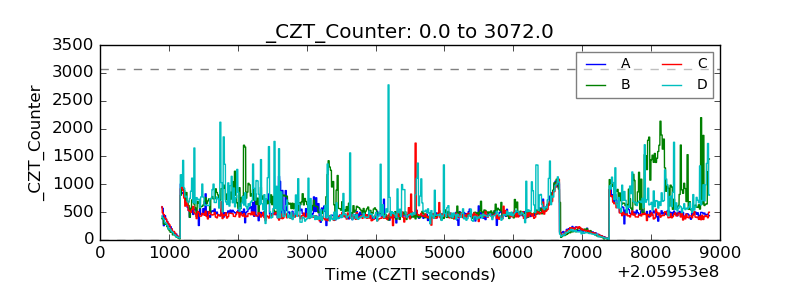 |
| +2.5 Volts monitor |  |
| +5 Volts monitor |  |
| _ROLL_ROT | 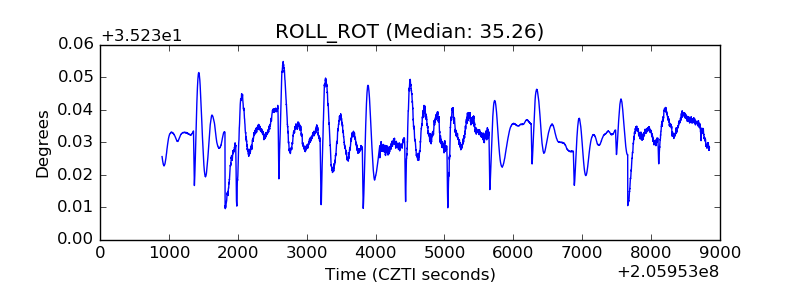 |
| _Roll_DEC | 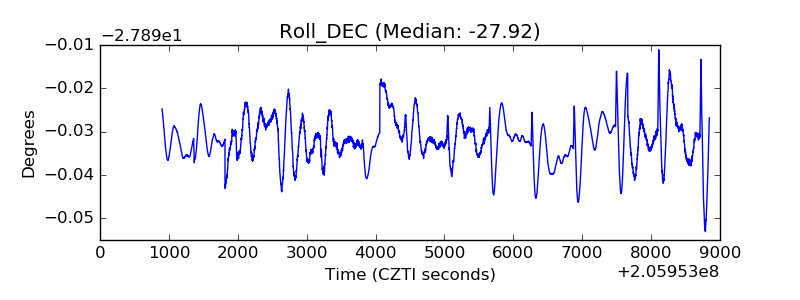 |
| _Roll_RA | 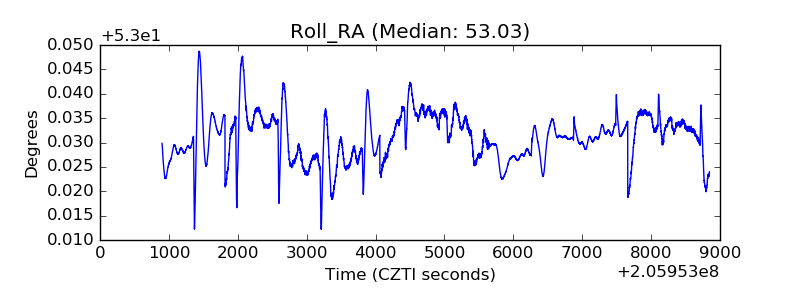 |
| Veto Counter | 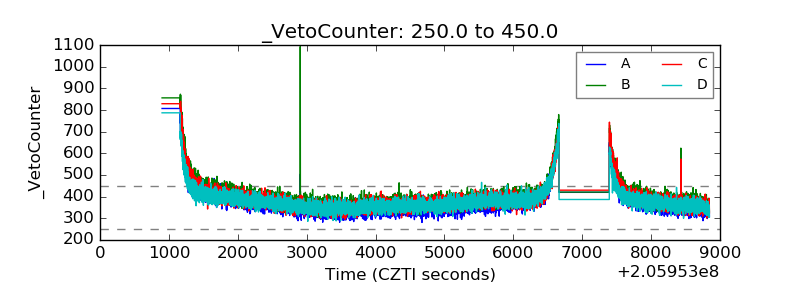 |