| Param | Original file | Final file |
|---|---|---|
| Filename | modeM0/AS1G05_240T01_9000000536_04259cztM0_level2.evt | modeM0/AS1G05_240T01_9000000536_04259cztM0_level2_quad_clean.evt |
| Size (bytes) | 629,184,960 | 69,848,640 |
| Size | 600.0 MB | 66.6 MB |
| Events in quadrant A | 4,123,157 | 394,370 |
| Events in quadrant B | 5,359,074 | 406,156 |
| Events in quadrant C | 3,453,436 | 399,369 |
| Events in quadrant D | 5,602,920 | 384,629 |
| Mode SS | |||
|---|---|---|---|
| Quadrant | BADHDUFLAG | Total packets | Discarded packets |
| A | 0 | 156 | 0 |
| B | 0 | 156 | 0 |
| C | 0 | 156 | 0 |
| D | 0 | 156 | 0 |
| Mode M9 | |||
|---|---|---|---|
| Quadrant | BADHDUFLAG | Total packets | Discarded packets |
| A | 0 | 10 | 0 |
| B | 0 | 10 | 0 |
| C | 0 | 10 | 0 |
| D | 0 | 10 | 0 |
| Mode M0 | |||
|---|---|---|---|
| Quadrant | BADHDUFLAG | Total packets | Discarded packets |
| A | 0 | 17321 | 3 |
| B | 0 | 21325 | 2 |
| C | 0 | 15821 | 2 |
| D | 0 | 21770 | 2 |
| Quadrant | Total seconds | Saturated seconds | Saturation percentage |
|---|---|---|---|
| A | 7623 | 346 | 4.538895% |
| B | 7623 | 460 | 6.034370% |
| C | 7623 | 100 | 1.311819% |
| D | 7623 | 343 | 4.499541% |
Noise dominated data is calculated using 1-second bins in cleaned event files. If a bin has >2000 counts, and if more than 50% of those come from <1% of pixels, then it is considered to be noise-dominated and hence unusable.
| Quadrant | # 1 sec bins | Bins with >0 counts | Bins with >2000 counts | High rate bins dominated by noise | Noise dominated (total time) | Noise dominated (detector-on time) | Marked lightcurve |
|---|---|---|---|---|---|---|---|
| A | 8658 | 7624 | 173 | 173 | 2.00% | 2.27% | 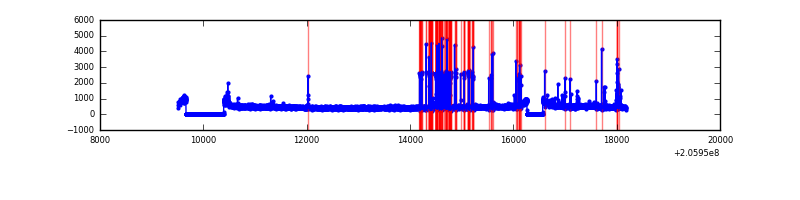 |
| B | 8658 | 7624 | 151 | 151 | 1.74% | 1.98% | 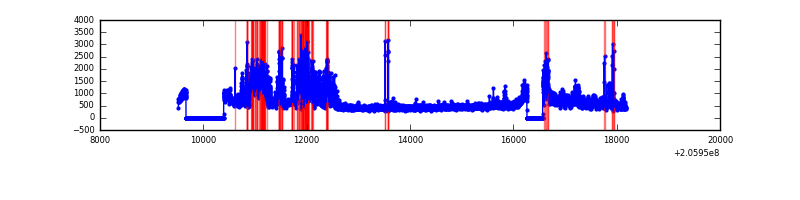 |
| C | 8658 | 7625 | 0 | 0 | 0.00% | 0.00% | 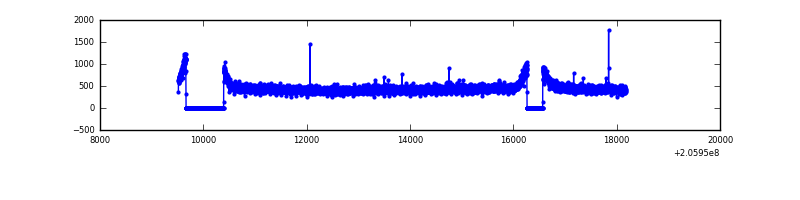 |
| D | 8658 | 7625 | 265 | 265 | 3.06% | 3.48% | 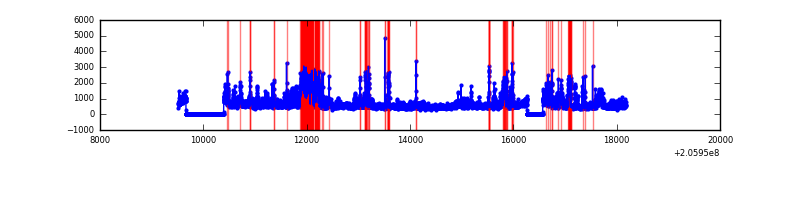 |
Top three noisy pixels from each quadrant. If the there are fewer than three noisy pixels in the level2.evt file, extra rows are filled as -1
| Pixel properties | Quadrant properties | ||||||
|---|---|---|---|---|---|---|---|
| Quadrant | DetID | PixID | Counts | Sigma | Mean | Median | Sigma |
| A | 0 | 199 | 422517 | 2277.69 | 895 | 875 | 185.1 |
| A | 8 | 15 | 83348 | 445.51 | 895 | 875 | 185.1 |
| A | 0 | 149 | 73420 | 391.88 | 895 | 875 | 185.1 |
| B | 5 | 184 | 1258392 | 7148.21 | 907 | 887 | 175.9 |
| B | 3 | 0 | 419030 | 2376.91 | 907 | 887 | 175.9 |
| B | 5 | 171 | 68822 | 386.17 | 907 | 887 | 175.9 |
| C | 13 | 61 | 7336 | 31.25 | 878 | 882 | 206.5 |
| C | 9 | 144 | 6418 | 26.81 | 878 | 882 | 206.5 |
| C | 8 | 128 | 6369 | 26.57 | 878 | 882 | 206.5 |
| D | 13 | 53 | 1072263 | 4995.34 | 873 | 846 | 214.5 |
| D | 9 | 85 | 652470 | 3038.11 | 873 | 846 | 214.5 |
| D | 2 | 232 | 190717 | 885.25 | 873 | 846 | 214.5 |
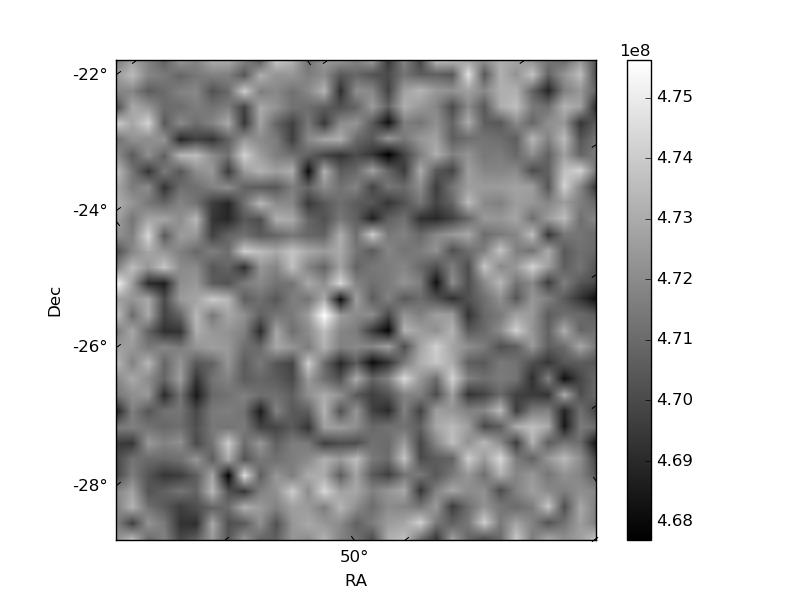
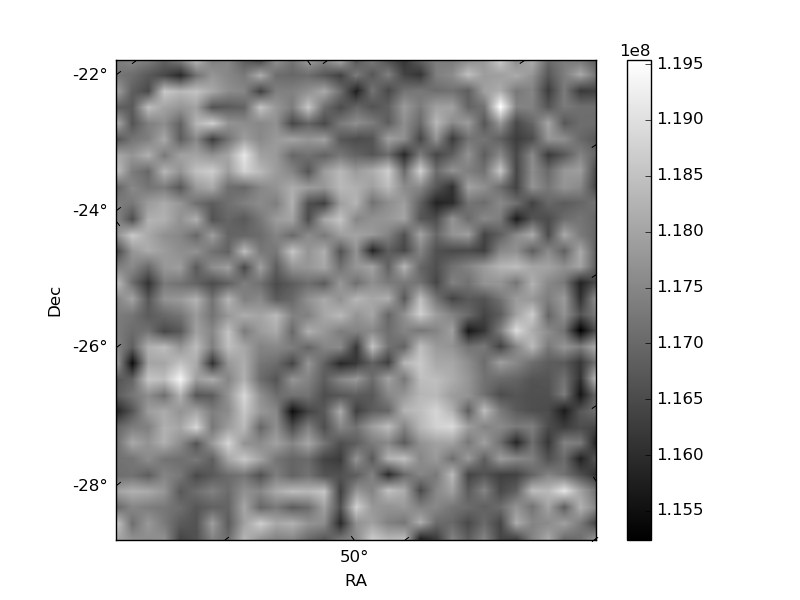
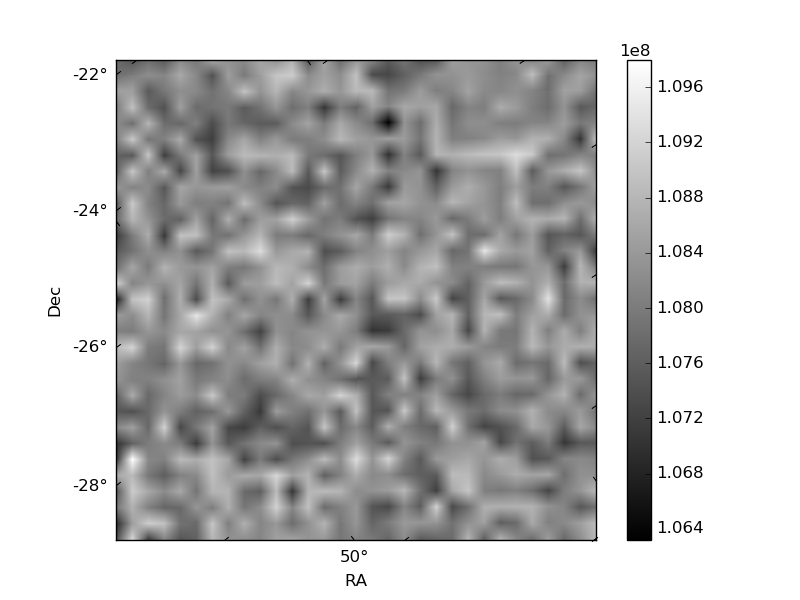
Histogram calculated using DETX and DETY for each event in the final _common_clean file
| Quadrant A | 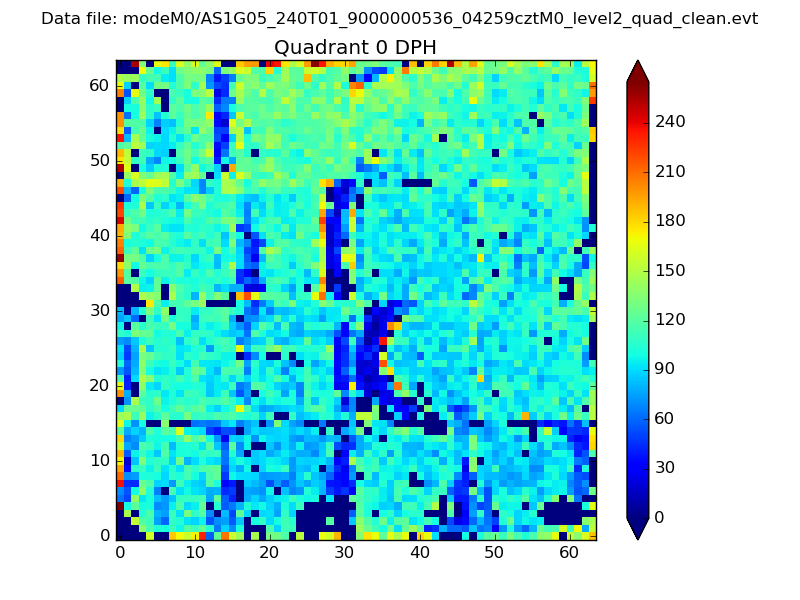 |
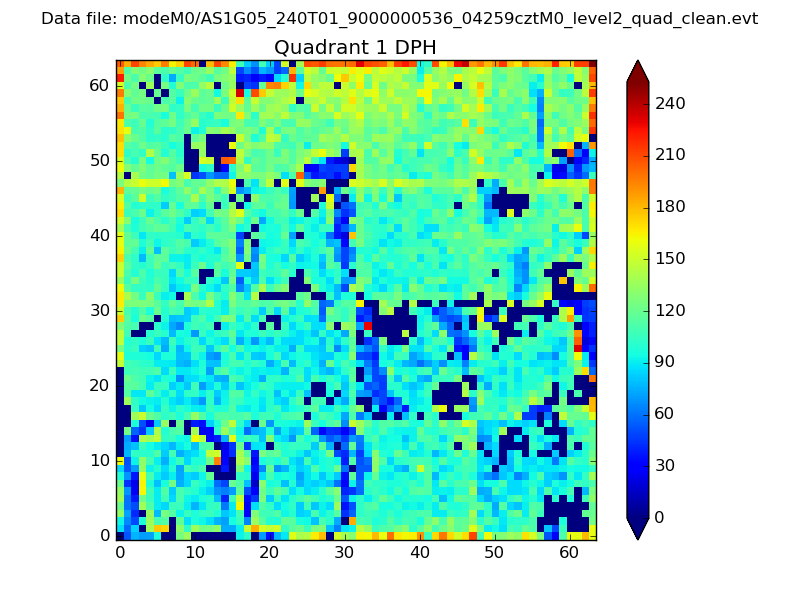 |
Quadrant B |
|---|---|---|---|
| Quadrant D | 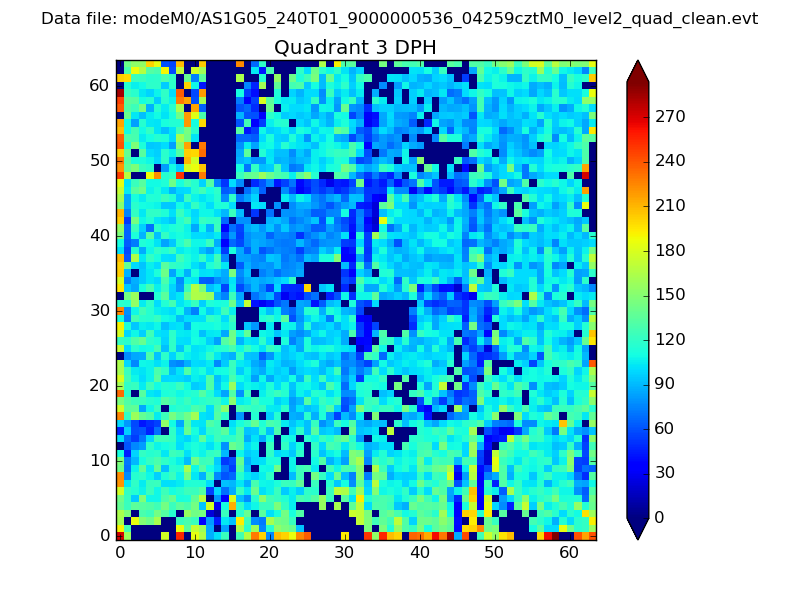 |
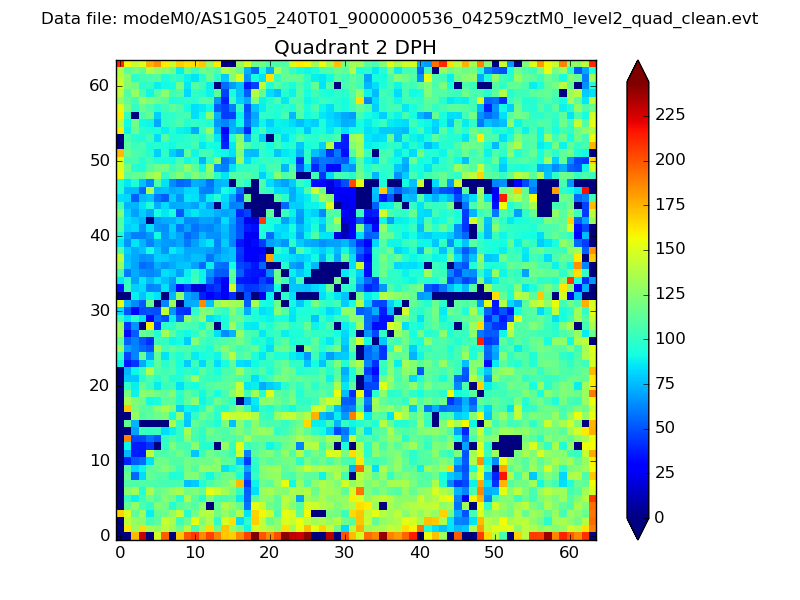 |
Quadrant C |
| Plot type | Count rate plots | Images |
|---|---|---|
| Comparison with Poisson distribution Blue bars denote a histogram of data divided into 1 sec bins. Red curve is a Poisson curve with rate = median count rate of data. |
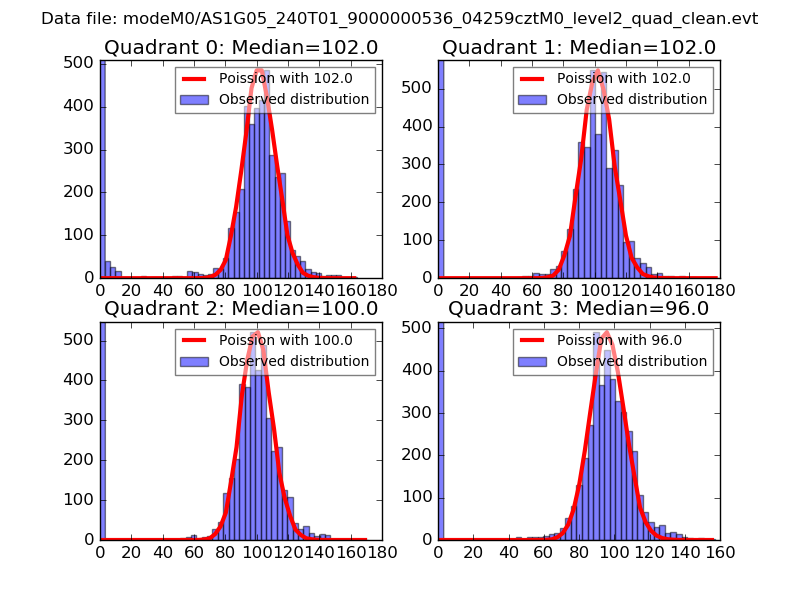 |
 |
| Quadrant-wise count rates Data is divided into 100 sec bins |
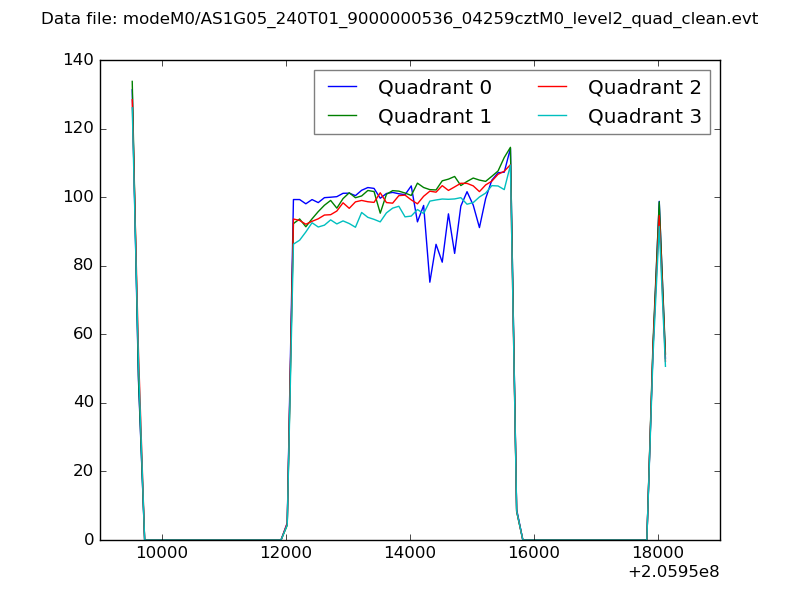 |
|
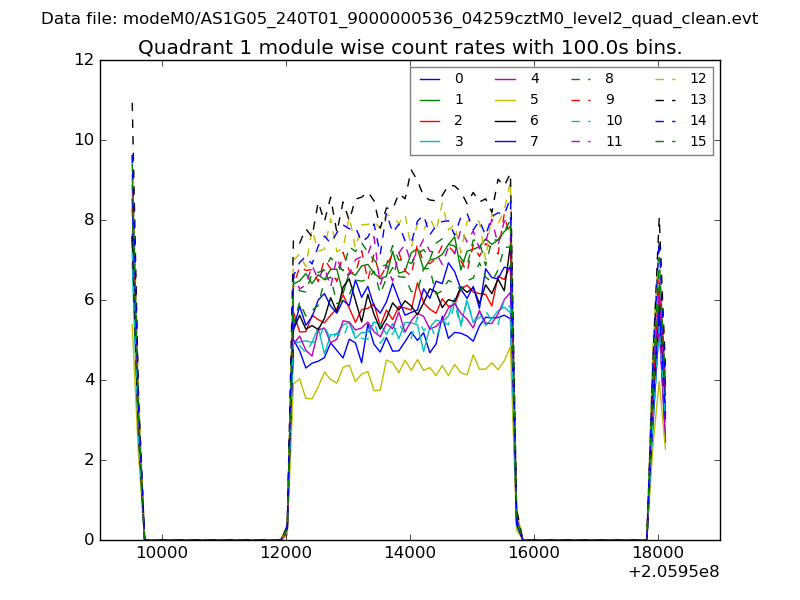
| Module-wise count rates for Quadrant A Data is divided into 100 sec bins |
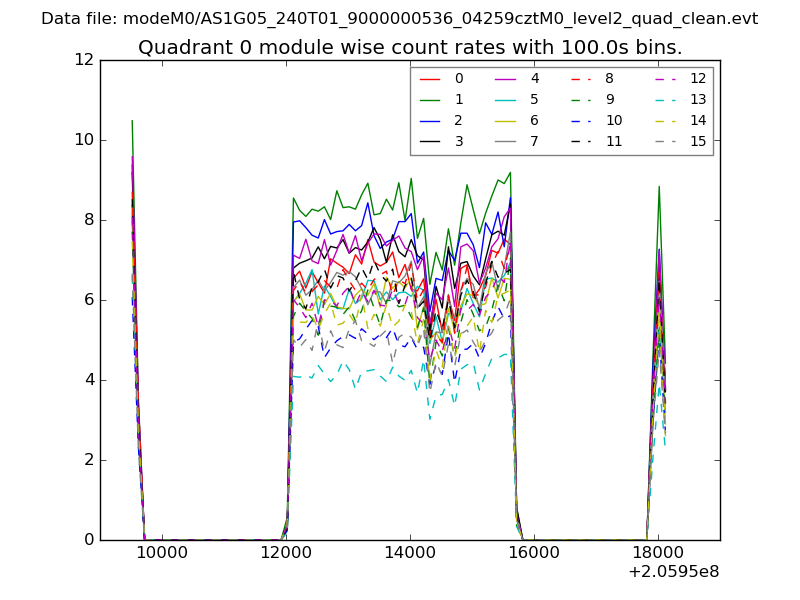 |
 |
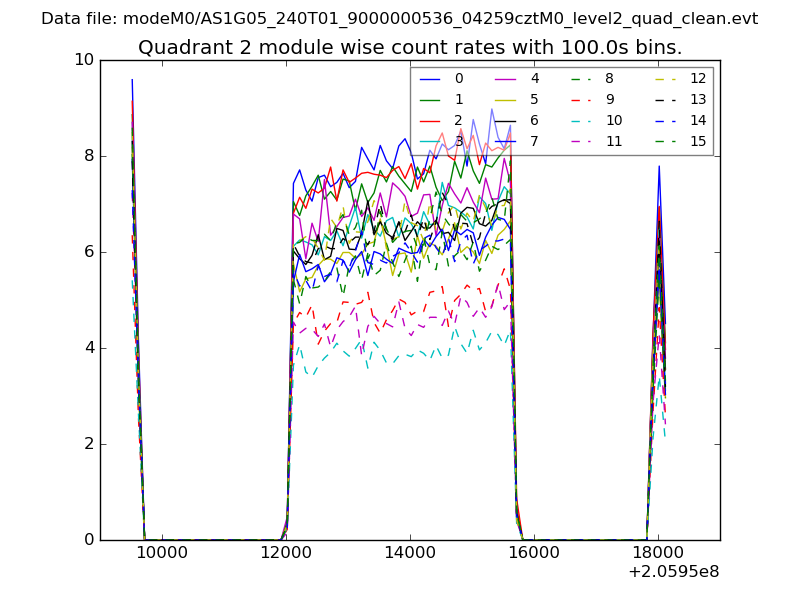
| Module-wise count rates for Quadrant B Data is divided into 100 sec bins |
 |
 |
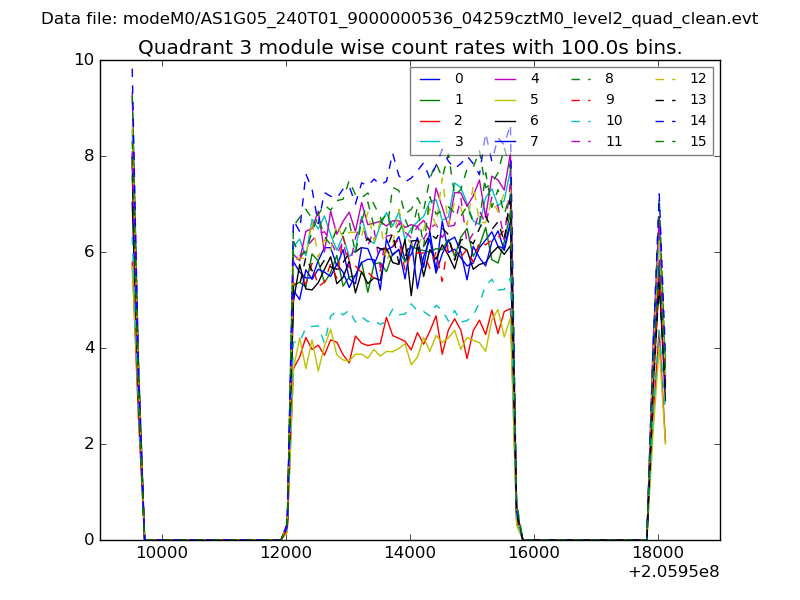
| Module-wise count rates for Quadrant C Data is divided into 100 sec bins |
 |
 |
| Module-wise count rates for Quadrant D Data is divided into 100 sec bins |
 |
 |
| Parameter | Plot |
|---|---|
| CZT HV Monitor | 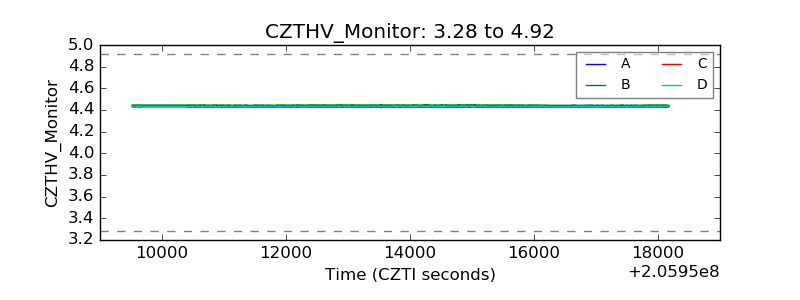 |
| D_VDD | 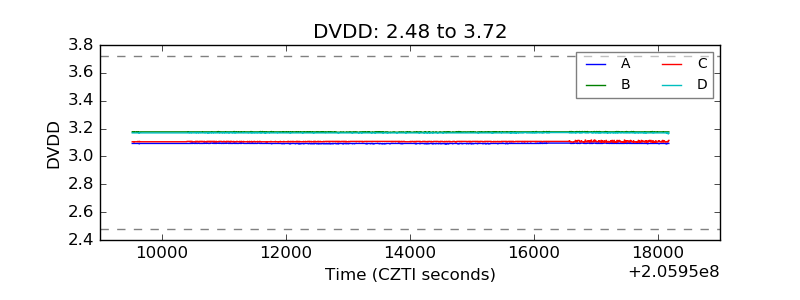 |
| Temperature 1 | 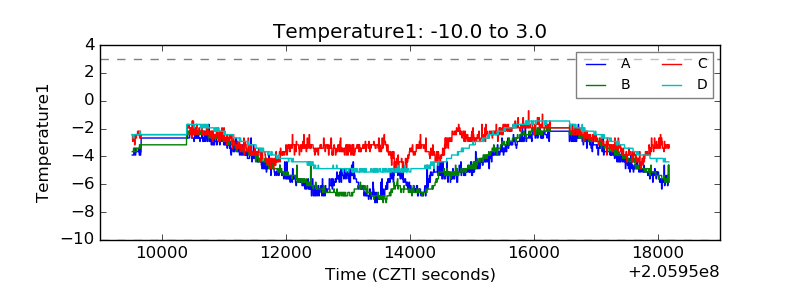 |
| Veto HV Monitor | 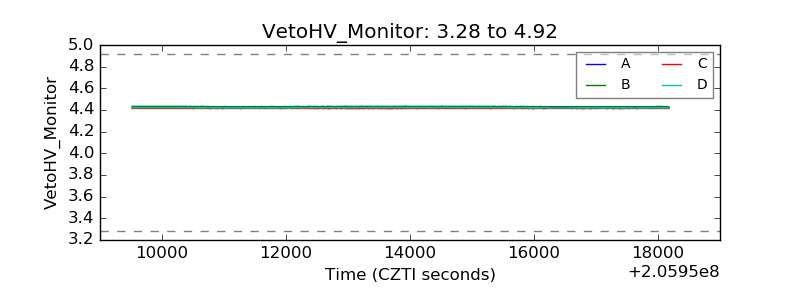 |
| Veto LLD | 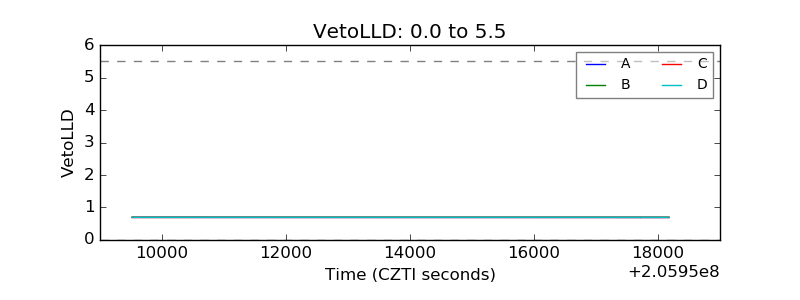 |
| Alpha Counter | 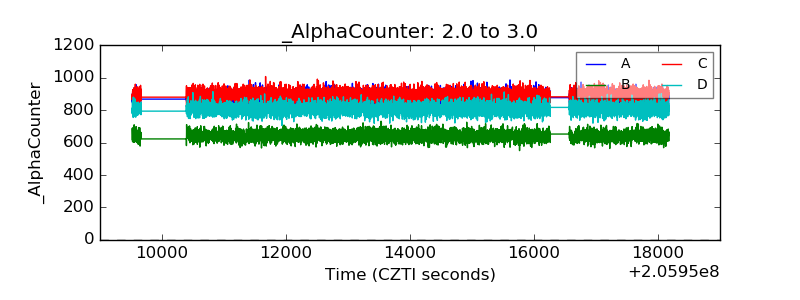 |
| _CPM_Rate | 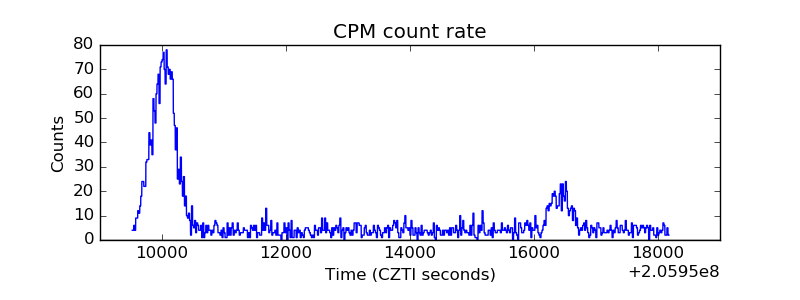 |
| CZT Counter | 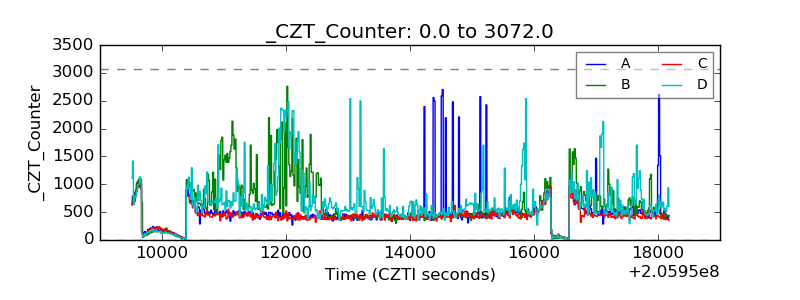 |
| +2.5 Volts monitor | 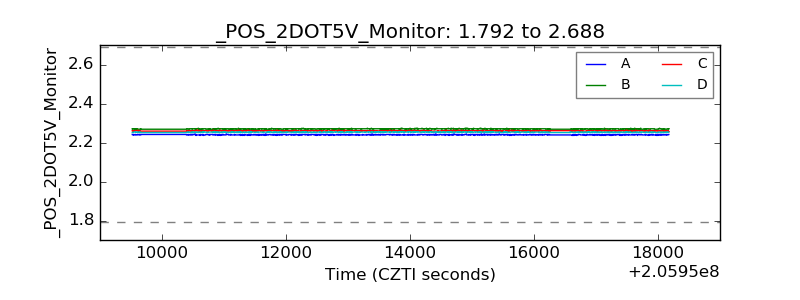 |
| +5 Volts monitor |  |
| _ROLL_ROT | 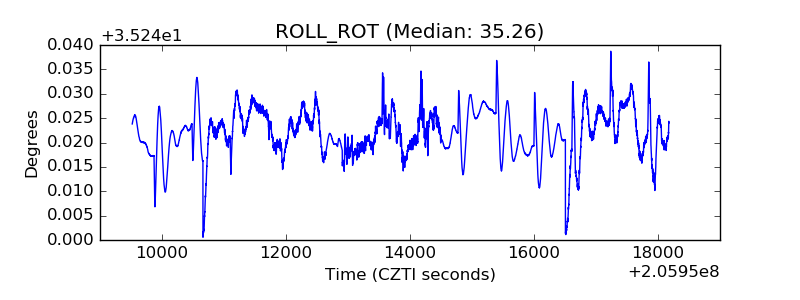 |
| _Roll_DEC | 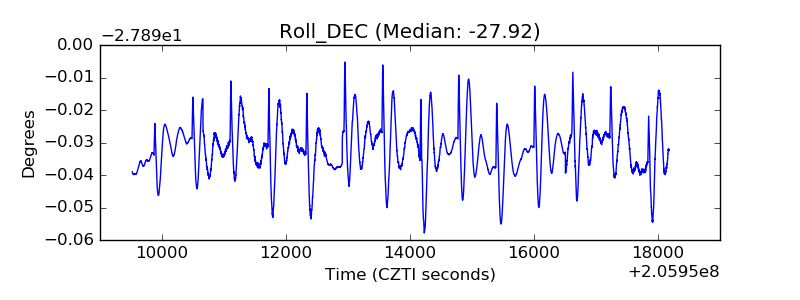 |
| _Roll_RA |  |
| Veto Counter | 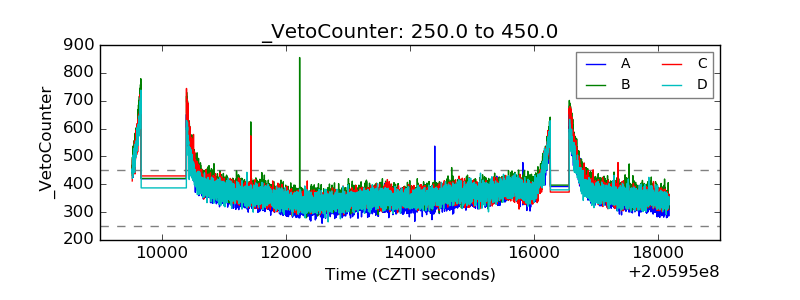 |