| Param | Original file | Final file |
|---|---|---|
| Filename | modeM0/AS1G05_240T01_9000000536_04265cztM0_level2.evt | modeM0/AS1G05_240T01_9000000536_04265cztM0_level2_quad_clean.evt |
| Size (bytes) | 35,576,640 | 9,184,320 |
| Size | 33.9 MB | 8.8 MB |
| Events in quadrant A | 358,522 | 79,467 |
| Events in quadrant B | 36,980 | 7,348 |
| Events in quadrant C | 343,269 | 79,364 |
| Events in quadrant D | 292,570 | 60,337 |
| Mode SS | |||
|---|---|---|---|
| Quadrant | BADHDUFLAG | Total packets | Discarded packets |
| A | 0 | 69 | 29 |
| B | 0 | 69 | 39 |
| C | 0 | 69 | 35 |
| D | 0 | 68 | 36 |
| Mode M9 | |||
|---|---|---|---|
| Quadrant | BADHDUFLAG | Total packets | Discarded packets |
| A | 0 | 8 | 0 |
| B | 0 | 10 | 0 |
| C | 0 | 8 | 0 |
| D | 0 | 10 | 0 |
| Mode M0 | |||
|---|---|---|---|
| Quadrant | BADHDUFLAG | Total packets | Discarded packets |
| A | 0 | 6955 | 5408 |
| B | 0 | 9603 | 9460 |
| C | 0 | 6716 | 5139 |
| D | 0 | 8252 | 6942 |
| Quadrant | Total seconds | Saturated seconds | Saturation percentage |
|---|---|---|---|
| A | 774 | 1 | 0.129199% |
| B | 72 | 1 | 1.388889% |
| C | 790 | 1 | 0.126582% |
| D | 656 | 1 | 0.152439% |
Noise dominated data is calculated using 1-second bins in cleaned event files. If a bin has >2000 counts, and if more than 50% of those come from <1% of pixels, then it is considered to be noise-dominated and hence unusable.
| Quadrant | # 1 sec bins | Bins with >0 counts | Bins with >2000 counts | High rate bins dominated by noise | Noise dominated (total time) | Noise dominated (detector-on time) | Marked lightcurve |
|---|---|---|---|---|---|---|---|
| A | 7636 | 1545 | 0 | 0 | 0.00% | 0.00% | 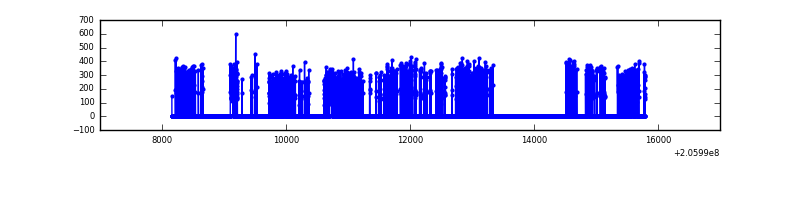 |
| B | 7460 | 142 | 0 | 0 | 0.00% | 0.00% | 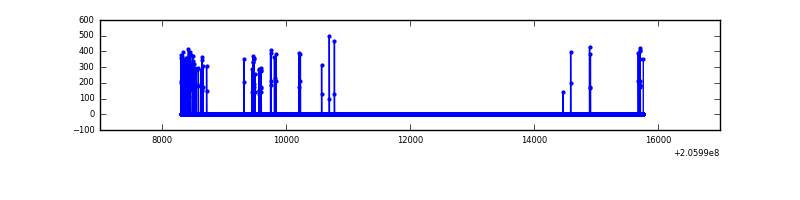 |
| C | 7635 | 1577 | 0 | 0 | 0.00% | 0.00% | 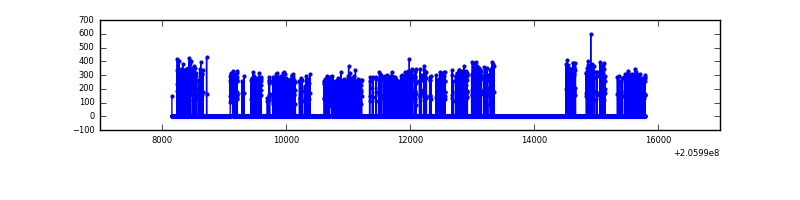 |
| D | 7181 | 1308 | 0 | 0 | 0.00% | 0.00% |  |
Top three noisy pixels from each quadrant. If the there are fewer than three noisy pixels in the level2.evt file, extra rows are filled as -1
| Pixel properties | Quadrant properties | ||||||
|---|---|---|---|---|---|---|---|
| Quadrant | DetID | PixID | Counts | Sigma | Mean | Median | Sigma |
| A | 8 | 15 | 15811 | 792.93 | 87 | 86 | 19.8 |
| A | 0 | 50 | 3326 | 163.38 | 87 | 86 | 19.8 |
| A | 0 | 226 | 942 | 43.16 | 87 | 86 | 19.8 |
| B | 3 | 0 | 4752 | 1440.43 | 8 | 8 | 3.3 |
| B | 12 | 111 | 128 | 36.44 | 8 | 8 | 3.3 |
| B | 11 | 111 | 106 | 29.76 | 8 | 8 | 3.3 |
| C | 9 | 144 | 974 | 39.78 | 87 | 86 | 22.3 |
| C | 10 | 65 | 800 | 31.99 | 87 | 86 | 22.3 |
| C | 13 | 61 | 717 | 28.27 | 87 | 86 | 22.3 |
| D | 2 | 232 | 6768 | 346.68 | 71 | 69 | 19.3 |
| D | 13 | 239 | 5534 | 282.82 | 71 | 69 | 19.3 |
| D | 9 | 68 | 1572 | 77.78 | 71 | 69 | 19.3 |
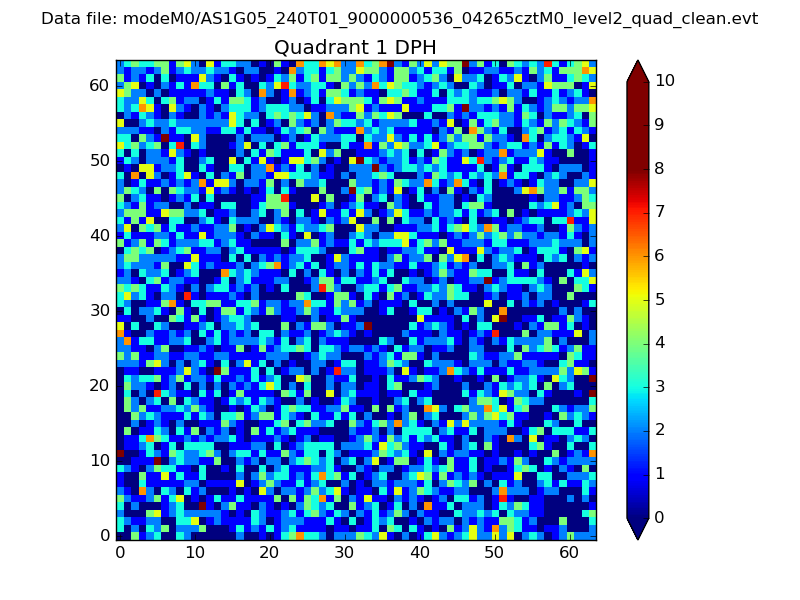
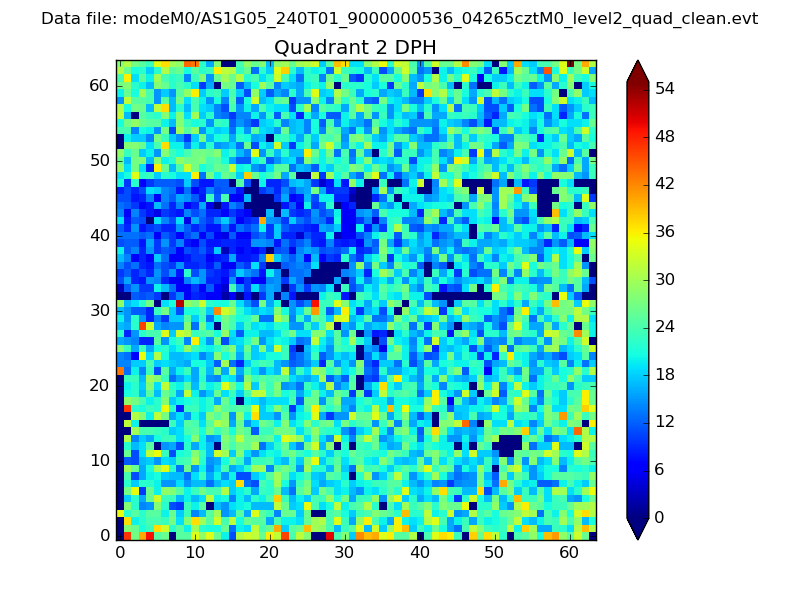
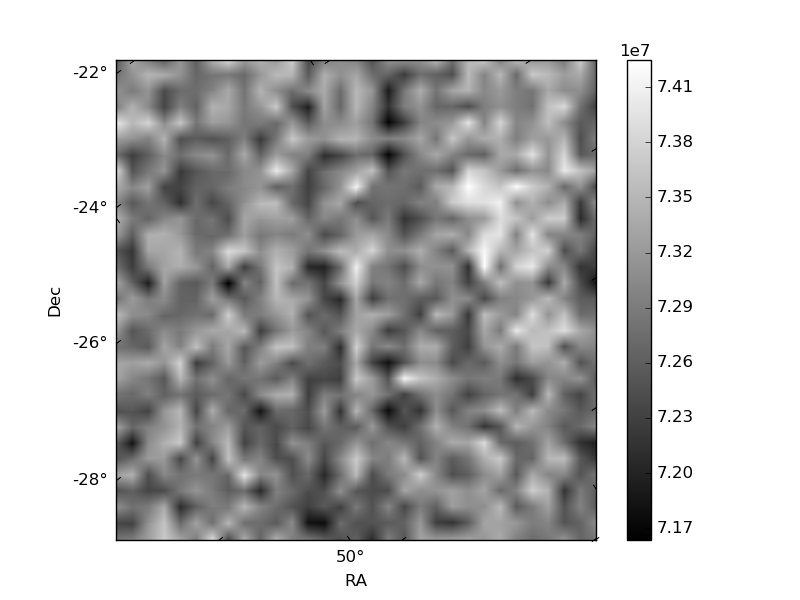
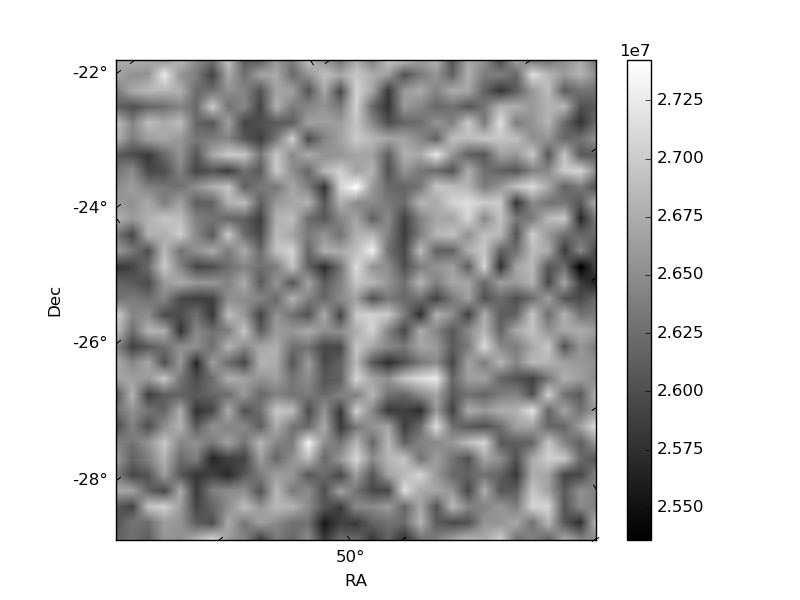
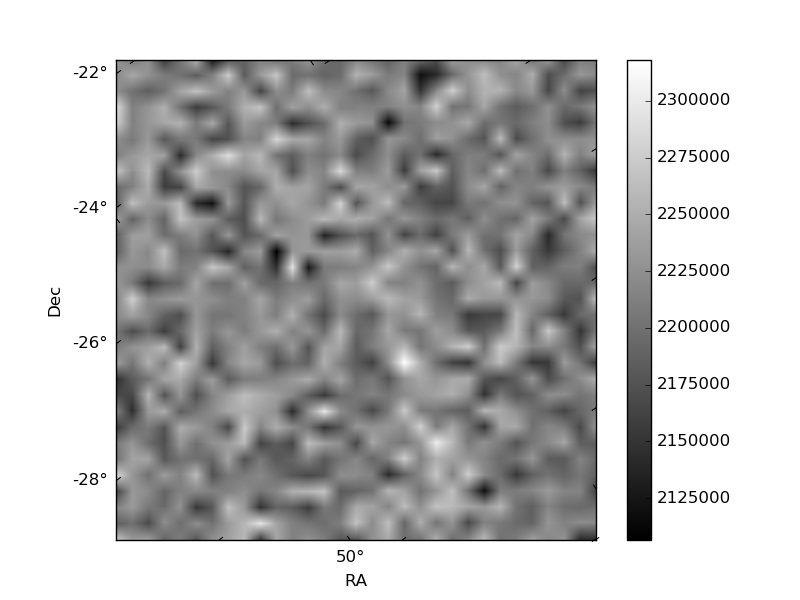
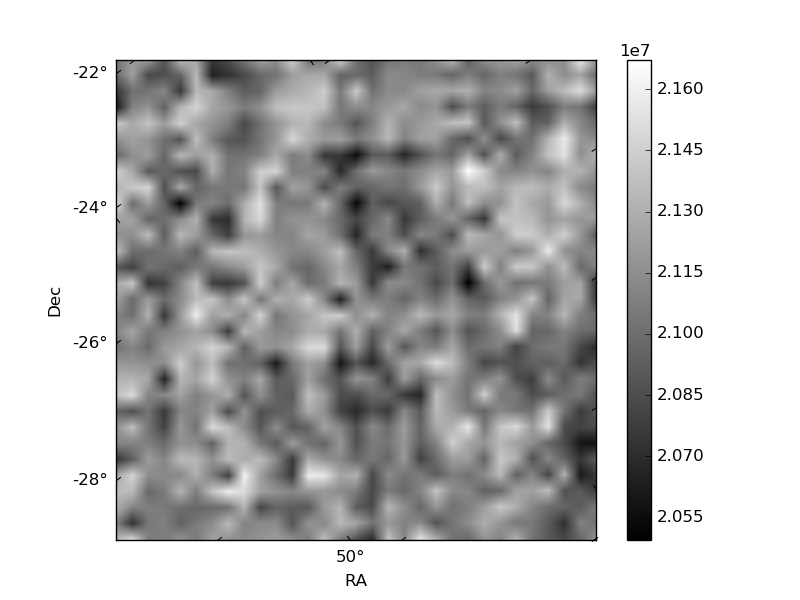
Histogram calculated using DETX and DETY for each event in the final _common_clean file
| Quadrant A | 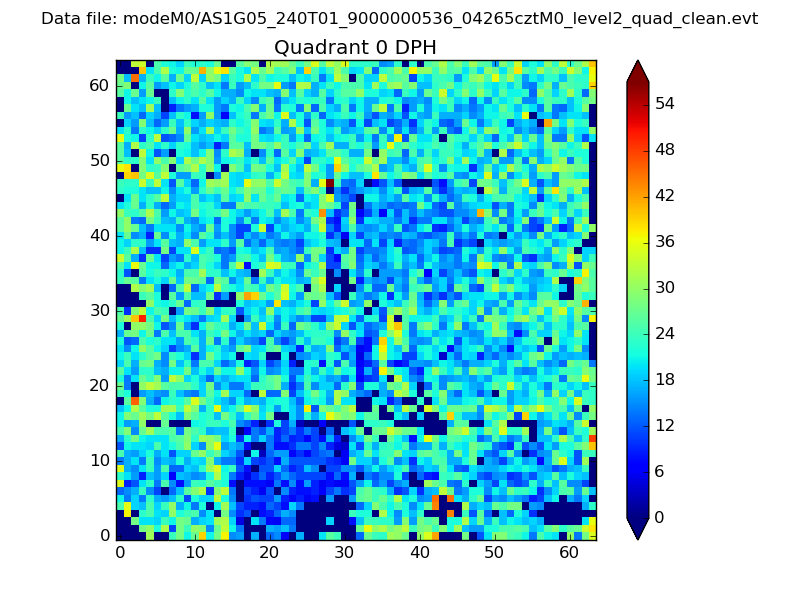 |
 |
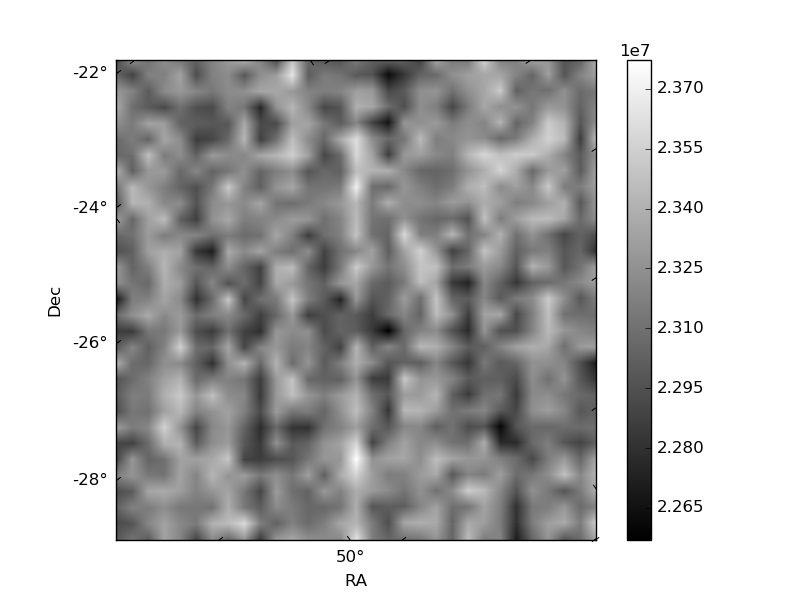
Quadrant B |
|---|---|---|---|
| Quadrant D | 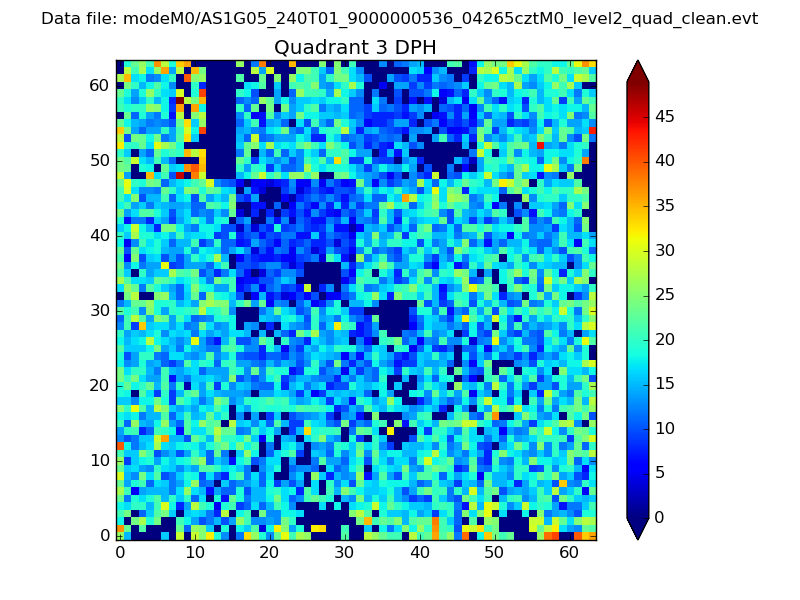 |
 |
Quadrant C |
| Plot type | Count rate plots | Images |
|---|---|---|
| Comparison with Poisson distribution Blue bars denote a histogram of data divided into 1 sec bins. Red curve is a Poisson curve with rate = median count rate of data. |
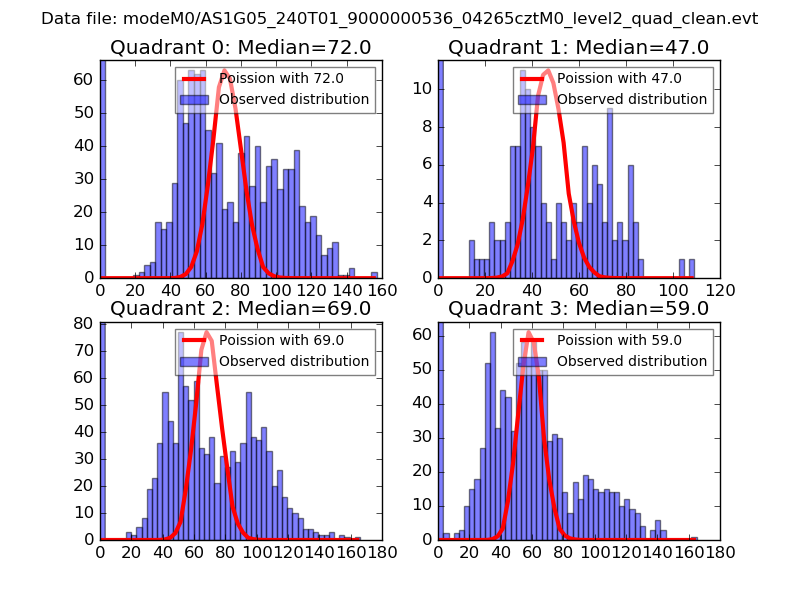 |
 |
| Quadrant-wise count rates Data is divided into 100 sec bins |
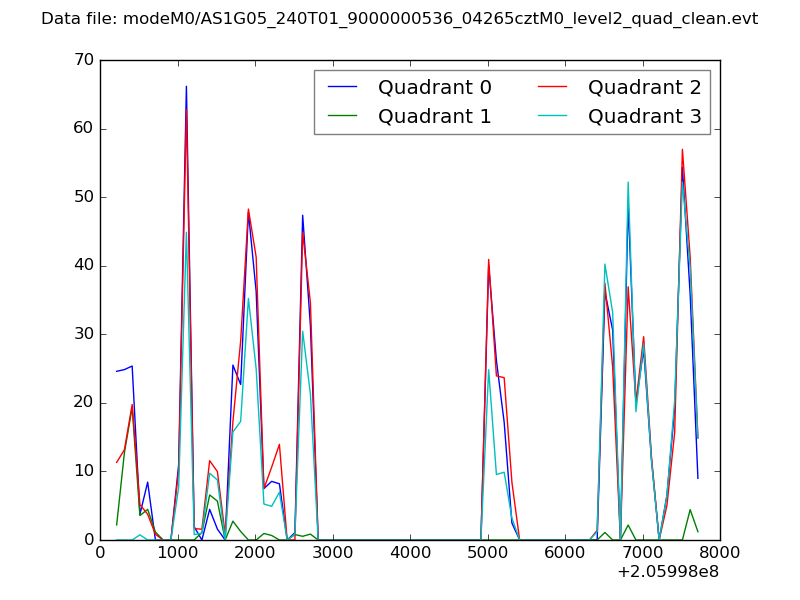 |
|
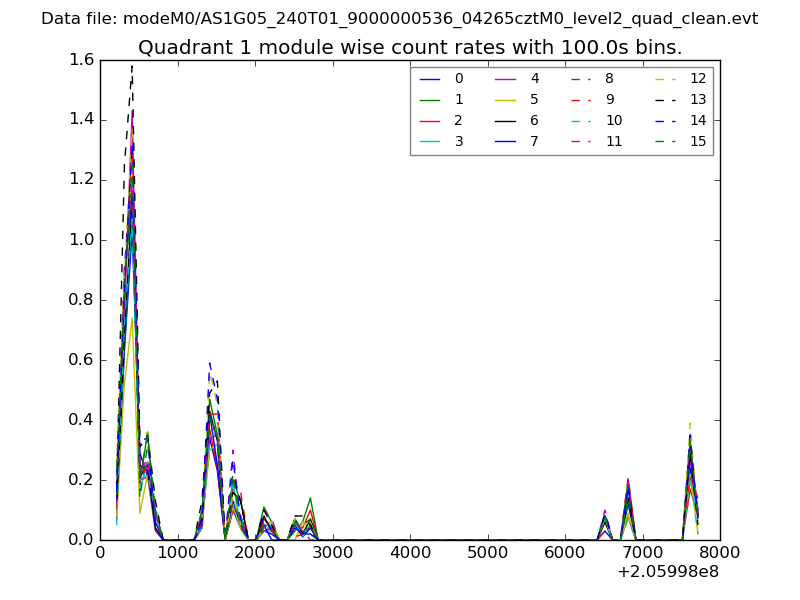
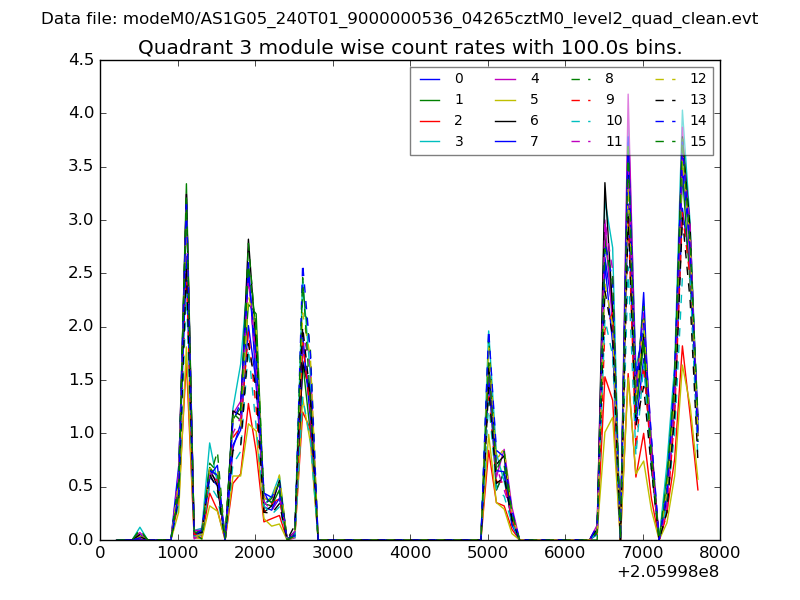
| Module-wise count rates for Quadrant A Data is divided into 100 sec bins |
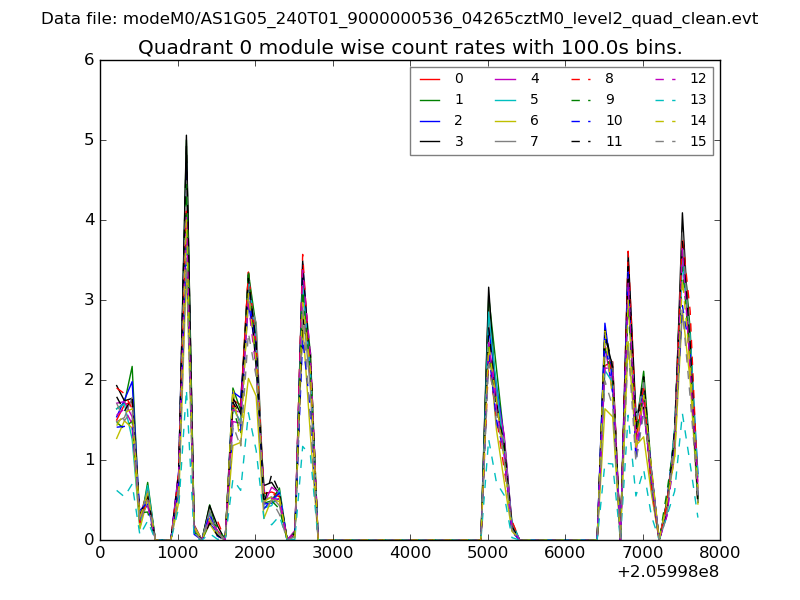 |
 |
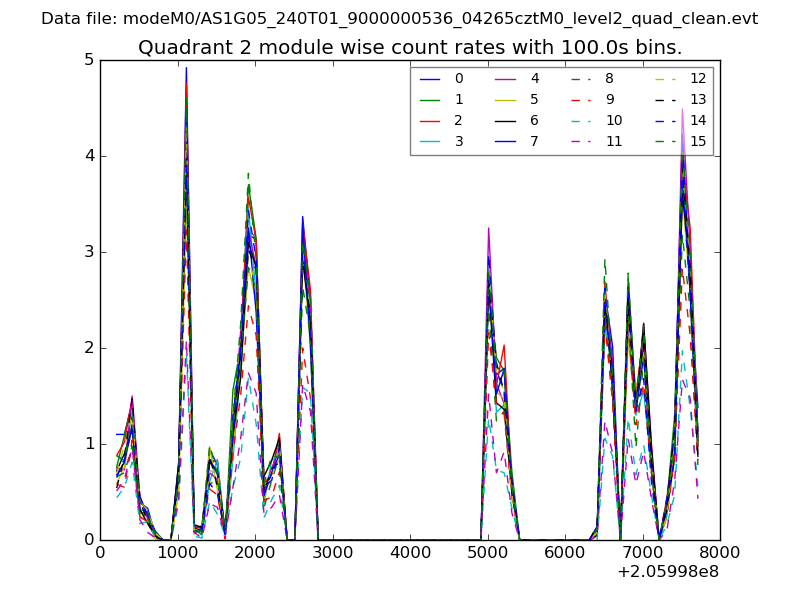
| Module-wise count rates for Quadrant B Data is divided into 100 sec bins |
 |
 |
| Module-wise count rates for Quadrant C Data is divided into 100 sec bins |
 |
 |
| Module-wise count rates for Quadrant D Data is divided into 100 sec bins |
 |
 |
| Parameter | Plot |
|---|---|
| CZT HV Monitor | 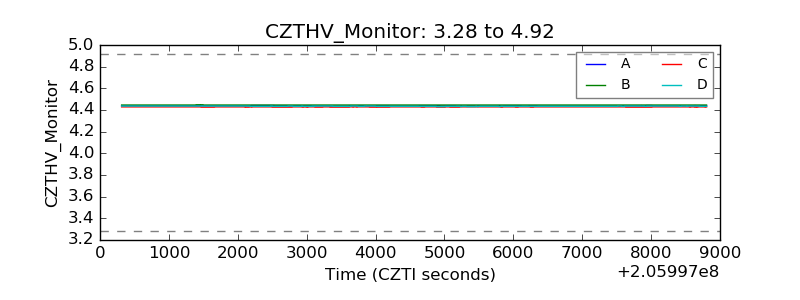 |
| D_VDD | 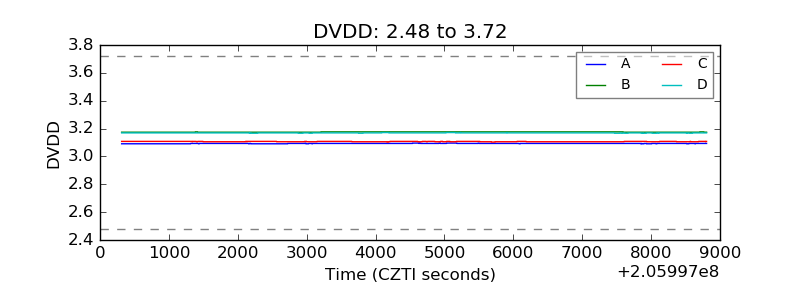 |
| Temperature 1 | 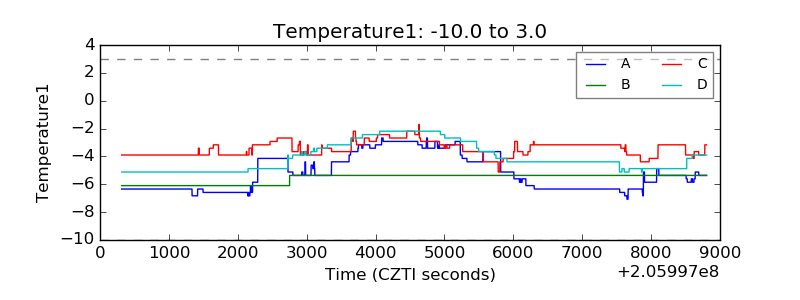 |
| Veto HV Monitor |  |
| Veto LLD | 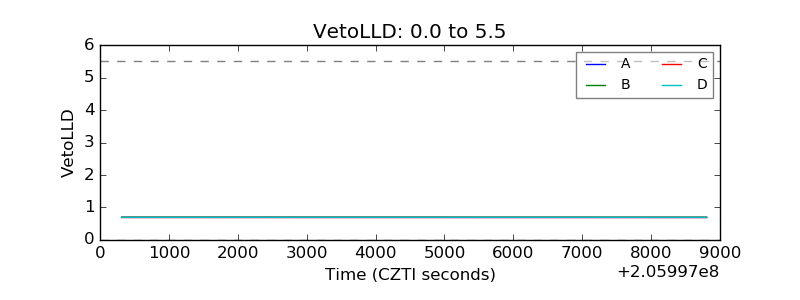 |
| Alpha Counter | 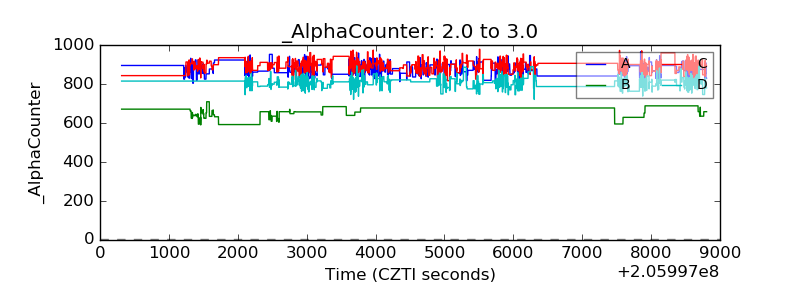 |
| _CPM_Rate | 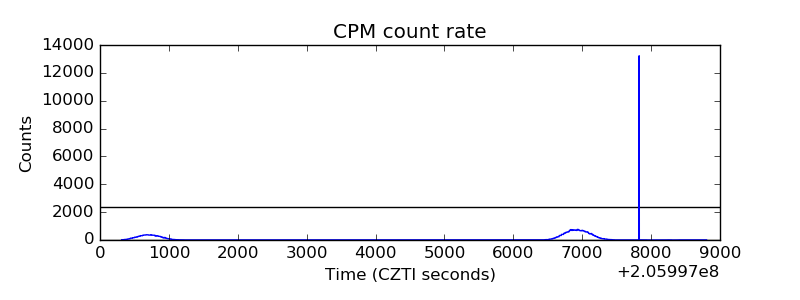 |
| CZT Counter | 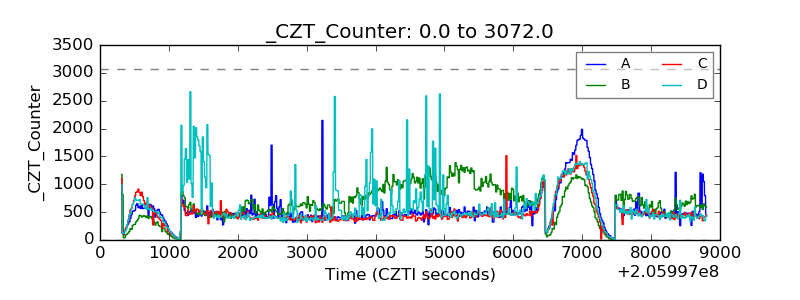 |
| +2.5 Volts monitor |  |
| +5 Volts monitor |  |
| _ROLL_ROT | 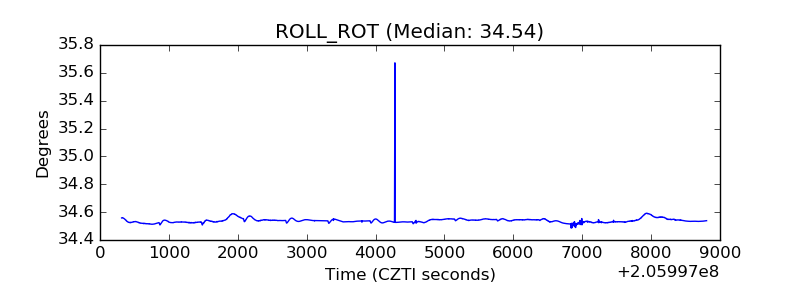 |
| _Roll_DEC | 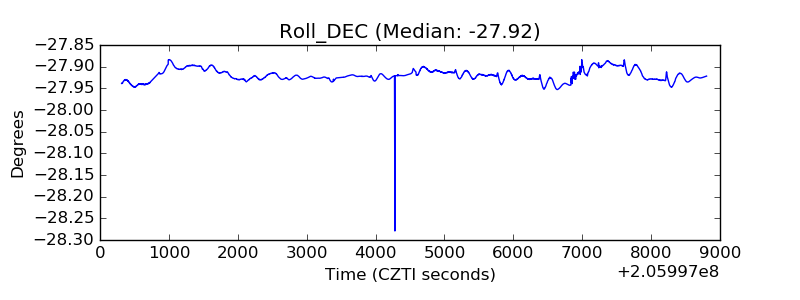 |
| _Roll_RA | 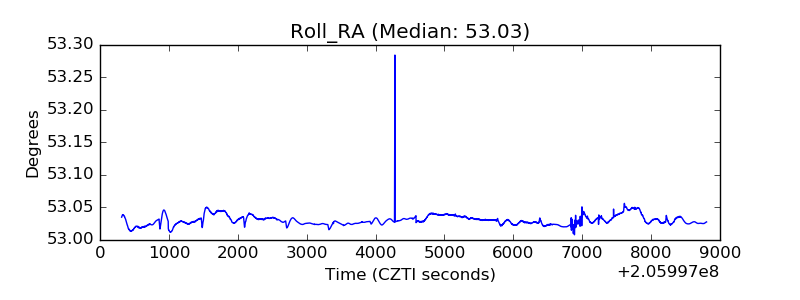 |
| Veto Counter | 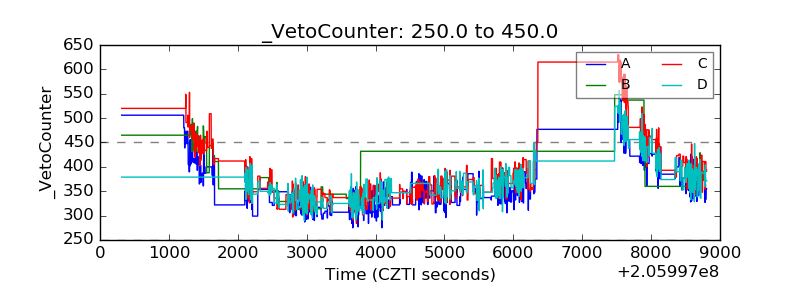 |